





Background
Endocannabinoid & related lipids: overview
The endogenous endocannabinoid (eCB) system has gained significant attention in relation to brain health in recent years. It includes two endogenous lipid ligands (N-arachidonoylethanolamine; anandamide [AEA] and 2-arachidonoylglycerol [2-AG]), enzymes related to their biosynthesis, degradation enzymes (e.g., fatty acid amide hydrolase [FAAH] and monoacylglycerol lipase), related lipid mediators that share biochemical properties (oleoylethanolaminae [OEA], palmitoylethanolamide [PEA], and 2-oleoylglycerol [2-OG]), and cannabinoid receptors type 1 (CB1) and 2 (CB2) (Hillard, Reference Hillard2018). Both CB1 and CB2 receptor subtypes can be found in the central nervous system (CNS) and the periphery. Understanding the diverse and developmentally dynamic biological mechanisms associated with these ligands, mediators, and broadly expressed receptors of the eCB system provides the basis for the analytic process and theoretical understanding of the present analyses on the associations between brain structure and circulating eCBs and related lipids in developing teens.
In the CNS, CB1 receptors are found throughout cortical and subcortical structures and are localized on axons, oligodendrocytes, and astrocytes while CB2 receptors are thought to play a critical role in the function of oligodendrocytes (De Almeida et al., Reference De Almeida, Seabra, Reis-de-Oliveira, Zuccoli, Rumin, Fioramonte, Smith, Zuardi, Hallak, Campos, Crippa and Martins-de-Souza2022). AEA and 2-AG are agonists for CB1 and CB2 receptors, also act on the vanilloid receptor (TRPV1), and AEA is an agonist for some peroxisome proliferator activated receptors (PPAR) such as PPARα, a receptor associated with anti-inflammatory and anorexigenic processes (Esposito et al., Reference Esposito, Capoccia, Turco, Palumbo, Lu, Steardo, Cuomo, Sarnelli and Steardo2014; Guzmán et al., Reference Guzmán, Lo Verme, Fu, Oveisi, Blázquez and Piomelli2004; Lo Verme et al., Reference Lo Verme, Fu, Astarita, La Rana, Russo, Calignano and Piomelli2005).
Similar to AEA, lipid modulators PEA and OEA are members of the N-acyl ethanolamine (NAE) family and are thought to directly interact with AEA concentrations, as they are all catabolized by N-acylethanolamine-hydrolyzing acid amidase and FAAH. PEA and OEA also both act on PPARα and GPR119, which regulates feeding behavior, and PEA solely appears to interact with TRPV1 and GPR55, an orphan receptor thought to play a role in metabolism (Capasso et al., Reference Capasso, Orlando, Pagano, Aveta, Buono, Borrelli, Di Marzo and Izzo2014; De Petrocellis et al., Reference De Petrocellis, Davis and Di Marzo2001; Fu et al., Reference Fu, Gaetani, Oveisi, Lo Verme, Serrano, Rodríguez de Fonseca, Rosengarth, Luecke, Di Giacomo, Tarzia and Piomelli2003; Lo Verme et al., Reference Lo Verme, Fu, Astarita, La Rana, Russo, Calignano and Piomelli2005; Mock et al., Reference Mock, Gagestein and van der Stelt2023; Overton et al., Reference Overton, Babbs, Doel, Fyfe, Gardner, Griffin, Jackson, Procter, Rasamison, Tang-Christensen, Widdowson, Williams and Reynet2006; Ryberg et al., Reference Ryberg, Larsson, Sjögren, Hjorth, Hermansson, Leonova, Elebring, Nilsson, Drmota and Greasley2007). In sum, these lipid modulators are associated with the same biosynthetic and catabolic pathways as AEA and 2-AG and are, in turn, associated with eCB functioning; thus, the interplay between these additional eCB molecules are important to consider, both in terms of theoretical models and statistical analyses, when examining the role of eCB functioning in brain structure development.
eCB system and adolescent brain development
Adolescence is a period of significant neurodevelopment, during which brains undergo synaptic pruning with co-occurring increases in myelination and improved white matter integrity (Giedd et al., Reference Giedd, Blumenthal, Jeffries, Castellanos, Liu, Zijdenbos, Paus, Evans and Rapoport1999; Ladouceur et al., Reference Ladouceur, Peper, Crone and Dahl2012; Paus, Reference Paus2005). Subcortical regions (i.e., amygdala, hippocampus, nucleus accumbens) and temporal and occipital cortices develop first in preadolescence and remain stable or slightly increase during teen years, while pruning of frontal and parietal regions continues into early adulthood (Casey et al., Reference Casey, Jones and Hare2008; Galvan et al., Reference Galvan, Hare, Parra, Penn, Voss, Glover and Casey2006; Mills et al., Reference Mills, Goddings, Clasen, Giedd and Blakemore2014; Raznahan et al., Reference Raznahan, Shaw, Lerch, Clasen, Greenstein, Berman, Pipitone, Chakravarty and Giedd2014). While CB1 receptors are found throughout the CNS, positron emission tomography (PET) studies in adults have indicated higher availability of CB1 receptors in areas that undergo significant adolescent neurodevelopment, including subcortical and cortical regions including the caudate, nucleus accumbens, cingulate, insula, parietal cortex, and prefrontal cortex (PFC) (Laurikainen et al., Reference Laurikainen, Tuominen, Tikka, Merisaari, Armio, Sormunen, Borgan, Veronese, Howes, Haaparanta-Solin, Solin and Hietala2019). Findings from non-human animal studies suggest that AEA, OEA, PEA and CB1 receptor density peak during adolescence (postnatal days ∼ 28–50 in rats) and the eCB system plays a significant role in processes underlying neurodevelopment including presynaptic neuromodulation, regulation of cellular metabolism, glial regulation, modulating white matter integrity, fine tuning of functional coupling and dendritic complexity, and pruning of weak connections (Ellgren et al., Reference Ellgren, Artmann, Tkalych, Gupta, Hansen, Hansen, Devi and Hurd2008; Gee et al., Reference Gee, Fetcho, Jing, Li, Glatt, Drysdale, Cohen, Dellarco, Yang, Dale, Jernigan, Lee, Casey, Jernigan, San Diego, McCabe, San Diego and Gruen2016; Gutiérrez-Rodríguez et al., Reference Gutiérrez-Rodríguez, Bonilla-Del Río, Puente, Gómez-Urquijo, Fontaine, Egaña-Huguet, Elezgarai, Ruehle, Lutz, Robin, Soria-Gómez, Bellocchio, Padwal, van der Stelt, Mendizabal-Zubiaga, Reguero, Ramos, Gerrikagoitia, Marsicano and Grandes2018; Hebert-Chatelain et al., Reference Hebert-Chatelain, Reguero, Puente, Lutz, Chaouloff, Rossignol, Piazza, Benard, Grandes and Marsicano2014; Heng et al., Reference Heng, Beverley, Steiner and Tseng2011; Lee et al., Reference Lee, Hill, Hillard and Gorzalka2013; Meyer et al., Reference Meyer, Lee and Gee2018; Molina-Holgado et al., Reference Molina-Holgado, Vela, Arévalo-Martín, Almazán, Molina-Holgado, Borrell and Guaza2002; Oltrabella et al., Reference Oltrabella, Melgoza, Nguyen and Guo2017; Rubino et al., Reference Rubino, Prini, Piscitelli, Zamberletti, Trusel, Melis, Sagheddu, Ligresti, Tonini, Di Marzo and Parolaro2015). Perhaps the most well-established function of the eCB system is as a mediator of activity-dependent, retrograde inhibition of synaptic activity at both glutamatergic and GABAergic synapses that influences the strengthening of synaptic connections (Katona et al., Reference Katona, Sperlágh, Sík, Käfalvi, Vizi, Mackie and Freund1999; Lafourcade et al., Reference Lafourcade, Elezgarai, Mato, Bakiri, Grandes and Manzoni2007; Nyíri et al., Reference Nyíri, Cserép, Szabadits, Mackie and Freund2005) and synaptic pruning and glial functioning via Hebbian plasticity particularly in brain regions like the PFC and parietal cortices (Dow-Edwards & Silva, Reference Dow-Edwards and Silva2017; Molla et al., Reference Molla, Miguelez Fernández and Tseng2024; Rubino et al., Reference Rubino, Prini, Piscitelli, Zamberletti, Trusel, Melis, Sagheddu, Ligresti, Tonini, Di Marzo and Parolaro2015). Further, the eCB system impacts white matter development as CB1 and CB2 receptors are on oligodendrocytes and preclinical evidence shows that the eCB system plays a critical role in the survival, differentiation, and proliferation of oligodendrocytes and their precursors (De Almeida et al., Reference De Almeida, Seabra, Reis-de-Oliveira, Zuccoli, Rumin, Fioramonte, Smith, Zuardi, Hallak, Campos, Crippa and Martins-de-Souza2022; Ilyasov et al., Reference Ilyasov, Milligan, Pharr and Howlett2018) especially during adolescence (e.g., PND 30 in rats; de Fonseca et al., Reference de Fonseca, Ramos, Bonnin and Fernández-Ruiz1993). Thus, disrupted or reduced eCB signaling during late childhood and early adolescence may result in disrupted adolescent structural brain development, though evidence in humans is lacking.
Circulating eCB levels in humans
Direct quantification of eCBs in the brain in adolescent humans is not currently feasible due to the inherent invasiveness of available techniques (e.g., PET or collection of cerebrospinal fluid) but circulating serum eCB concentrations can be measured relatively easily with non-invasive blood samples (Hillard, Reference Hillard2018). Although the extent to which circulating eCBs reflect peripheral or brain levels is not yet fully understood in humans (deRoon-Cassini et al., Reference deRoon-Cassini, Bergner, Chesney, Schumann, Lee, Brasel and Hillard2022), evidence in male mice between 6 and 9 weeks of age shows strong correlations between circulating and brain levels (Bedse et al., Reference Bedse, Hartley, Neale, Gaulden, Patrick, Kingsley, Uddin, Plath, Marnett and Patel2017), there is high test-retest reliability in healthy young adults (Hanlon et al., Reference Hanlon, Tasali, Leproult, Stuhr, Doncheck, de Wit, Hillard and Van Cauter2016), and there is evidence that serum concentrations of circulating eCBs and associated lipids are differentially associated with affective, stress, and neurocognitive functioning in adults (Dlugos et al., Reference Dlugos, Childs, Stuhr, Hillard and de Wit2012; Hill et al., Reference Hill, Miller, Ho, Gorzalka and Hillard2008; Hillard, Reference Hillard2018) and preliminary evidence in teens (Ferger et al., Reference Ferger, Sigrist, Brodesser, Kaess and Koenig2024; Marusak et al., Reference Marusak, Ely, Zundel, Gowatch, Shampine, Carpenter, Tamimi, Jaster, Shakir, May, deRoon-Cassini and Hillard2024). Ferger and colleagues (Reference Ferger, Sigrist, Brodesser, Kaess and Koenig2024) reported reduced circulating AEA levels in adolescents with non-suicidal self-injury. In contrast, Marusak and colleagues (Reference Marusak, Ely, Zundel, Gowatch, Shampine, Carpenter, Tamimi, Jaster, Shakir, May, deRoon-Cassini and Hillard2024) found that greater AEA levels were linked with more severe PTSD symptoms in trauma-exposed adolescents. In adults, eCB levels have been linked with cognition; in one sample of 150 adult females, 2-AG was negatively correlated with cognitive flexibility while AEA levels were positively correlated with cognitive flexibility and decision-making performance (Fagundo et al., Reference Fagundo, de la Torre, Jiménez-Murcia, Agüera, Pastor, Casanueva, Granero, Baños, Botella, Del Pino-Gutierrez, Fernández-Real, Fernández-García, Frühbeck, Gómez-Ambrosi, Menchón, Moragrega, Rodríguez, Tárrega, Tinahones and Fernández-Aranda2013). In summary, concentrations of circulating eCBs and related lipids are regulated by similar mechanisms as they are in the brain and animal models suggest peripheral levels are correlated with brain levels (Bedse et al., Reference Bedse, Hartley, Neale, Gaulden, Patrick, Kingsley, Uddin, Plath, Marnett and Patel2017); thus, this eCB biomarker may partially reflect brain eCB signaling that might underlie large-scale alterations in rates of synaptic pruning and white matter development, leading to alterations in macro-level structural outcomes such as cortical thickness, surface area, and volume.
Despite abundant preclinical evidence that adolescence is a critical period for eCB functioning and structural brain development, there is a paucity of research examining these links in human youth. Here, we leverage data from a subset of participants enrolled in the Adolescent Brain and Cognitive Development (ABCD) study to evaluate cross-sectional associations between circulating concentrations of eCBs and related lipids (2-AG, AEA, OEA, and PEA) and metrics of brain structure (cortical thickness, volume, and surface area) using an exploratory structural equation modeling (SEM) framework. To our knowledge, this is the first analysis exploring the links between eCB and related lipid concentrations in serum and advanced structural neuroimaging using a national sample. Though there are no prior human studies, based on preclinical evidence we hypothesized that greater circulating eCBs would be associated with sMRI patterns suggesting greater white and gray matter expansion in regions that are typically reaching peak maturity and increased pruning in areas still undergoing substantial neurodevelopment during ages 10–14. Specifically, we hypothesize that greater circulating eCB levels will be cross-sectionally related to larger brain volume, cortical thickness, and cortical surface area in regions known to have high CB1 receptor density that are typically reaching peak maturity by ages 10–14 years (caudate, amygdala, hippocampal, insula, nucleus accumbens, cingulate, temporal, and occipital cortices) and smaller brain volume, thickness and surface area in regions still undergoing significant maturation during this period (PFC, cerebellar, and parietal cortices).
Method
Participants
The participants in the current sample were enrolled in the ABCD Study Endocannabinoid Substudy (MPIs Lisdahl, Hillard; R21DA09109), which linked circulating eCB data with the larger ABCD behavioral and magnetic resonance imaging (MRI) dataset following ABCD Study Substudy procedures and open-science methods. The larger ABCD Study cohort recruited youth ages 9–10 years old from 21 sites across the United States. Baseline recruitment of the ABCD cohort used a multi-stage probability sample of eligible children by probability sampling of schools within each catchment area in order to match the demographic profile of the American Community Sample and annual 3rd and 4th grade school enrollment statistics published by the National Center for Education Statistics (for details, see Garavan et al., Reference Garavan, Bartsch, Conway, Decastro, Goldstein, Heeringa, Jernigan, Potter, Thompson and Zahs2018). Participants included in these analyses were those individuals who a) met baseline inclusion/exclusion criteria for the larger ABCD Study (see Garavan et al., Reference Garavan, Bartsch, Conway, Decastro, Goldstein, Heeringa, Jernigan, Potter, Thompson and Zahs2018); b) opted into the ABCD Endocannabinoid Substudy, in which 8 of the 21 ABDC data collection sites participated (UWM, UCSD, MUSC, OHSU, FIU, UVM, CHLA, WUSTL); c) completed the structural neuroimaging session at the same session as the eCB blood sample was collected. There were no siblings in this subsample. Because substance use is low in this age range (<2% past year full alcohol drink or cannabis use, <2.2% nicotine use; Sullivan et al., Reference Sullivan, Wade, Wallace, Tapert, Pelham, Brown, Cloak, Ewing, Madden, Martz, Ross, Kaiver, Wirtz, Heitzeg and Lisdahl2022), youth were not excluded due to alcohol or drug experimentation. Though the larger ABCD Study is longitudinal in nature, at the time of publication only cross-sectional eCB Substudy data was available; the sample for the current analysis included 294 youth who completed the eCB Substudy during an ABCD Study MRI session year (YR2, YR4, ages 10–14).
Procedures
The ABCD Study employs state-of-the-art multimodal brain imaging (Casey et al., Reference Casey, Cannonier, Conley, Cohen, Barch, Heitzeg, Soules, Teslovich, Dellarco, Garavan, Orr, Wager, Banich, Speer, Sutherland, Riedel, Dick, Bjork and Thomas2018), demographics, physical health, mental health (Barch et al., Reference Barch, Albaugh, Avenevoli, Chang, Clark, Glantz, Hudziak, Jernigan, Tapert, Yurgelun-Todd, Alia-Klein, Potter, Paulus, Prouty, Zucker and Sher2018), substance use (Lisdahl et al., Reference Lisdahl, Sher, Conway, Gonzalez, Feldstein Ewing, Nixon, Tapert, Bartsch, Goldstein and Heitzeg2018), culture, family, environment (Zucker et al., Reference Zucker, Gonzalez, Feldstein Ewing, Paulus, Arroyo, Fuligni, Morris, Sanchez and Wills2018), and cognitive assessments (Luciana et al., Reference Luciana, Bjork, Nagel, Barch, Gonzalez, Nixon and Banich2018) along with bioassays (drug toxicology, genetics, pubertal hormones; (Herting et al., Reference Herting, Uban, Gonzalez, Baker, Kan, Thompson, Granger, Albaugh, Anokhin, Bagot, Banich, Barch, Baskin-Sommers, Breslin, Casey, Chaarani, Chang, Clark, Cloak and Sowell2021; Iacono et al., Reference Iacono, Heath, Hewitt, Neale, Banich, Luciana, Madden, Barch and Bjork2018; Uban et al., Reference Uban, Horton, Jacobus, Heyser, Thompson, Tapert, Madden and Sowell2018) that are consistently and reliably harmonized across all sites. The eCB Substudy included 8 study sites that followed the larger study procedures but also collected the eCB Questionnaire (eCBq) and small blood sample (for eCB analysis). All data collection, blood processing, storage, and shipping methods were harmonized across 8 study sites and monitored by UWM (KL). Youth were compensated with a $10 gift card for participating in the eCB Substudy.
Measures
Demographic factors
Age at time of assessment and sex assigned at birth were measured in REDCap as part of the ABCD Study demographic survey (see Barch et al., Reference Barch, Albaugh, Avenevoli, Chang, Clark, Glantz, Hudziak, Jernigan, Tapert, Yurgelun-Todd, Alia-Klein, Potter, Paulus, Prouty, Zucker and Sher2018).
eCB Questionnaire (eCBq)
The eCBq (Lisdahl, Reference Lisdahl, Sher, Conway, Gonzalez, Feldstein Ewing, Nixon, Tapert, Bartsch, Goldstein and Heitzeg2018) was designed in REDCap to measure state-based factors that have been shown to impact circulating eCB and related lipid concentrations in adults and includes time of day the sample was collected, minutes since last food or non-water drinks and aerobic activity, last night’s sleep duration, and current pain and stress levels on a 1–10 visual analog scale (Blüher et al., Reference Blüher, Engeli, Klöting, Berndt, Fasshauer, Bátkai, Pacher, Schön, Jordan and Stumvoll2006; Cedernaes et al., Reference Cedernaes, Fanelli, Fazzini, Pagotto, Broman, Vogel, Dickson, Schiöth and Benedict2016; Engeli et al., Reference Engeli, Böhnke, Feldpausch, Gorzelniak, Janke, Bátkai, Pacher, Harvey-White, Luft, Sharma and Jordan2005; Gatta-Cherifi et al., Reference Gatta-Cherifi, Matias, Vallée, Tabarin, Marsicano, Piazza and Cota2012; Hanlon et al., Reference Hanlon, Tasali, Leproult, Stuhr, Doncheck, de Wit, Hillard and Van Cauter2015, Reference Hanlon, Tasali, Leproult, Stuhr, Doncheck, de Wit, Hillard and Van Cauter2016; Heyman et al., Reference Heyman, Gamelin, Goekint, Piscitelli, Roelands, Leclair, Di Marzo and Meeusen2012; Hill et al., Reference Hill, Bierer, Makotkine, Golier, Galea, McEwen, Hillard and Yehuda2013; Hillard, Reference Hillard2018; Koltyn et al., Reference Koltyn, Brellenthin, Cook, Sehgal and Hillard2014; Monteleone et al., Reference Monteleone, Di Marzo, Aveta, Piscitelli, Dalle Grave, Scognamiglio, El Ghoch, Calugi, Monteleone and Maj2015; Monteleone et al., Reference Monteleone, Piscitelli, Scognamiglio, Monteleone, Canestrelli, Di Marzo and Maj2012). The eCBq is administered immediately before the blood draw.
Blood collection & eCB quantification
A 3 ml blood sample was taken from youth using venipuncture. Serum was separated by centrifugation between 30 and 60 minutes after collection. Samples were then stored at −20°C and shipped to Dr Hillard’s lab on dry ice monthly and then stored at −80°C. Concentrations of AEA, OEA, PEA, 2-AG, and 2-OG were quantified in lipids extracted from 0.4 ml of serum using isotope-dilution using mass spectrometry following the methods described in Spagnolo et al. (Reference Spagnolo, Ramchandani, Schwandt, Kwako, George, Mayo, Hillard and Heilig2016). Specifically, deuterated standards (150 pg/µl AEA and 1,800 pg/µl 2-AG) were added, and solid phase extraction columns are used to separate lipids. The liquid chromatography: mass spectrometry (LC/MS/MS) analysis was conducted using an Agilent Technologies 6,460 Triple Quad LC/MS with a Chromasil, 5 µ C18 column with dimensions of 250 × 200 mm. 2-AG, AEA, OEA, PEA, and 2-OG amounts were determined using isotope dilution by creating standard curves constructed from a set of 10 combos, each containing different analyte concentrations together with deuterated AEA and 2-AG at the same concentrations in the samples. Concentration ratios in the samples were calculated from area ratios using the slopes determined from the standard curves and converted to concentrations using the amount of deuterated standard added and the original sample volume.
Structural neuroimaging
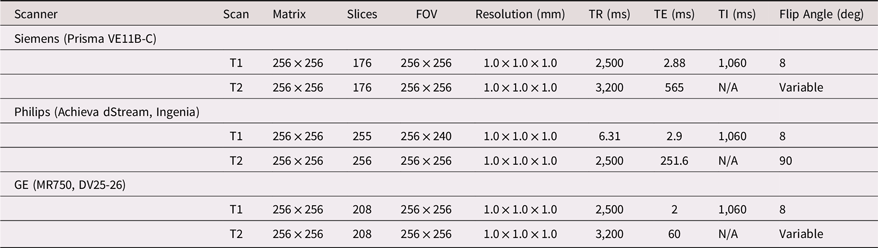
As a part of the main ABCD Study, participants underwent MRI. The MRI session included a 3D T1-weighted magnetization-prepared rapid acquisition gradient echo scan and a T2-weighted fast spin echo with variable flip angle scan (both 1 mm isotropic). The MRI protocol uses three 3T scanning platforms and protocols optimized for harmonization outlined in Table 1. Both T1 and T2 images were nonlinearly transformed to correct for scanner-specific gradient nonlinearity and corrected for intensity inhomogeneity using smoothly varying, estimated B1-bias fields using a novel implementation detailed in Hagler et al. (Reference Hagler, Hatton, Cornejo, Makowski, Fair, Dick, Sutherland, Casey, Barch, Harms, Watts, Bjork, Garavan, Hilmer, Pung, Sicat, Kuperman, Bartsch, Xue and Dale2019). Scans were manually inspected for various imaging artifacts and flagged for exclusion from subsequent preprocessing and analyses (Hagler et al., Reference Hagler, Hatton, Cornejo, Makowski, Fair, Dick, Sutherland, Casey, Barch, Harms, Watts, Bjork, Garavan, Hilmer, Pung, Sicat, Kuperman, Bartsch, Xue and Dale2019). Structural scans were further processed using the Multi-Modal Processing Stream software (toolbox utilizing MATLAB, FreeSurfer (Fischl, Reference Fischl2012), AFNI (Cox, Reference Cox1996), and FMRIB Software Library (Smith et al., Reference Smith, Jenkinson, Woolrich, Beckmann, Behrens, Johansen-Berg, Bannister, De Luca, Drobnjak, Flitney, Niazy, Saunders, Vickers, Zhang, De Stefano, Brady and Matthews2004). Volume, thickness (Fischl & Dale, Reference Fischl and Dale2000), and surface area (Chen et al., Reference Chen, Gutierrez, Thompson, Panizzon, Jernigan, Eyler, Fennema-Notestine, Jak, Neale, Franz, Lyons, Grant, Fischl, Seidman, Tsuang, Kremen and Dale2012) were quantified at the level of each parcel within the Desikan–Killiany cortical atlas (Desikan et al., Reference Desikan, Ségonne, Fischl, Quinn, Dickerson, Blacker, Buckner, Dale, Maguire, Hyman, Albert and Killiany2006). Subcortical volume was quantified within regions defined using the anatomical segmentation output from an automated anatomical labeling algorithm (Fischl et al., Reference Fischl, Salat, Busa, Albert, Dieterich, Haselgrove, van der Kouwe, Killiany, Kennedy, Klaveness, Montillo, Makris, Rosen and Dale2002).
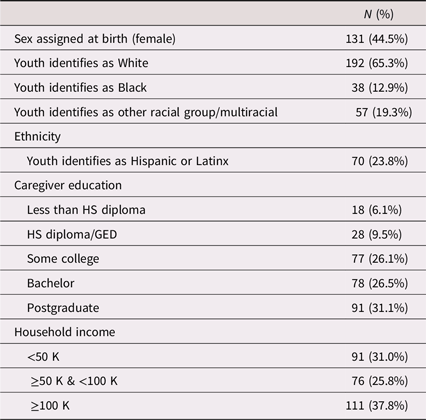
Demographics for the participants used in the current analysis
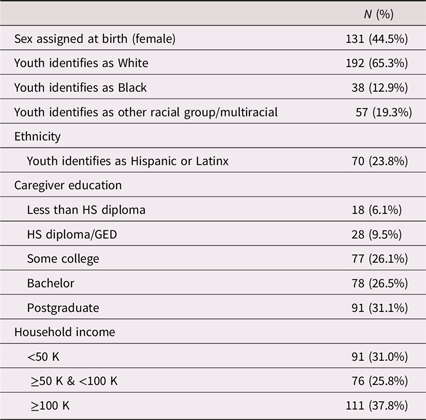
Table 1. Long description
A table showing demographic data of participants in a study. The table has 11 rows and 2 columns. The columns are labeled N (%) and include various demographic categories. Row 1: Sex assigned at birth (female), 131 (44.5 percent). Row 2: Youth identifies as White, 192 (65.3 percent). Row 3: Youth identifies as Black, 38 (12.9 percent). Row 4: Youth identifies as Asian American, 3 (1 percent). Row 5: Youth identifies as other racial group/multiracial, 54 (18.4 percent). Row 6: Youth identifies as Hispanic or Latinx, 70 (23.8 percent). Row 7: Caregiver education Less than HS diploma, 18 (6.1 percent). Row 8: Caregiver education HS diploma/GED, 28 (9.5 percent). Row 9: Caregiver education Some college, 77 (26.1 percent). Row 10: Caregiver education Bachelor, 78 (26.5 percent). Row 11: Caregiver education Postgraduate, 91 (31.1 percent). Row 12: Household income <50 K, 91 (31 percent). Row 13: Household income >=50 K & <100 K, 76 (25.8 percent). Row 14: Household income >=100 K, 111 (37.8 percent).
Analysis
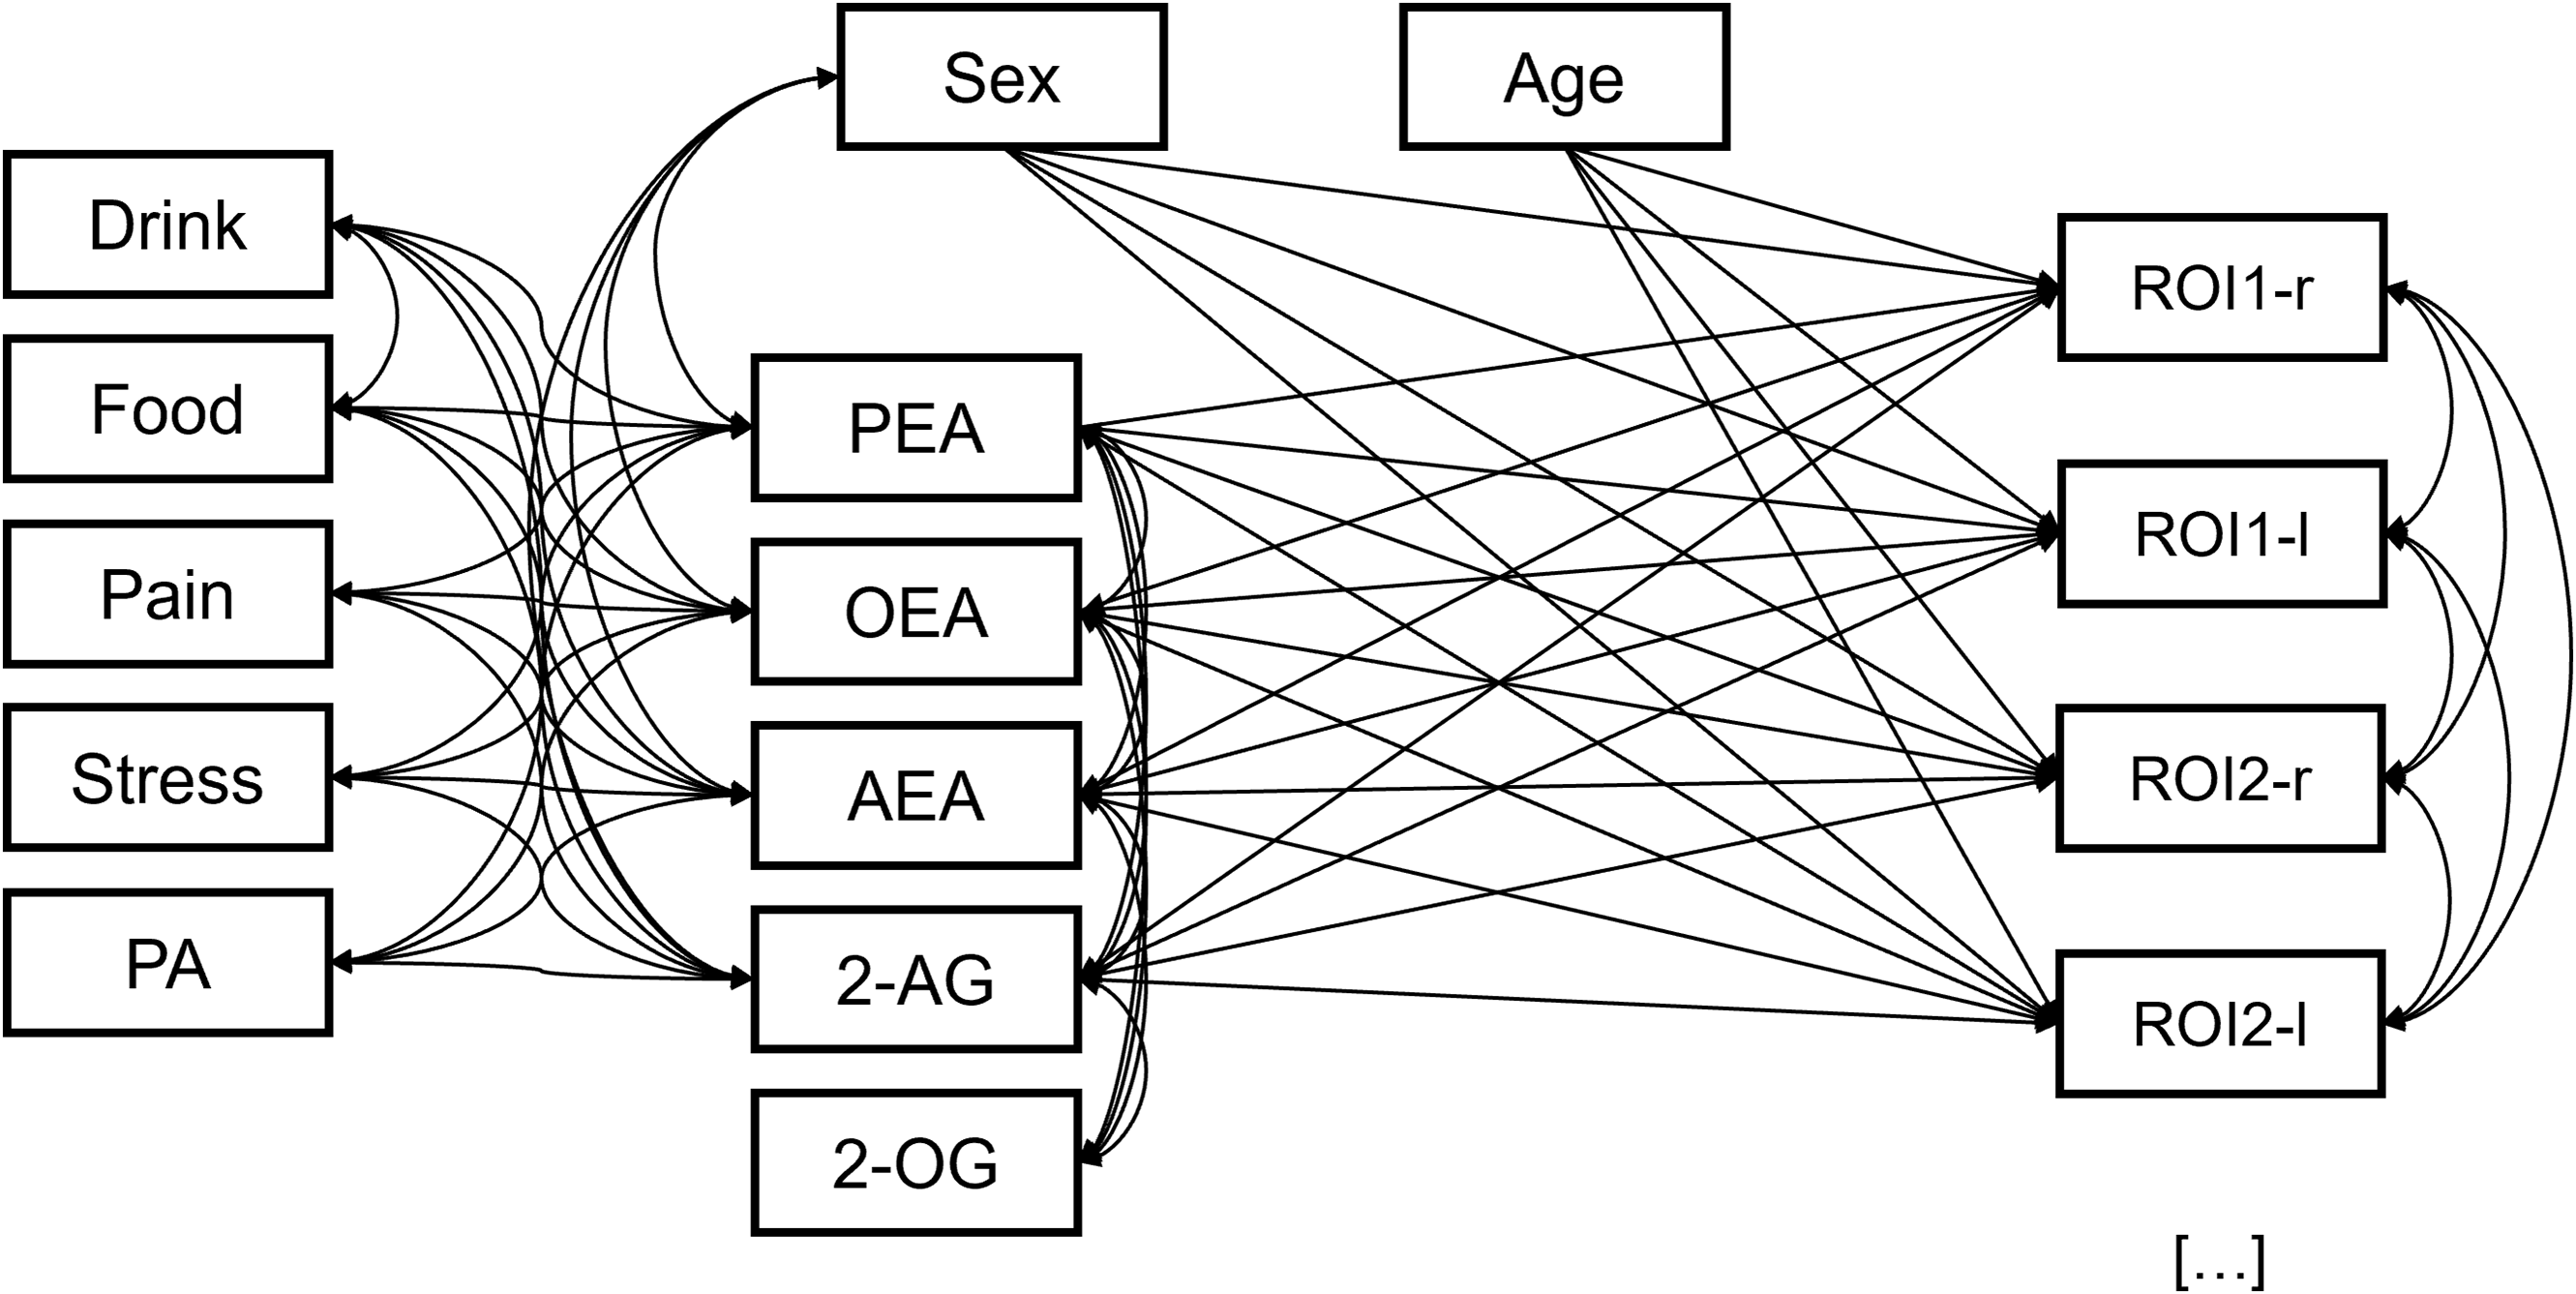
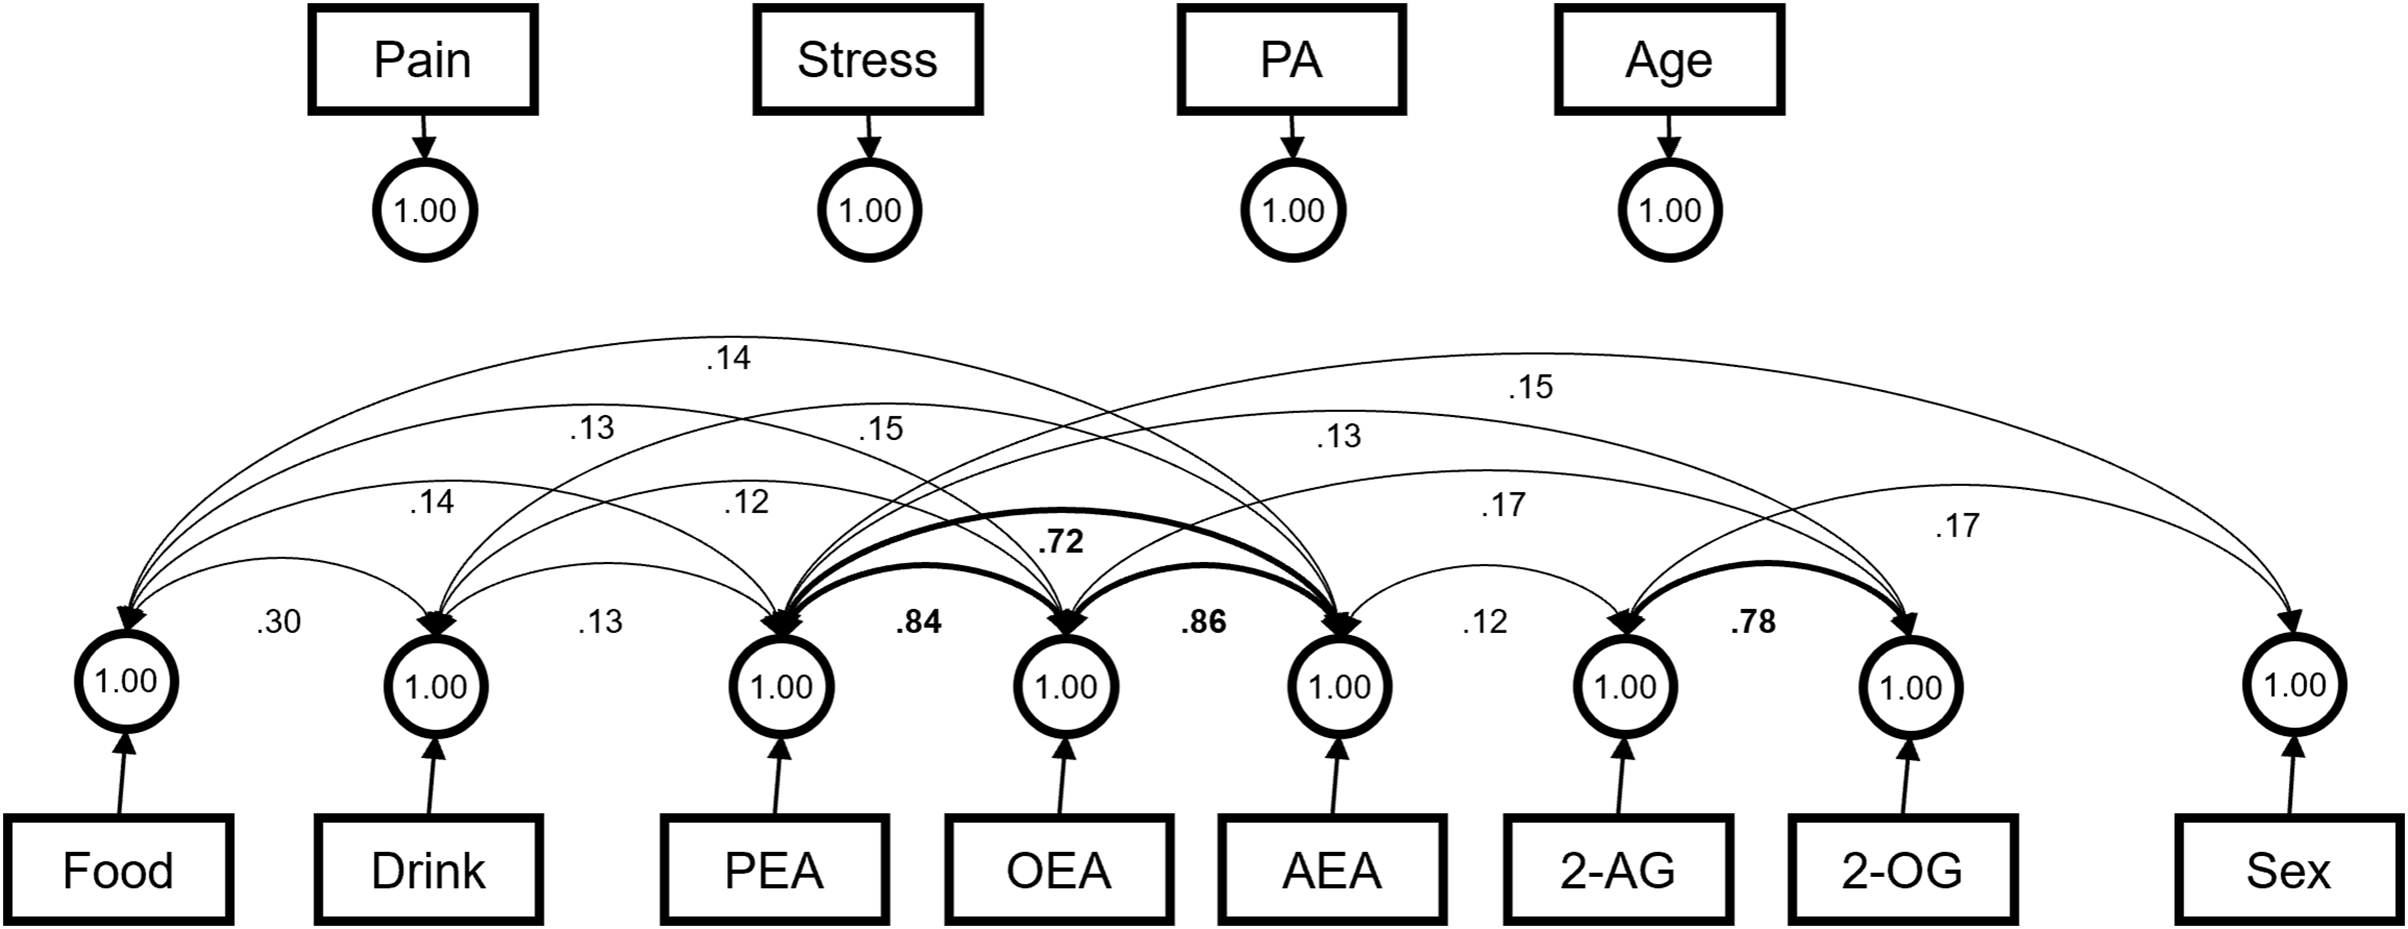
Analyses were conducted in R (v4.3.2) utilizing published ABCD Data Release 5.1 (https://data-archive.nimh.nih.gov/abcd; DOI: 10.15154/z563-zd24). First, we computed descriptive statistics for variables (data were examined for non-normality and outliers prior to analysis). The primary analysis utilized a SEM approach to model the associations between circulating lipid concentrations and brain structure outcomes while accounting for the covariance between circulating lipid concentrations and known covariates of (eCBq items) and brain structure, while also minimizing the total number of SEM models to 3. All lipid concentrations were log-transformed prior to standardization to account for the right skew in these data. Due to the number of outcomes in each model (n = 93 for volume, 68 for all others), volume, thickness, and surface area were investigated with separate models. In all models, sex-at-birth, age, AEA, OEA, PEA, and 2-AG concentrations were all included as exogenous variables, with values for all brain regions simultaneously regressed on these variables. All quantified lipids (including 2-OG, which was not included as an exogenous variable) were allowed to freely covary. 2-OG was included as a covariate due to its shared metabolic pathway with 2-AG but excluded as an exogenous variable because there is insufficient evidence for a direct role in brain maturation (Syed et al., Reference Syed, Bui, Beavers, Farb, Ficorilli, Chesterfield, Kuo, Bokvist, Barrett and Efanov2012). Additionally, AEA, OEA, PEA, and 2-AG were allowed to freely covary with sex assigned at birth, self-reported pain, stress, a binary variable indicating whether the participants engaged in rigorous physical activity in the past 4 hours, and time in hours between last food or non-water drink consumption (see Figure 1). Covariance between all endogenous variables (brain regions) and between last food or non-water drink consumption were also freely estimated. Attempts to reduce the degrees of freedom of the models using latent variables to represent the classes of lipids and gross brain regions all failed to converge. Age was not included as a covariate due to the relative age restriction and the potential for this covariance to suppress associations between lipids and indices of structural maturation. Due to the complexity of the models, we were unable to examine sex moderation of the eCB concentrations and sMRI outcomes; though sex was controlled for in the analyses (see limitations). Including sex as a moderator resulted in failure for the models to converge; therefore, for descriptive reasons and to assist with model generalization across sexes, sex-stratified models evaluating brain regions indicated in the main analyses were conducted and are included in the supplemental material. False discovery rate (FDR) using Benjamini–Hochbert approach was conducted so both uncorrected and corrected individual path loadings between could be reported. Due to low power to detect small effect sizes (the norm in brain imaging research, Dick et al., Reference Dick, Lopez, Watts, Heeringa, Reuter, Bartsch, Fan, Kennedy, Palmer, Marshall, Haist, Hawes, Nichols, Barch, Jernigan, Garavan, Grant, Pariyadath, Hoffman and Thompson2021), overall interpretation of individual paths was kept at p < .05, though FDR-corrected values (highest ranked p-value threshold p = .0005) are reported, as these represent larger effects that are most likely to replicate.
The structural model schema shown above was used for all three analyses (volume, cortical thickness, and cortical surface area). For cortical thickness and surface area, all ROIs in the Desikan–Killiany atlas were used, resulting in 68 outcomes in each model. The volumetric analysis included subcortical structures, adding an additional 25 outcomes to the model. Drink = time in hours since last non-water drink; food = time in hours since last food consumption; pain = pain levels on a 1–10 scale; stress = stress levels on a 1–10 scale; PA = physical activity; 2-AG = 2-arachidonoylglycerol; AEA = N-arachidonoylethanolamine; OEA = oleoylethanolamide; PEA = palmitoylethanolamide.
Results
Descriptive statistics
The sample includes 294 youth (age range 10–14, mean = 12.04, SD = 1.04; 131 female; 154 white, 37 black, 70 Hispanic/Latino, <5 Asian, 30 other). For detailed sample characteristics (race/ethnicity, highest parental/guardian education, parental/guardian marital status, and parental/guardian combined household income) see Table 2.
Structural MRI scanning parameters
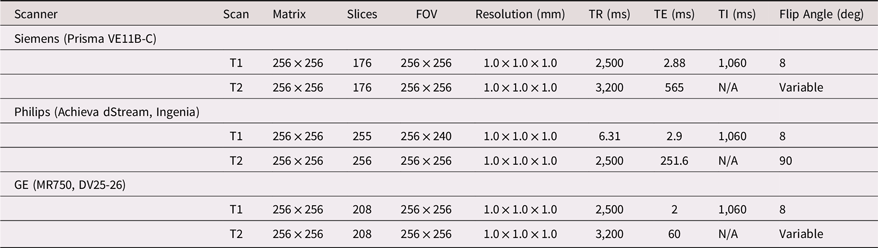
Table 2. Long description
A table comparing MRI scanning parameters across different scanners and scan types. The table has 3 columns and 7 rows. Column headers are Scanner, Scan, Matrix, Slices, FOV, Resolution (mm), TR (ms), TE (ms), T1 (ms), and Flip Angle (deg). Row 1: Scanner, Siemens (Prisma VE11B-C). Row 2: Scan, T1; Matrix, 256 x 256; Slices, 176; FOV, 256 x 256; Resolution (mm), 1.0 x 1.0 x 1.0; TR (ms), 2,500; TE (ms), 2.88; T1 (ms), 1,060; Flip Angle (deg), 8. Row 3: Scan, T2; Matrix, 256 x 256; Slices, 176; FOV, 256 x 256; Resolution (mm), 1.0 x 1.0 x 1.0; TR (ms), 3,200; TE (ms), 565; T1 (ms), N/A; Flip Angle (deg), Variable. Row 4: Scanner, Philips (Achieva dStream, Ingenia). Row 5: Scan, T1; Matrix, 256 x 256; Slices, 255; FOV, 256 x 240; Resolution (mm), 1.0 x 1.0 x 1.0; TR (ms), 6.31; TE (ms), 2.9; T1 (ms), 1,060; Flip Angle (deg), 8. Row 6: Scan, T2; Matrix, 256 x 256; Slices, 256; FOV, 256 x 256; Resolution (mm), 1.0 x 1.0 x 1.0; TR (ms), 2,500; TE (ms), 251.6; T1 (ms), N/A; Flip Angle (deg), 90. Row 7: Scanner, GE (MR750, DV25-26). Row 8: Scan, T1; Matrix, 256 x 256; Slices, 208; FOV, 256 x 256; Resolution (mm), 1.0 x 1.0 x 1.0; TR (ms), 2,500; TE (ms), 2; T1 (ms), 1,060; Flip Angle (deg), 8. Row 9: Scan, T2; Matrix, 256 x 256; Slices, 208; FOV, 256 x 256; Resolution (mm), 1.0 x 1.0 x 1.0; TR (ms), 3,200; TE (ms), 60; T1 (ms), N/A; Flip Angle (deg), Variable.
eCB/lipid concentrations & covariates
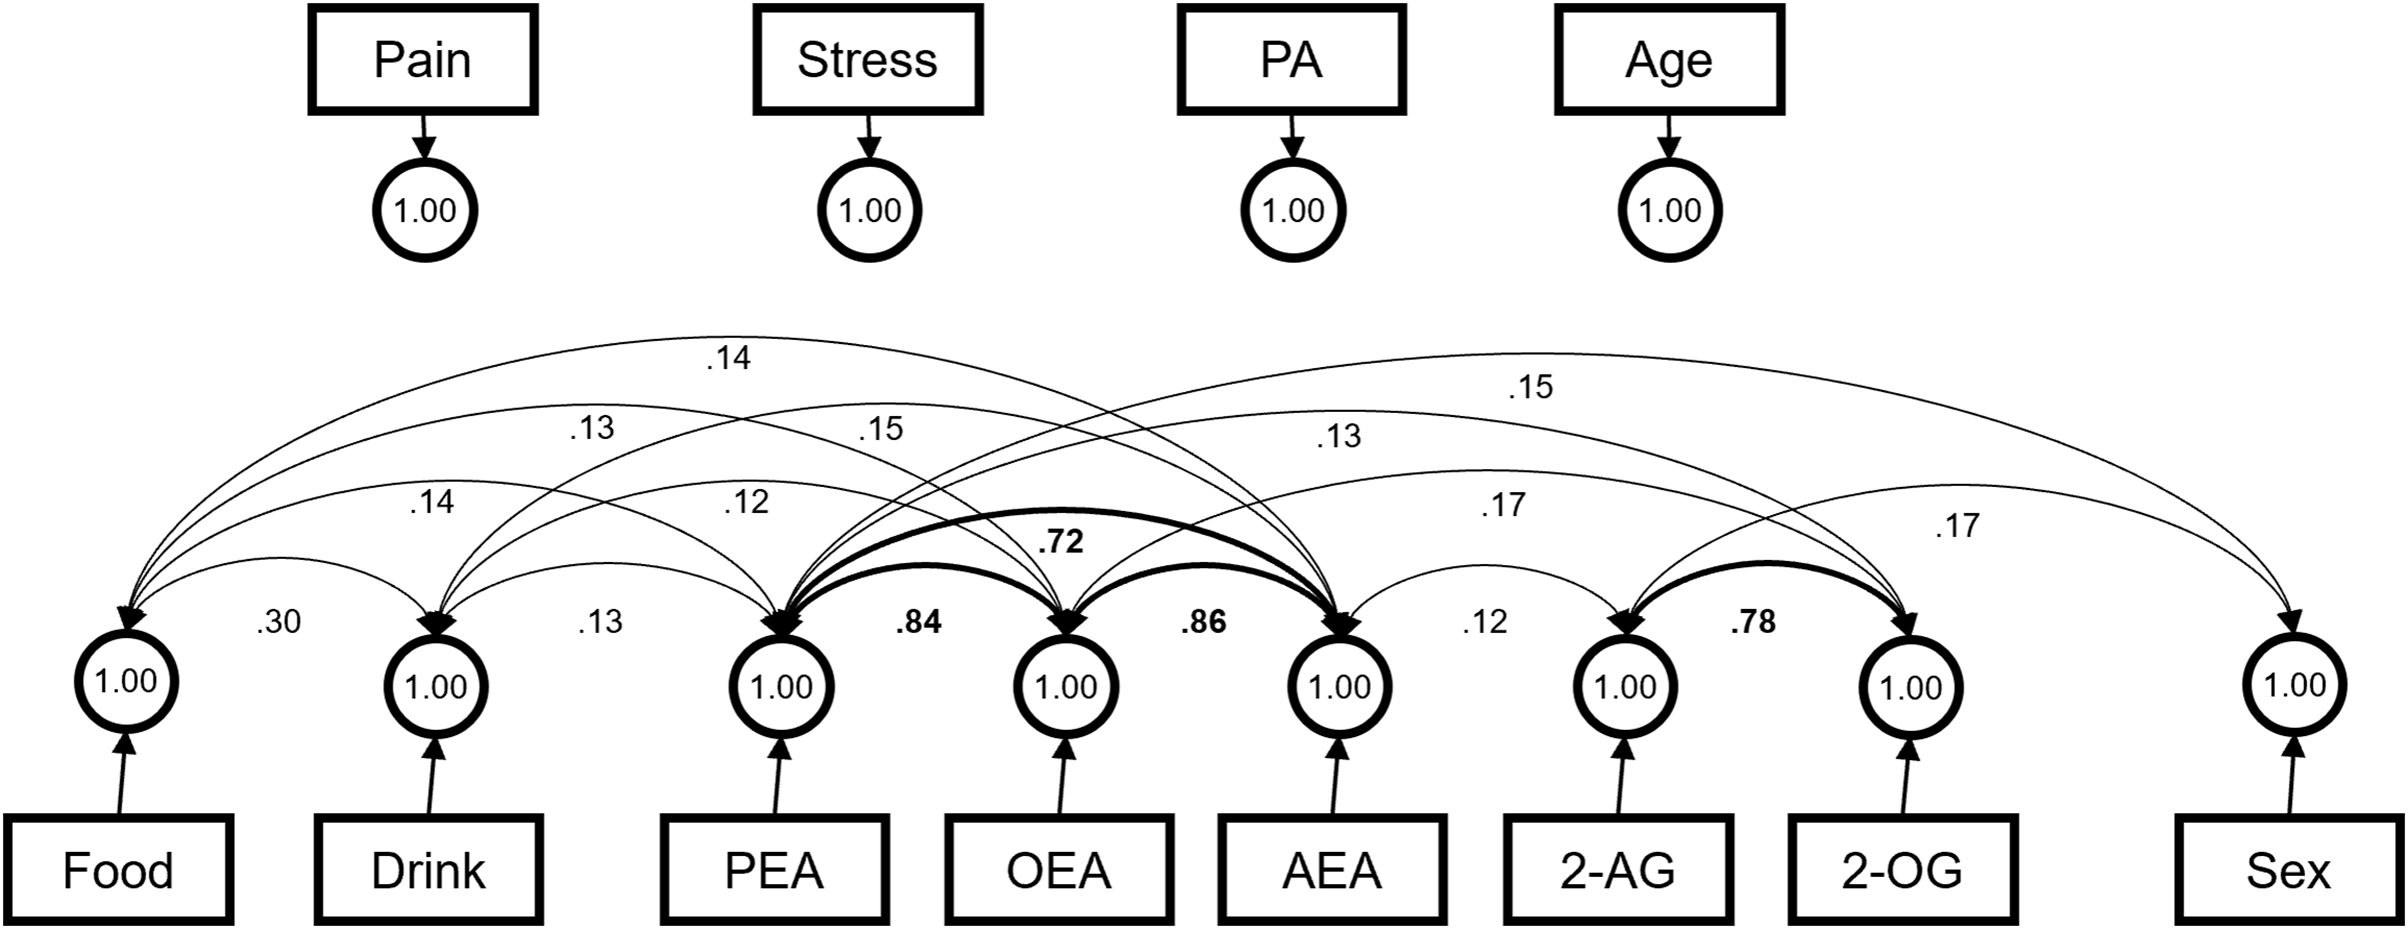
Mean and SD values for eCB/lipid concentrations and sex drstributions across sights are available in Supplemental Table 1. Mean, SD, and ranges for the eCBq variables are in the Supplemental Table 2. The covariance structure of all exogenous variables was shared across all three models and can be seen in Figure 2. The models indicated a significant covariance between time since last food and time since last drink (β = 0.30, p < .001). Small but significant covariances were indicated between both time since last food and time since last drink and all NAEs (β’s < 0.16, p’s < .05). There was a strong observed covariance among lipids within the same structural class; AEA, PEA, and OEA were all closely related (β’s > 0.70, p’s < .05) and 2-AG covaried highly with 2-OG (β = 0.78). Small covariances were observed between AEA and 2-AG (β = 0.12, p = .008) and between 2-OG and both PEA (β = 0.13, p = .03) and OEA (β = 0.17, p = .002). Being male was associated with higher concentrations of PEA (β = 0.13, p = .02).
The estimated covariance structure between exogenous variables in all structural models. Covariance loadings involving sex are partially standardized, and all other loadings are fully standardized.
eCB/lipid concentrations & sMRI outcomes
Relative fit indices for all four models linking eCB/lipid concentrations with volume, cortical surface area, and cortical thickness outcomes indicated that the models fit the data reasonably well (Table 3; CFI’s > 0.98, TLI’s > 0.9, RMSEA < 0.05, and SRMR < 0.03). Fit indices for sex-stratified models can be found in Supplemental Table 3. Visual references for the parcels used can be found in Supplemental Figures 1 and 2.
Relative and absolute model fit indices

Table 3. Long description
A table comparing model fit indices for volume, cortical thickness, and cortical surface area. The table has three rows and six columns. Column headers are Chi-squared (df), p, CFI, TLI, RMSEA (95% CI), and SRMR. Row labels are Volume, Cortical thickness, and Cortical surface area. Row 1: Chi-squared (df), 826.43 (589); p, <.001; CFI, 0.99; TLI, 0.91; RMSEA (95% CI), 0.04 [0.03, 0.04]; SRMR, 0.02. Row 2: Chi-squared (df), 495.09 (433); p, .001; CFI, 0.99; TLI, 0.97; RMSEA (95% CI), 0.02 [0.01, 0.03]; SRMR, 0.02. Row 3: Chi-squared (df), 578.34 (439); p, <.001; CFI, 0.99; TLI, 0.95; RMSEA (95% CI), 0.03 [0.025, 0.04]; SRMR, 0.02.
Volume
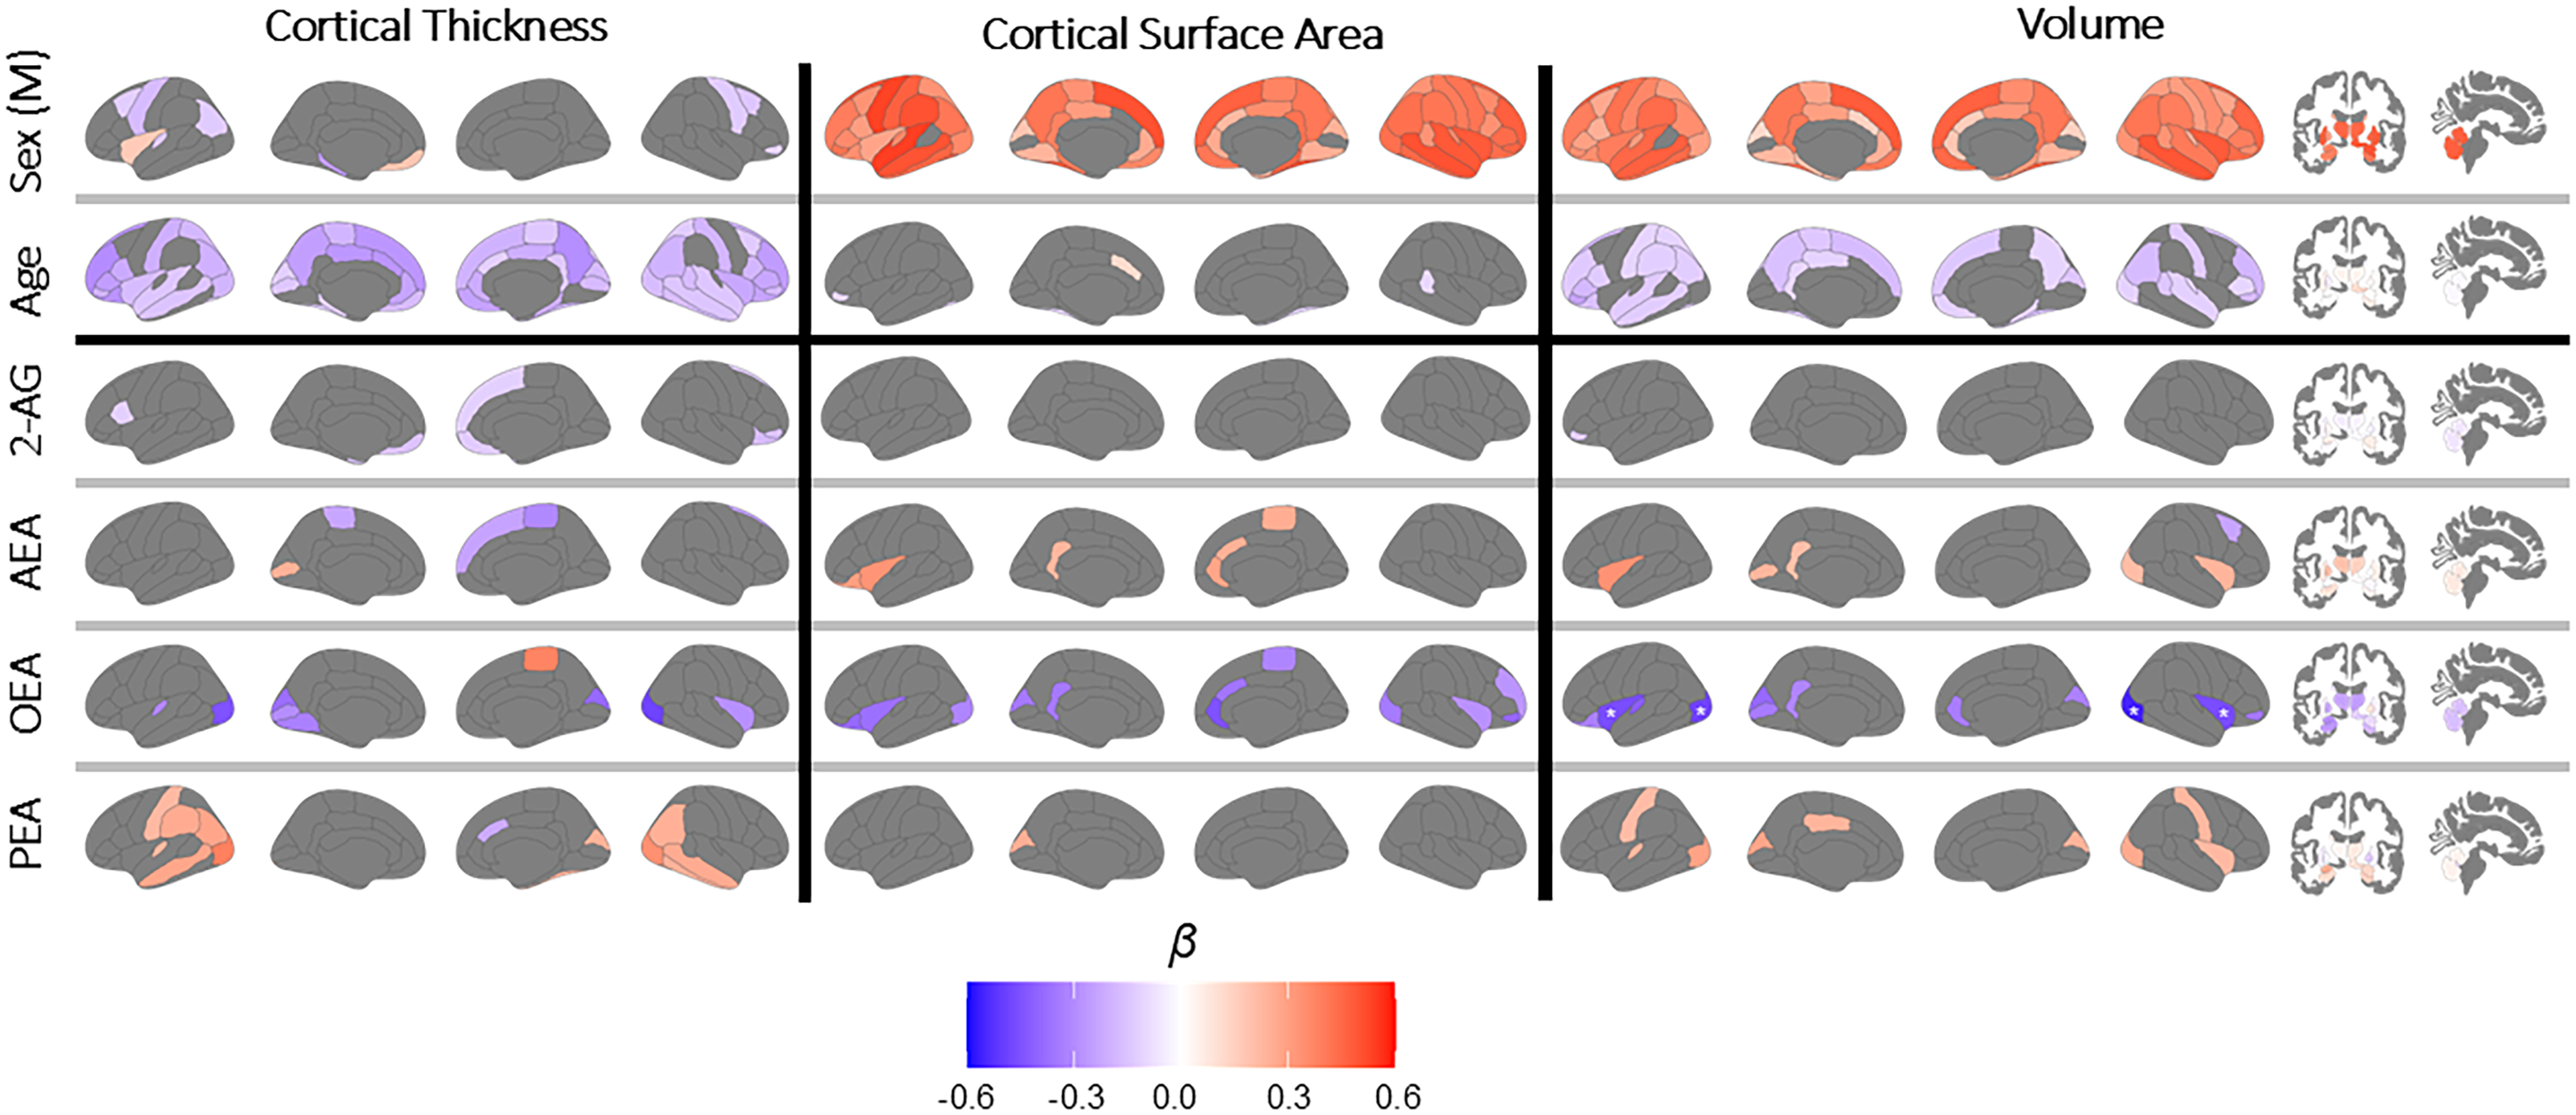
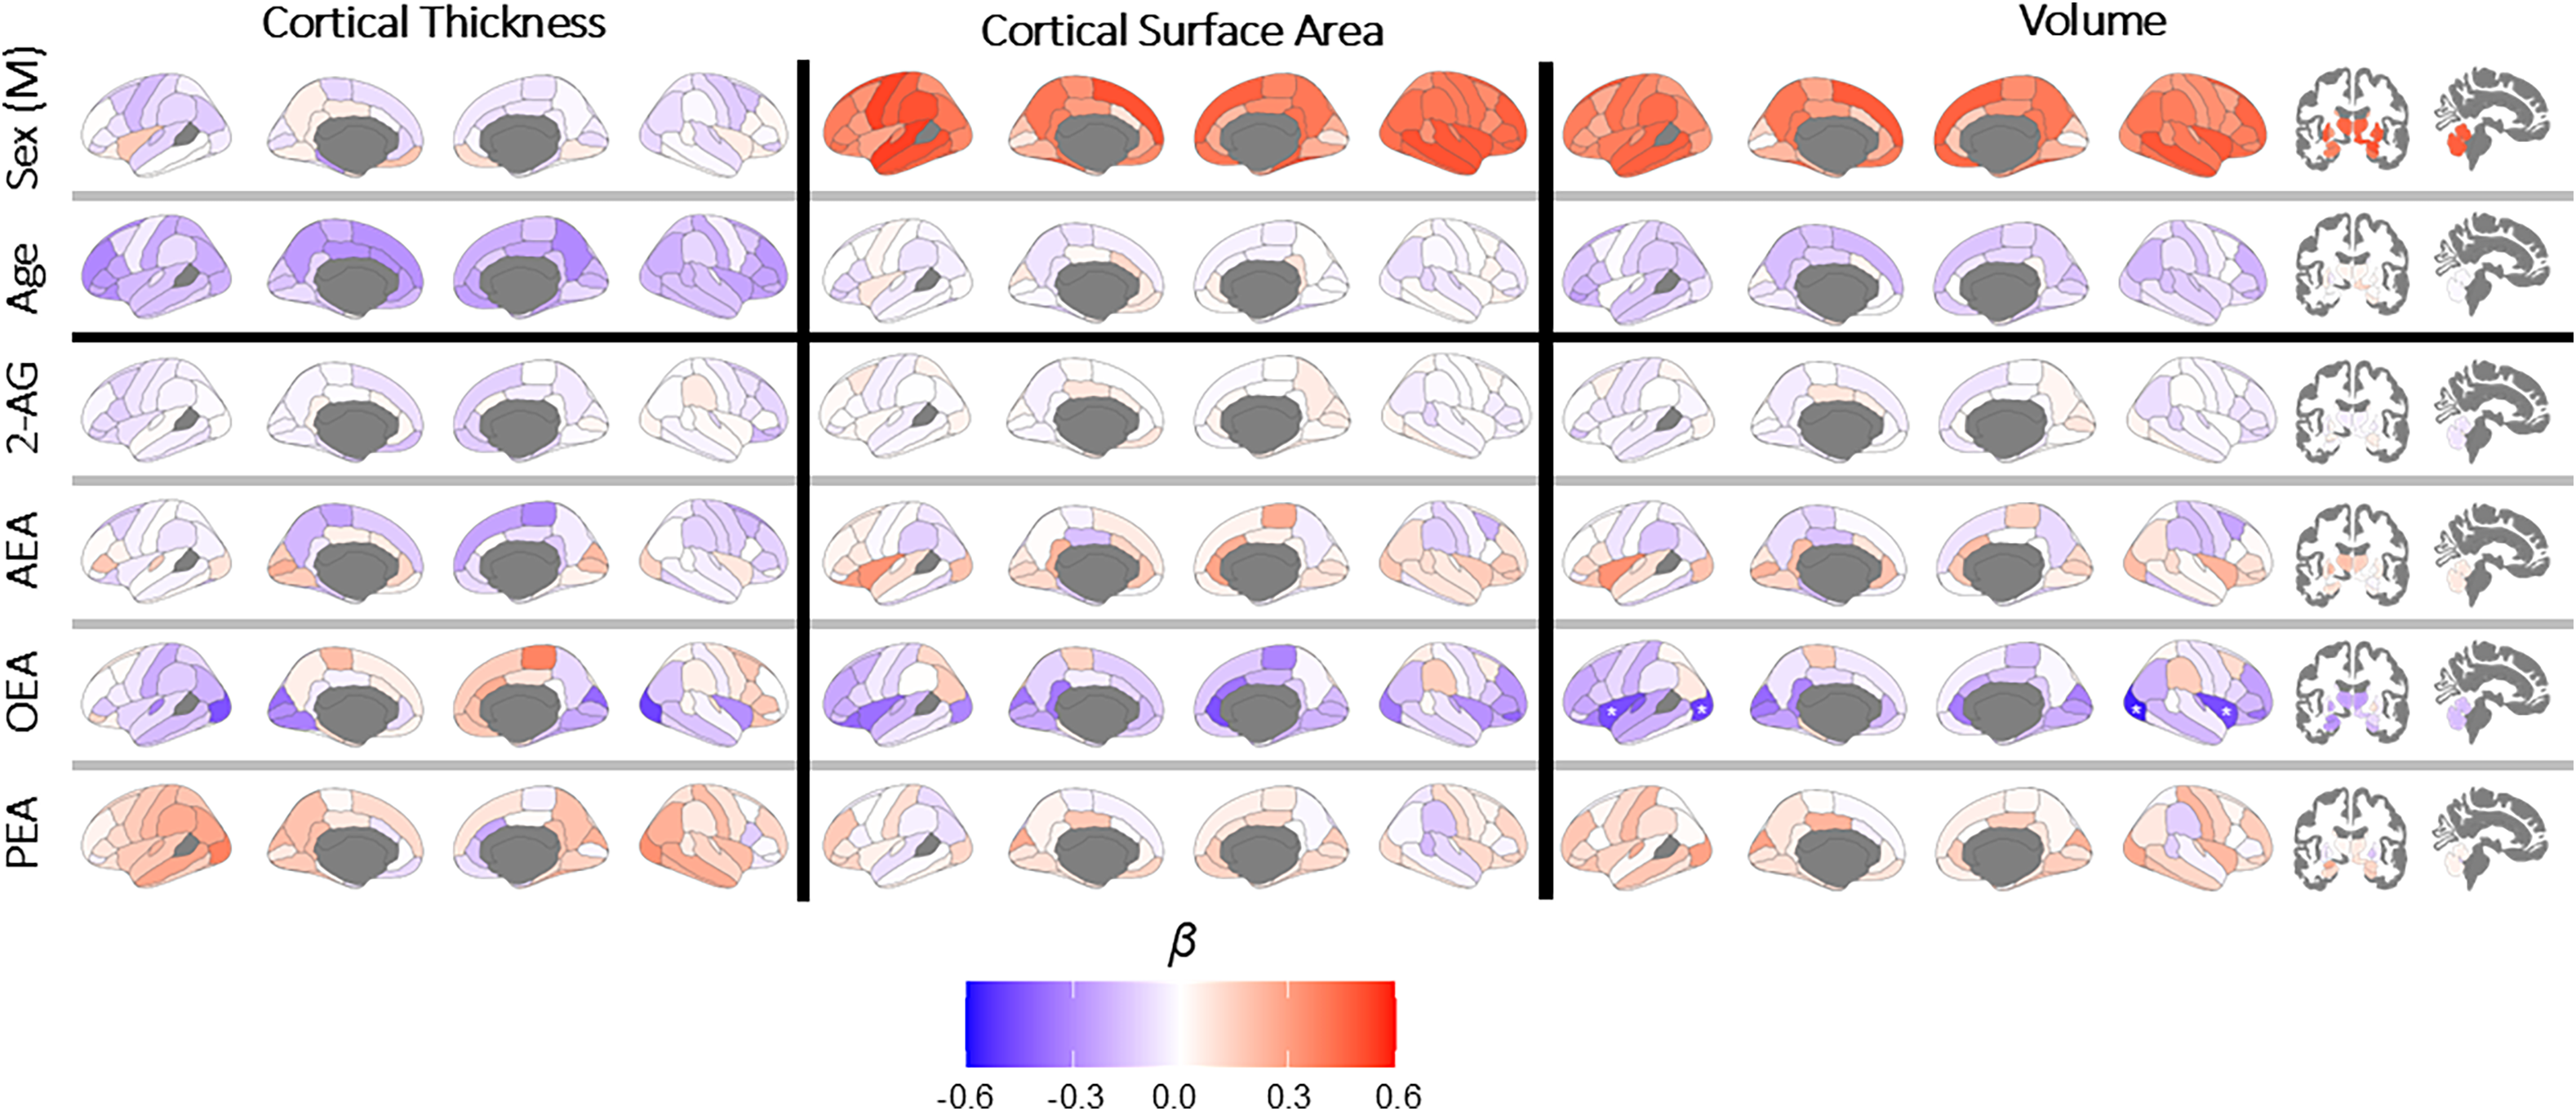
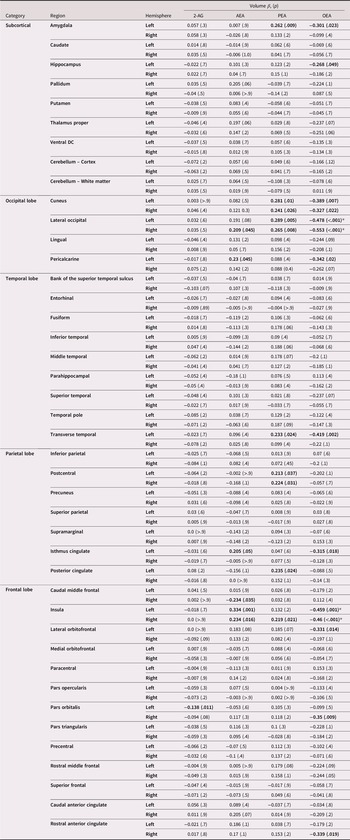
Fully standardized loadings between eCB/lipid concentrations and volumes in all ROIs are displayed in Table 4 and visualized in Figure 3 (thresholded findings) and Figure 4 (full gradient of loadings). 2-AG. Greater circulating 2-AG concentrations were linked with smaller left pars-orbitalis volume (β = −0.14, p = .01), but no relationships were observed with the right pars-orbitalis (β = −0.09, p = .08). No other associations between serum 2-AG and brain volumes were supported by the model. AEA. Greater AEA concentrations were linked with smaller right caudal-middle region of the frontal lobe (β = −0.23, p = .03) and larger volumes in the left pericalcarine cortex (β = 0.23, p = .05), the right lateral occipital cortex (β = 0.21, p = .04), the bilateral insula (left: β = 0.33, p = .001; right: β = 0.23, p = .02), and the left isthmus of the cingulate (β = 0.20, p = .05). PEA. Greater PEA concentrations were associated with larger volumes in the left amygdala (β = 0.26, p = .009), left transverse temporal (β = 0.23, p = .02), bilateral cuneus (left: β = 0.28, p = .01; right: β = 0.24, p = .03), lateral occipital cortex (left: β = 0.29, p = .005; right: β = 0.27, p = .008), postcentral portion of the parietal cortex (left: β = 0.21, p = .04; right: β = 0.22, p = .03), posterior cingulate (β = 0.23, p = .02), and left insula (β = 0.22, p = .02). OEA. Increased OEA was significantly linked with smaller brain volumes in the left hippocampus (β = −0.27, p = .05), left amygdala (β = −0.30, p = .02), bilateral cuneus (left: β = −0.39, p = .007; right: β = −0.33, p = .02), bilateral occipital region (left: β = −0.48, p < .001; right: β = −0.55, p < .001), left pericalcarine (β = −0.34, p = .02), left transverse temporal (β = −0.42, p = .002), left isthmus of the cingulate (β = −0.32, p = .02), bilateral insula (left: β = −0.46, p < .001; right: β = −0.46, p < .001), left lateral orbitofrontal (β = −0.33, p = .01), right pars orbitalis (β = −0.35, p = .009), and right rostral anterior cingulate (β = −0.34, p = .02). Only the associations between OEA and bilateral insula and lateral occipital regions remained significant after Benjamini–Hochberg correction for FDR.
Brain structure associations significantly associated with circulating eCBs at the level of p < .05. Associations which remained significant after corrections for false discovery are denoted with a white asterisk. 2-AG = 2-arachidonoylglycerol; AEA = N-arachidonoylethanolamine; OEA = oleoylethanolamide; PEA = palmitoylethanolamide.
Brain structure associations associated with circulating eCBs (unthresholded). Associations which remained significant after corrections for false discovery are denoted with a white asterisk.
Endocannabinoid loadings on brain volume. Values significant at an alpha threshold of 0.05 are bolded. Asterisks indicate values that remained significant after Benjamini–Hochberg FDR correction (n = 372)
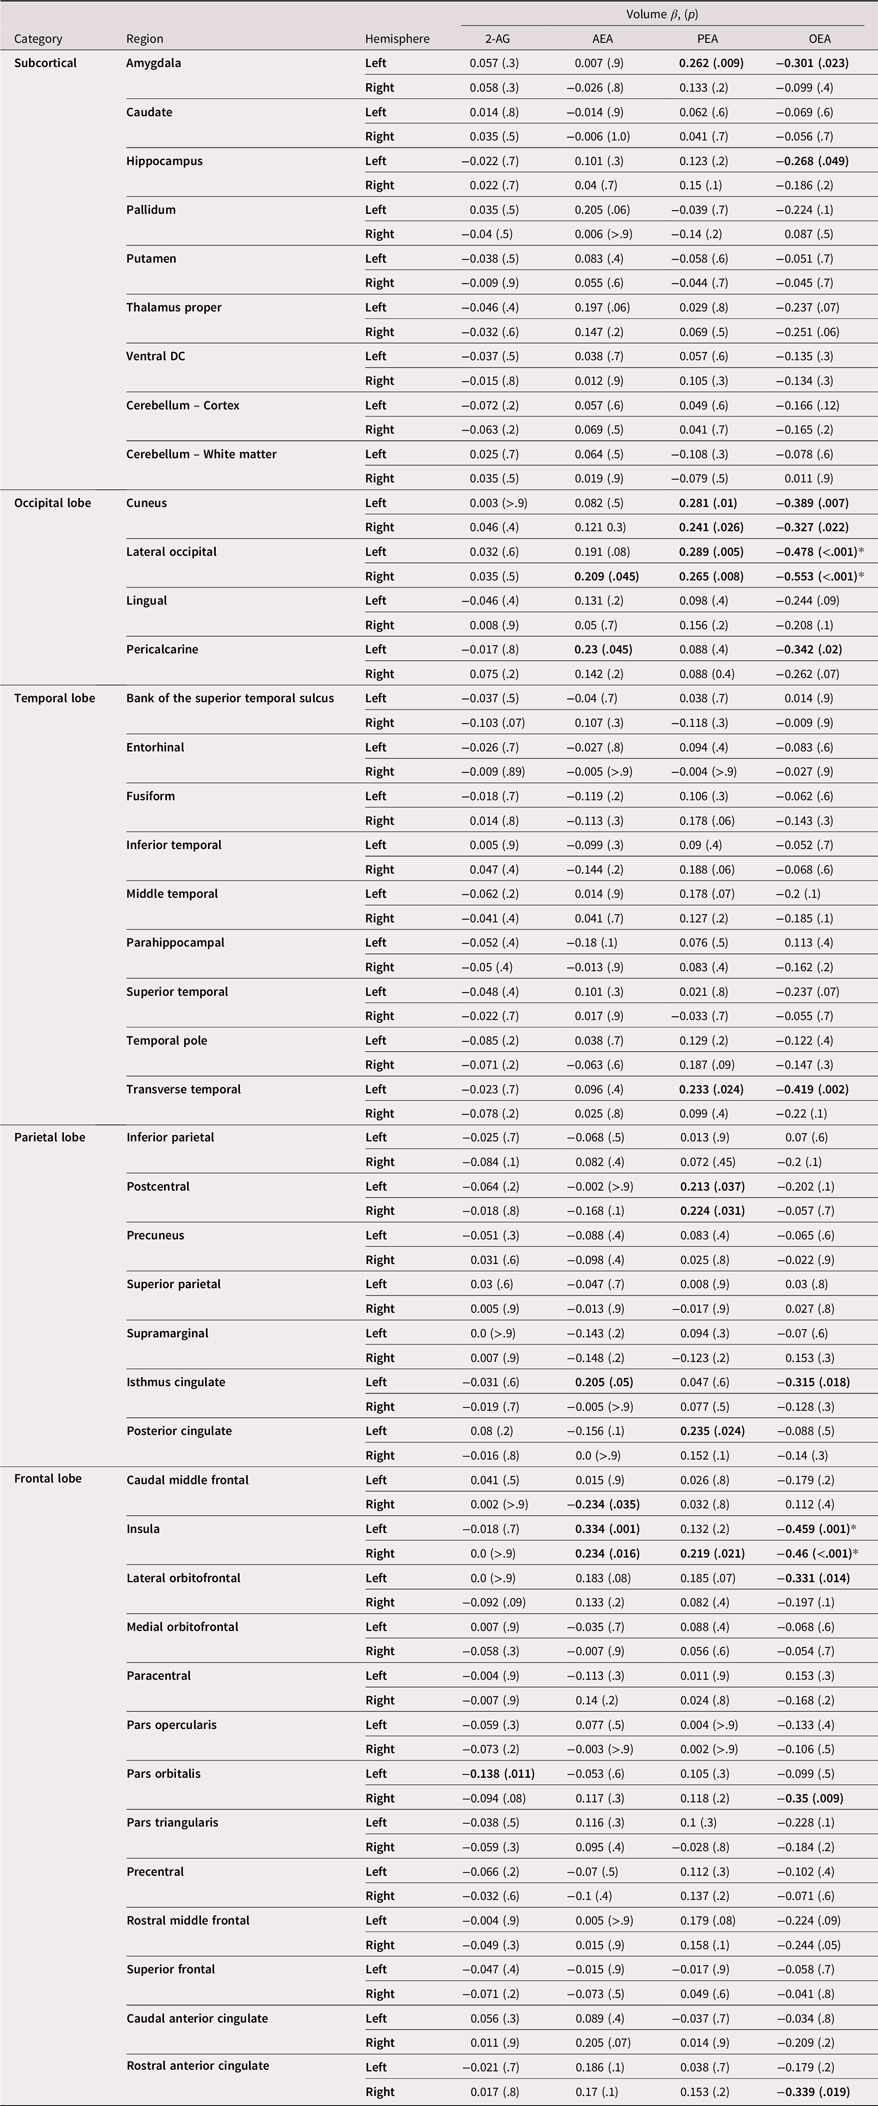
Table 4. Long description
Loadings for sex-stratified models are available in Supplemental Tables 4 and 5; in general, findings were consistent across sexes with minor differences likely due to differential power.
Cortical surface area
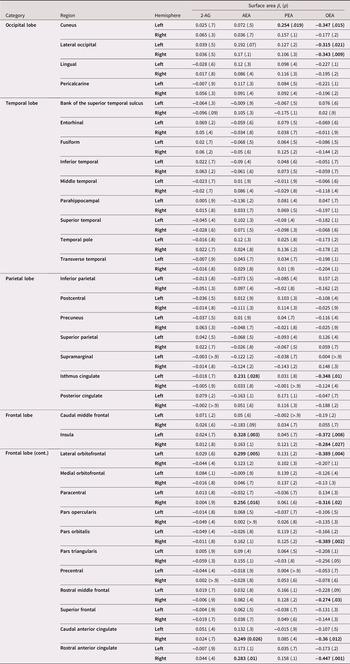
Fully standardized loadings between lipid concentrations and cortical surface area (SA) in all ROIs are displayed in Table 5 and visualized in Figure 3 (thresholded findings) and Figure 4 (full gradient of loadings). 2-AG. There were no significant associations between 2-AG and SA in any of the ROIs. AEA. Greater circulating AEA concentrations were associated with greater SA in the left isthmus of the cingulate (β = 0.23, p = .03), left insula (β = 0.33, p = .003), left lateral orbitofrontal (β = 0.30, p = .005), right paracentral (β = 0.26, p = .02), right caudal anterior cingulate (β = 0.25, p = .03), and right rostral anterior cingulate regions (β = 0.28, p = .01). PEA. PEA was associated with larger SA in the cuneus (β = 0.25, p = .02). OEA. Higher OEA concentrations were associated with smaller SA in the left cuneus (β = −.035, p = .02), lateral occipital (left: β = −0.31, p = .02; right: β = −0.34, p = .01), left isthmus of the cingulate (β = −0.35, p = .01), insula (left: β = −0.37, p = .008; right: β = −0.28, p = .03), left lateral orbitofrontal (β = −0.39, p = .004), right paracentral (β = −0.32, p = .02), right pars orbitalis (β = −0.39, p = .002), right rostral middle frontal (β = −0.27, p = .03), right caudal anterior cingulate (β = −0.36, p = .01), and right rostral anterior cingulate (β = −0.45, p = .001) regions. No associations remained significant after Benjamini–Hochberg correction for FDR. Loadings for sex-stratified models are available in Supplemental Tables 6 and 7; findings were generally consistent across sexes.
Endocannabinoid loadings on cortical surface area. Values significant at an alpha threshold of 0.05 are bolded. No values remained significant after Benjamini–Hochberg FDR correction (n = 272)
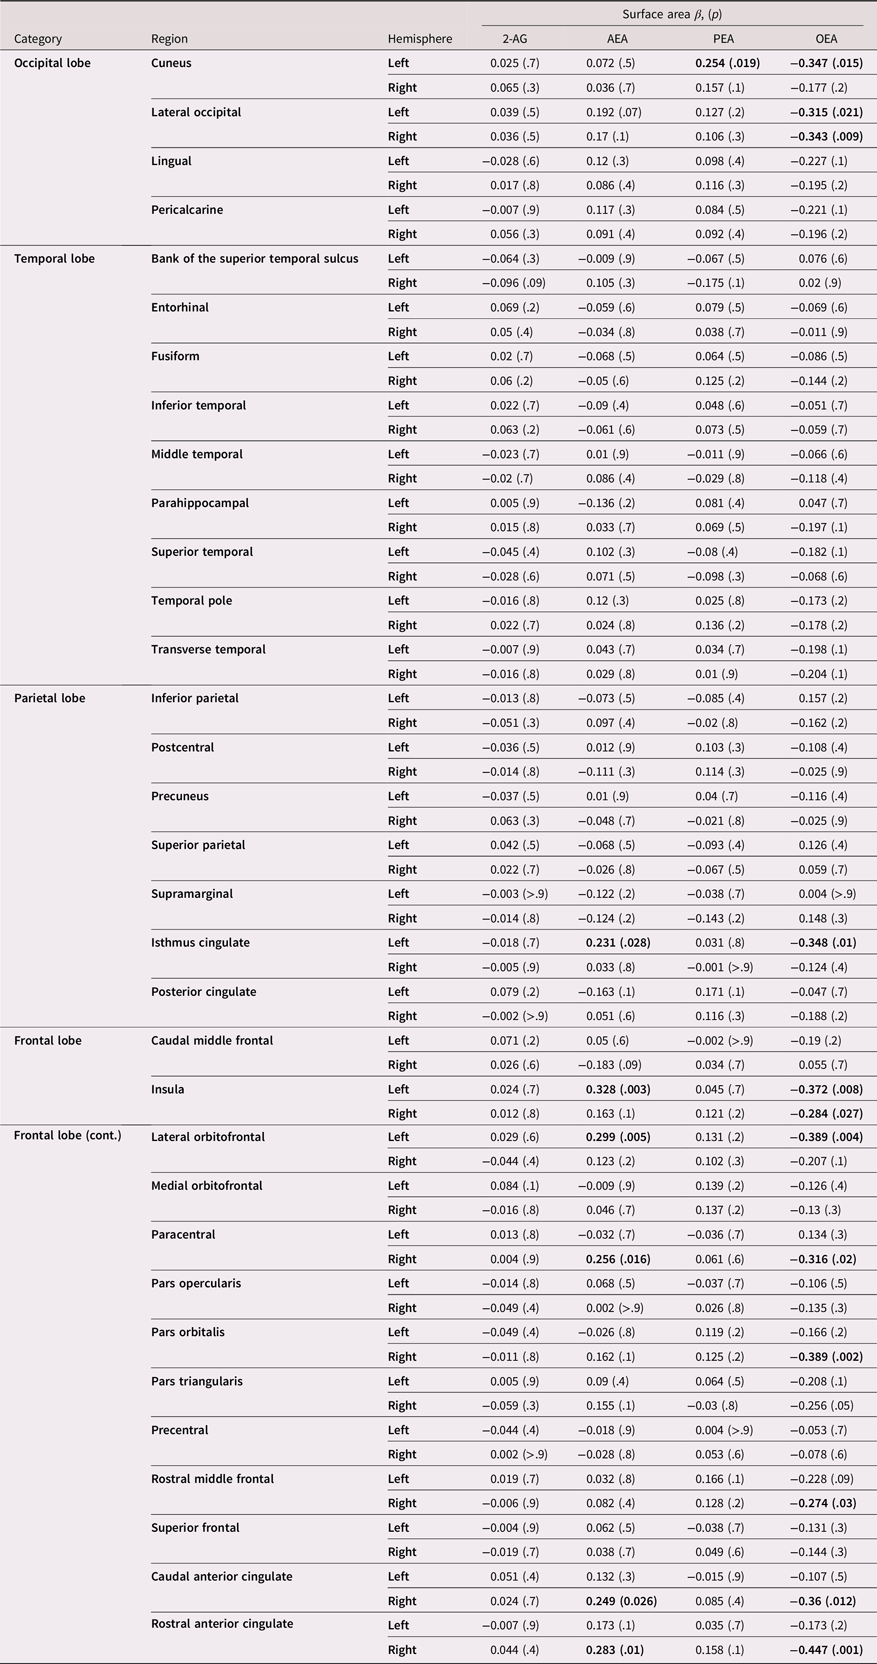
Table 5. Long description
A table displaying endocannabinoid loadings on cortical surface area across various brain regions. The table has 10 rows and 7 columns. Column headers are Category, Region, Hemisphere, Surface area, 2-AG, AEA, PEA, and OEA. Row labels include different brain regions such as Occipital lobe, Temporal lobe, Parietal lobe, and Frontal lobe. Each row provides values for surface area and endocannabinoid loadings for 2-AG, AEA, PEA, and OEA. Notable values are bolded, indicating significance at an alpha threshold of 0.05. The table shows various associations between endocannabinoid concentrations and cortical surface area in different brain regions.
Cortical thickness
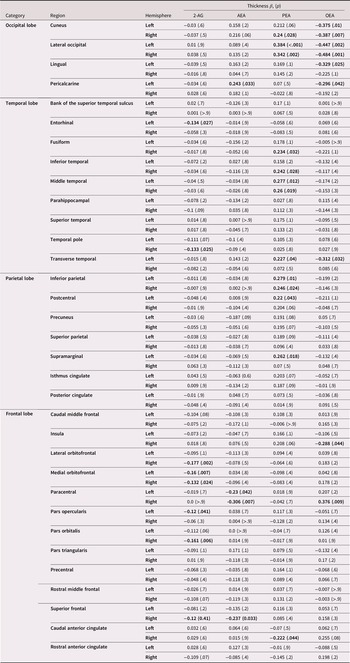
Fully standardized loadings between lipid concentrations and cortical thickness in all ROIs are displayed in Table 6 and visualized in Figure 3 (thresholded findings) and Figure 4 (full gradient of loadings). 2-AG. Greater circulating 2-AG concentrations were associated with smaller cortical thickness in the right temporal pole (β = −0.13, p = .03), and left entorhinal (β = −0.13, p = .03), right superior frontal (β = −0.12, p = .04), right pars orbitalis (β = −0.16, p = .006), left pars opercularis (β = −0.12, p = .04), medial orbitofrontal (left: β = −0.16, p = .007; right: β = −0.13, p = .02), and right lateral orbitofrontal (β = −0.18, p = .002) ROIs. AEA. Higher concentrations of AEA were associated with greater thickness in the left pericalcarine region (β = 0.24, p = .03) and thinner cortex in the paracentral (left: β = −0.23, p = .04; right: β = −0.31, p = .007) and right superior frontal (β = −0.24, p = .03) regions. PEA. Higher PEA concentrations were associated with thinner cortex in the right caudal anterior cingulate (β = −0.22, p = .04) region and greater thickness in the lateral occipital (left: β = 0.38, p < .001; right: β = 0.34, p = .002), right cuneus (β = 0.24, p = .03), left transverse temporal (β = 0.23, p = .04), middle temporal (left: β = 0.28, p = .01; right: β = 0.26, p = .02), right inferior-temporal (β = 0.24, p = .03), right fusiform (β = 0.23, p = .03), left supramarginal (β = 0.26, p = .02), left postcentral (β = 0.22, p = .04), and inferior parietal (left: β = 0.28, p = .01; right: β = 0.25, p = .02) regions. OEA. Higher OEA concentrations were associated with greater thickness in the right paracentral region (β = 0.38, p = .01) and thinner cortex in the cuneus (left: β = −0.38, p = .01, right: β = −0.39, p = .007), bilateral occipital (left: β = −0.45, p = .002, right: β = −0.48, p = .001), left lingual (β = −0.33, p = .02), left pericalcarine (β = −0.30, p = .04), left transverse temporal cortex (β = −0.31, p = .03), and right insula (β = −0.29, p = .04) regions. No associations remained significant after Benjamini–Hochberg correction for FDR. Loadings for sex-stratified models are available in Supplemental Tables 8 and 9; findings were generally consistent across sexes.
Endocannabinoid loadings on cortical thickness. Values significant at an alpha threshold of .05 are bolded. No values remained significant after Benjamini–Hochberg FDR correction for (n = 272)
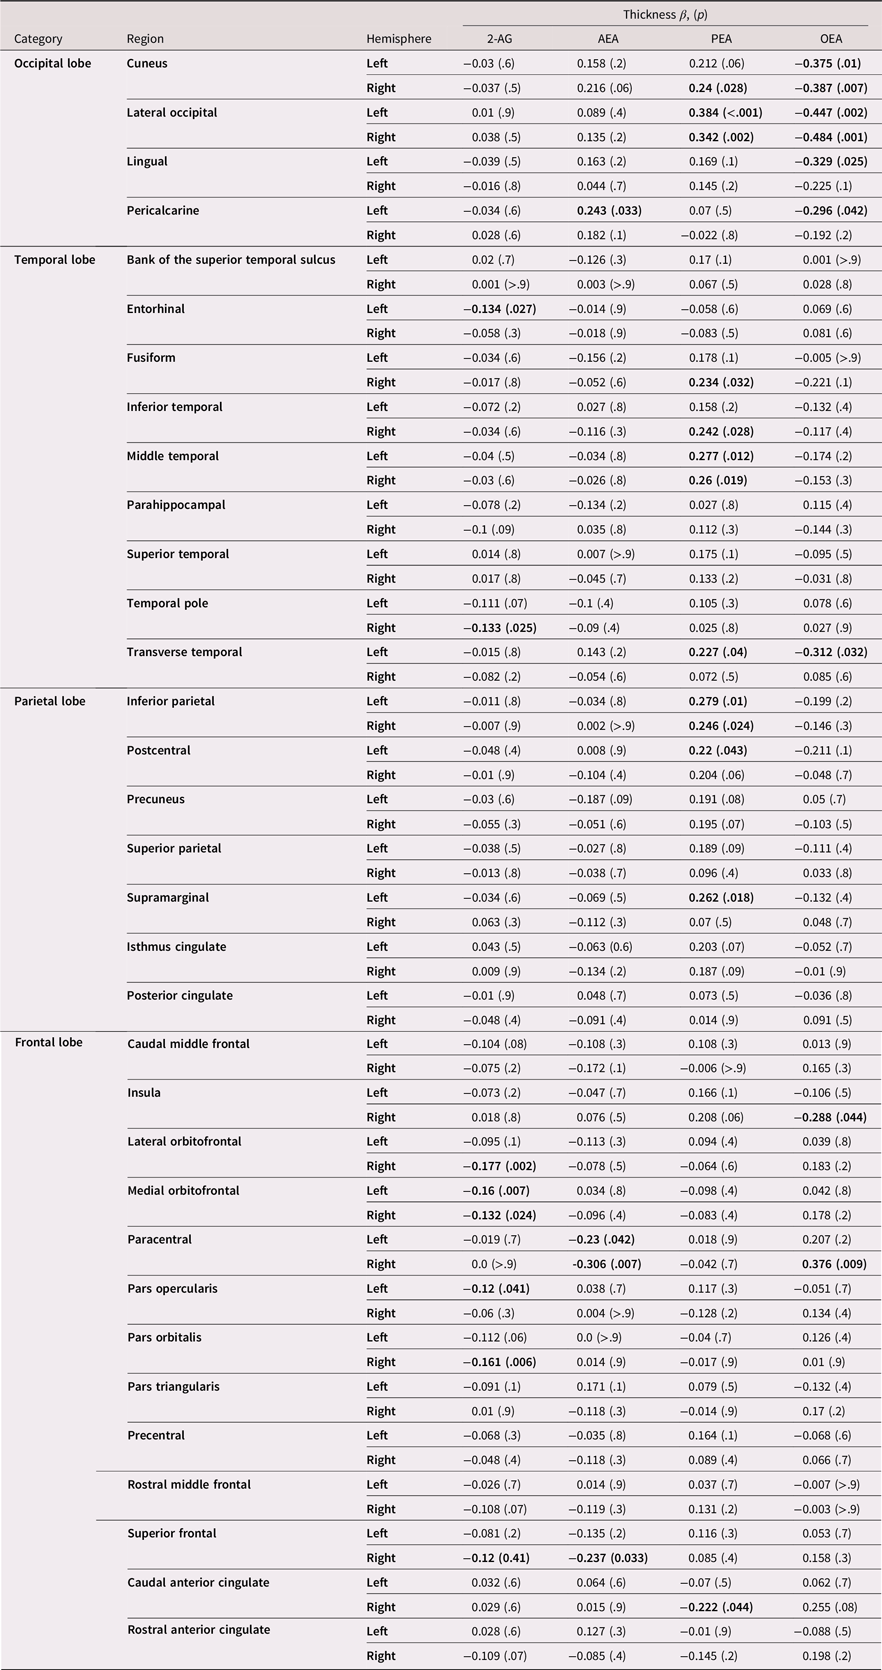
Table 6. Long description
A table displaying fully standardized loadings between lipid concentrations and cortical thickness in various regions of interest (ROIs). The table has 10 rows and 7 columns. Column headers are Category, Region, Hemisphere, Thickness 2-AG, AEA, PEA, and OEA. Row labels include different brain regions such as Occipital lobe, Temporal lobe, Parietal lobe, and Frontal lobe. Each row provides values for thickness associated with different endocannabinoids (2-AG, AEA, PEA, OEA) in specific brain regions. Values significant at an alpha threshold of .05 are bolded.
Discussion
Preclinical models have suggested a significant role of the eCB system in early-adolescent brain structure, although no studies to date have examined this in human teens. Therefore, we aimed to evaluate the cross-sectional relationships between circulating eCBs (2-AG & AEA) and related lipid (OEA & PEA) levels and indicators of brain morphometry in a cohort of 294 preadolescents and early adolescents (aged 10–14, 45% female). We found significant relationships between each lipid assessed and subcortical and cortical volume, surface area, and cortical thickness. Overall, the observed results are consistent with preclinical data indicating eCBs and associated lipids are associated with brain structure during this critical neurodevelopmental period and expands upon prior studies by revealing a more nuanced relationship that is both region and ligand specific. Notably, when applying more conservative FDR correction, only the links between OEA and insula and lateral occipital volumes remained; this suggests that links between eCB levels and lipids demonstrate relatively small effects at this age, and results will need further replication.
Each of the lipids analyzed had its own profile of associations with structural brain outcomes. Circulating 2-AG concentrations were negatively associated with cortical thickness across select regions in the frontal (right lateral orbitofrontal, bilateral medial orbitofrontal, left pars opercularis, right pars orbitalis, and right superior frontal) and temporal (left entorhinal, right temporal pole) regions. Similarly, increased circulating 2-AG concentrations were associated with reduced left pars orbitalis volume. Thus, circulating 2-AG concentrations were particularly associated with subregions of the temporal cortex and inferior frontal gyrus structures associated with verbal and emotional learning and memory and language development including phonological and semantic processing (Herlin et al., Reference Herlin, Navarro and Dupont2021). These areas typically mature during the school age years with thinning occurring into the adolescent years, which is linked with improved verbal learning and vocabulary (Sowell et al., Reference Sowell, Peterson, Thompson, Welcome, Henkenius and Toga2003, Reference Sowell, Thompson, Leonard, Welcome, Kan and Toga2004). One possible mechanism underlying these relationships is that greater 2-AG brain signaling may be linked with more efficient pruning in prefrontal regions still undergoing maturation during the early-adolescent years. Another possible mechanism is peripheral 2-AG signaling may indirectly impact brain health thru inflammatory, metabolic, stress, and microbiota–gut–brain axis processes (de Almeida et al., Reference de Almeida, Dias-Rocha, Reis-Gomes, Wang, Cordeiro, Pazos-Moura, Joss-Moore and Trevenzoli2021; Hill et al., Reference Hill, Miller, Carrier, Gorzalka and Hillard2009; Mecha et al., Reference Mecha, Yanguas-Casás, Feliú, Mestre, Carrillo-Salinas, Azcoitia, Yong and Guaza2019; Rahaman & Ganguly, Reference Rahaman and Ganguly2021; Turcotte et al., Reference Turcotte, Blanchet, Laviolette and Flamand2016; Şerban et al., Reference Şerban, Toader and Covache-Busuioc2025). These mechanisms will need to be confirmed in additional preclinical adolescent studies. Additionally, longitudinal studies examining the impact of 2-AG on brain structure and downstream language and verbal abilities in healthy developing teens will help clarify these relationships within the context of neurodevelopmental changes over time.
Higher circulating AEA concentrations were associated with greater volumes in insula and cingulate regions (bilateral insula, right caudal ACC, left isthmus of the cingulate) and greater SAs in frontal regions (left insula, left lateral orbitofrontal, right paracentral, left isthmus of the cingulate, right rostral ACC, right caudal ACC) (with the exception of a negative relationship with the right caudal-middle frontal region). To a lesser extent, AEA concentrations were positively associated with occipital (right lateral occipital volume and left pericalcarine volume and thickness) regions. Generally, this pattern suggests that circulating AEAs during this preadolescent and early-adolescent period were positively associated with greater volumes and SA, especially in orbitofrontal, insula, and cingulate regions that underlie value-based decision-making, affective processing, and motivation. During this period of development, these regions are generally increasing in size with healthy development, with affective processing and motivation skills continuing to develop and peak during the early-adolescent years (Ahmed et al., Reference Ahmed, Bittencourt-Hewitt and Sebastian2015; Doremus-Fitzwater et al., Reference Doremus-Fitzwater, Varlinskaya and Spear2010; Giedd et al., Reference Giedd, Blumenthal, Jeffries, Castellanos, Liu, Zijdenbos, Paus, Evans and Rapoport1999; Somerville et al., Reference Somerville, Jones and Casey2010; Sowell et al., Reference Sowell, Thompson, Leonard, Welcome, Kan and Toga2004; Yang & Tseng, Reference Yang, Tseng and Andersen2021). Thus, higher circulating AEA concentrations appear to be linked with frontal and occipital morphometry, suggesting either greater ongoing expansion or early signs of delayed frontal cortex pruning, though this relationship will need to be tested longitudinally as the youth continue to develop into later adolescence. As stated above, preclinical research is needed to identify possible underlying mechanisms linking 2-AG to adolescent structural development.
Similar to AEA, circulating PEA concentration was positively associated with right insula volume. We also found positive relationships between PEA concentrations and left amygdala volume and occipital (bilateral cuneus volume, left cuneus SA, right cuneus thickness, bilateral lateral occipital volume, and thickness), temporal (right fusiform thickness, right inferior-temporal thickness, bilateral middle temporal thickness, left traverse temporal thickness and volume), and parietal (bilateral inferior parietal thickness, left postcentral volume and thickness, right postcentral volume, left posterior cingulate volume, left supramarginal thickness) morphometry. This posterior to anterior gradient of effect corresponds to cortical brain areas likely to be in peak development during this early-adolescent developmental window, suggesting that greater PEA circulating concentrations are associated with greater expansion and likely completed pruning of these posterior regions, though longitudinal neurodevelopmental studies are needed to confirm this. PEA has demonstrated neuroprotective, anti-inflammatory processes in adults through PPAR-α receptors (Scuderi et al., Reference Scuderi, Valenza, Stecca, Esposito, Carratù and Steardo2012; Valenza et al., Reference Valenza, Facchinetti, Steardo and Scuderi2022). PEA is readily synthesized in the brain from the fatty acid palmitate and ethanolamine and is commonly available in supplement form (Peritore et al., Reference Peritore, Siracusa, Crupi and Cuzzocrea2019). Therefore, further research is necessary to investigate the impact of circulating PEA concentrations on brain development, psychopathology, and neurocognitive outcomes in youth, ultimately aiming to assess the clinical potential of PEA interventions.
Interestingly, higher circulating OEA concentrations were broadly negatively associated with frontolimbic volume (left hippocampus, left amygdala, right caudal ACC, bilateral insula, left isthmus cingulate, left lateral orbitofrontal, right pars orbitalis, and right rostral anterior cingulate), SA (left isthmus cingulate, bilateral insula, left lateral orbitofrontal, right paracentral, right pars orbitalis, right rostral middle frontal), and thickness (right insula). Conversely, OEA concentrations were positively associated with right paracentral thickness. Significant negative relationships were seen with circulating OEA concentrations and occipital (left cuneus volume, SA and thickness, right cuneus volume and thickness, right and left lateral occipital volume, SA and thickness, left lingual thickness, left pericalcarine volume and thickness) and temporal (left transverse temporal volume and SA) regions. Links between OEA and insula and lateral occipital volumes were the only individual relationships to survive FDR correction. The pattern of OEA associations demonstrated several overlapping frontolimbic relationships with AEA and occipital relationships with PEA, but in the opposite direction. OEA also shared some notable negative relationships with inferior frontal gyrus regions, that were similarly observed with 2-AG. To date, very little has been established concerning the differences of functioning among the NAEs during this phase of development. Since the NAEs share degradative processes, one potential explanation is that the syntheses of the three molecules differ, perhaps as a result of differences in the identity of the N-acyl group in the precursor N-acyl-phosphatidylethanolamine (NAPE) pools or in the synthetic enzymes involved (Tsuboi et al., Reference Tsuboi, Ikematsu, Uyama, Deutsch, Tokumura and Ueda2013). Though we were not able to measure in the current design, it is also possible that differences in subtypes of CB1 receptors with different functional impact in specific brain regions. For example, mitochondria express membrane bound CB1 receptors (mtCB1), which are thought to regulate cellular metabolism, appear to mediate the impact of corticosterone on novel object recognition (Skupio et al., Reference Skupio, Welte, Serrat, Eraso-Pichot, Julio-Kalajzić, Gisquet, Cannich, Delcasso, Matias, Fundazuri, Pouvreau, Pagano Zottola, Lavanco, Drago, Ruiz De Azua, Lutz, Bellocchio, Busquets-Garcia, Chaouloff and Marsicano2023). These receptors appear to be region specific and their activation results in a structural response. However, this structural response is fundamentally different than that which would be observed through activation of CB1 receptors associated with oligodendrocyte survival and proliferation. Thus, further research is needed to examine region specific effects of individual eCBs in humans.
Clinical implications
While correlational in nature, these findings provide evidence that circulating eCB levels are linked with brain morphometry during early adolescence. This provides preliminary support for the hypothesis that eCB signaling plays a role in structural brain development. They further suggest that PPAR-mediated signaling, regulated by PEA and OEA, could be an important regulator during this time period. Future preclinical research will need to be conducted to determine whether these associations are due to brain eCB signaling, measured as an overflow from the brain in peripheral samples, or peripheral eCB levels involved in physical health such as immune function, inflammatory processes, metabolism, stress response, and microbiota-gut-brain axis that are all linked with brain health. Additional studies examining the cross-sectional and longitudinal relationships between circulating eCBs and related lipids and downstream neurocognitive processes such as memory, executive function, affective processing, stress response, and risk for psychiatric conditions are needed. On balance, longitudinal studies are needed to identify factors that impact eCB levels and neurocognition, such as adverse childhood events, chronic stress, physical fitness, adiposity, and psychopathology. Understanding these unique developmental relationships could help inform future prevention campaigns, treatment interventions, and policy guidelines aimed at maximizing healthy adolescent brain development. One potential intervention target for boosting eCB signaling is aerobic activity, which increases the concentrations of this family of lipids and could impact relevant frontal, limbic and parietal structure and behavioral targets (Brellenthin et al., Reference Brellenthin, Crombie, Hillard and Koltyn2017; Crombie, Cisler, Hillard, et al., Reference Crombie, Cisler, Hillard and Koltyn2021; Crombie, Sartin-Tarm, Sellnow, et al., Reference Crombie, Sartin-Tarm, Sellnow, Ahrenholtz, Lee, Matalamaki, Adams and Cisler2021; Ferreira-Vieira et al., Reference Ferreira-Vieira, Bastos, Pereira, Moreira and Massensini2014; Lisdahl et al., Reference Lisdahl, Filbey and Gruber2021; Sirotiak et al., Reference Sirotiak, Gallagher, Smith-Hernandez, Showman, Hillard and Brellenthin2023; Sullivan et al., Reference Sullivan, Wallace, Wade, Swartz and Lisdahl2020, Reference Sullivan, Wallace, Wade, Swartz and Lisdahl2021; Wade et al., Reference Wade, Wallace, Swartz and Lisdahl2019). Finally, future studies can examine how extent of cannabis (primarily containing delta-9-THC) exposure and potency interacts with circulating eCBs and related lipids to influence neurocognition and risk for cannabis use disorder development in adolescents.
Future directions and limitations
Limitations to the study should be considered. Only the relationships between OEA and insula and lateral occipital volume remained when applying more conservative FDR threshold correction; this FDR correction substantially reduced power to detect small effect sizes, which are common when examining predictors of brain imaging outcomes (Dick et al., Reference Dick, Lopez, Watts, Heeringa, Reuter, Bartsch, Fan, Kennedy, Palmer, Marshall, Haist, Hawes, Nichols, Barch, Jernigan, Garavan, Grant, Pariyadath, Hoffman and Thompson2021). Thus, findings need to be replicated in a larger sample. Further, the present study was conducted cross-sectionally, but future data from the ABCD Endocannabinoid Substudy may allow for more nuanced analyses of longitudinal growth neurodevelopmental trends associated with circulating concentrations of eCBs and related lipids. Careful consideration of medication use that may impact eCBs could not be investigated due to coding limitations; future re-coded ABCD medication data may address this. Sex differences in circulating eCB levels over time have been reported (Amir Hamzah et al., Reference Amir Hamzah, Toms, Kucharski, Orr, Turner, Hobson, Nichols and Ney2023); due to the complexity of the models and the modest sample size, sex moderation was not sufficiently explored in the current study. We conducted sex--stratified models within the regions for each outcome for which the effect of an eCB was significant. Thie full table of results can now be found in Supplemental Tables 3–9. The pattern of results did not substantially change the interpretation of the results (slight differences in findings are likely due to differences in sample sizes). Further, though sex-at-birth was controlled for, we did not take into account pubertal status or circulating concentrations of sex steroid hormones, which modulate circulating eCB concentrations in rodents (El-Talatini et al., Reference El-Talatini, Taylor and Konje2010; Habayeb et al., Reference Habayeb, Taylor, Evans, Cooke, Taylor, Bell and Konje2004; Kim et al., Reference Kim, Zagzoog, Black, Baccetto, Laprairie and Shukla2023; Ney et al., Reference Ney, Matthews, Bruno and Felmingham2018). Future analyses of the eCB Substudy will include larger, longitudinal sample sizes that will also allow for more detailed consideration of sex differences in the relationships over time. It is suggested that these analyses also consider pubertal status and gonadal hormones in the modeling approach (Herting et al., Reference Herting, Uban, Gonzalez, Baker, Kan, Thompson, Granger, Albaugh, Anokhin, Bagot, Banich, Barch, Baskin-Sommers, Breslin, Casey, Chaarani, Chang, Clark, Cloak and Sowell2021). The metrics of brain morphometry used (volume, surface area, and cortical thickness) were based on tabulated data from the ABCD 5.1 release and whole-brain analyses were not investigated. Additionally, future research might benefit from using local gyrification index and close investigation of diffusion tensor imaging as an additional metric of brain morphology.
Conclusions
The current study is the largest cross-sectional examination to date of circulating concentrations of eCBs and related lipids and brain structure in preadolescent and early-adolescent youth. We found unique patterns between individual circulating lipids, including AEA, PEA, OEA and 2-AG, and subcortical and cortical morphometry during this important neurodevelopmental stage. Though findings need replication in a larger sample, they provide a preliminary theoretical basis for future studies of interventions that could boost these signaling pathways (e.g., exercise interventions) to promote healthy brain development. Future studies are needed to examine these relationships longitudinally, further examine potential sex differences, and to link these relationships with downstream cognitive and affective development.
Supplementary material
The supplementary material for this article can be found at https://doi.org/10.1017/S0954579426101904.
Data availability statement
Data used in the preparation of this article were obtained from the Adolescent Brain Cognitive DevelopmentSM (ABCD) Study (https://abcd study.org), held in the NIMH Data Archive (NDA). This is a multisite, longitudinal study designed to recruit more than 10,000 children age 9–10 and follow them over 10 years into early adulthood. The ABCD Study® is supported by the National Institutes of Health and additional federal partners under award numbers U01DA041048, U01DA050989, U01DA051016, U01DA041022, U01DA051018, U01DA051037, U01DA050987, U01DA041174, U01DA041106, U01DA041117, U01DA041028, U01DA041134, U01DA050988, U01DA051039, U01DA041156, U01DA041025, U01DA041120, U01DA051038, U01DA041148, U01DA041093, U01DA041089, U24DA041123, U24DA041147. A full list of supporters is available at https://abcdstudy.org/federal-partners.html. A listing of participating sites and a complete listing of the study investigators can be found at https://abcdstudy.org/consortium_members/. ABCD consortium investigators designed and implemented the study and/or provided data but did not necessarily participate in the analysis or writing of this report. This manuscript reflects the views of the authors and may not reflect the opinions or views of the NIH or ABCD consortium investigators. The ABCD data repository grows and changes over time. The ABCD data used in this report came from ABCD Data Release 5.1 (https://data-archive.nimh.nih.gov/abcd; DOI: 10.15154/z563-zd24, December 2024).
Acknowledgments
We thank the study participants, BraIN lab team, and our funding agencies. The code necessary to reproduce the analyses presented here is publicly accessible.
Funding statement
The author(s) declare that financial support was received for the research and/or publication of this article. This research was supported by the National Institute of Health (NIH) awards R21DA09109 (PI: Lisdahl, K. M. and Hillard, C. J.) U01DA041025 (PI: Lisdahl, K. M. and Larson, C. L.). Kaiver, C. M. was supported by U01DA041156 (PI: Gonzalez, R. and Laird, A. R.). Sullivan, R. M. was supported by T32AA013525 (PI: Riley/Spadoni to Sullivan).
Competing interests
Cecilia Hillard is a member of the Scientific Advisory Board and has equity in Formulate Biosciences, LLC. Her work with this entity has no overlap with the studies reported herein. The authors declare no competing interests.
Pre-registration statement
Analyses were not pre-registered. Code for this research is available at the following URL: https://osf.io/hjv2r/.






 Open access

