Introduction
Recent data presented by the IETS reveal that more than 700,000 in vitro-produced (IVP) embryos are transferred worldwide yearly. The combination of IVP with genomic selection and sexed semen has proven to be successful in the commercial field in several countries, helping professionals and cattle producers to improve the reproductive performance, efficiency, and genetic gain of their herds (Ferré et al., Reference Ferré, Kjelland, Taiyeb, Campos-Chillon and Ross2020).
However, only 40–50% of matured and in vitro fertilized oocytes reach the blastocyst stage (Rizos et al., Reference Rizos, Fair, Papadopoulos, Boland and Lonergan2002), and the pregnancy rate may be lower than that of in vivo-produced embryos (de Sousa et al., Reference de Sousa, da Silva Cardoso, Butzke, Dode, Rumpf and Franco2017). Fetal bovine serum (FBS) supplementation effectively maintains and develops bovine embryos (Saeki et al., Reference Saeki, Hoshi, Leibfried-Rutledge and First1991; Gordon Reference Gordon2003). However, it is linked to deleterious embryonic effects (Farin et al., Reference Farin, Farin and Piedrahita2004), such as alterations in compaction and blastulation, increased incidence of stillbirths and mortality after birth (Abe et al., Reference Abe, Yamashita, Itoh, Satoh and Hoshi1999), increased incidence of large offspring syndrome (Jacobsen et al., Reference Jacobsen, Schmidt, Holm, Sangild, Vajta, Greve and Callesen2000; van Wagtendonk-de Leeuw et al., Reference van Wagtendonk-de Leeuw, Mullaart, de Roos, Merton, den Daas, Kemp and de Ruigh2000; Farin et al., Reference Farin, Farin and Piedrahita2004), low repeatability due to variations between FBS batches (Stringfellow et al., Reference Stringfellow, Givens and Waldrop2004), and lower recovery rates of cryopreserved embryos after thawing (Gómez et al., Reference Gómez, Rodríguez, Muñoz, Caamaño, Hidalgo, Morán, Facal and Díez2008).
In vitro culture of zygotes without adding FBS resulted in slower developing embryos. Compared with calves derived from IVP with FBS, these embryos yielded higher quality morulae that resulted in calves presenting significantly lower birth weight and a significantly easier parturition process (van Wagtendonk-de Leeuw et al., Reference van Wagtendonk-de Leeuw, Mullaart, de Roos, Merton, den Daas, Kemp and de Ruigh2000). These studies led to the search for alternatives to replace FBS with compounds that do not negatively interfere with embryonic quality (Mesalam et al., Reference Mesalam, Kong, Khan, Chowdhury, Choi, Kim, Cho, Jin and Kong2017). Different culture media influence the metabolism and production of blastocysts (Krisher et al., Reference Krisher, Lane and Bavister1999), and FBS contains glucose, which is a limiting growth factor when in low concentrations; however, it is already added to culture media of different species of mammals (Barnett and Bavister, Reference Barnett and Bavister1996).
Early stages of development require low glucose levels for intracellular signalling purposes as glucose metabolism is reduced, (Martin and Leese, Reference Martin and Leese1995), but glucose consumption increases in the morula and blastocyst stages (Thompson, Reference Thompson2000). The embryo changes from a relatively metabolic-inactive cell at ovulation to an active metabolic cell at the blastocyst stage (Leese, Reference Leese2012)
Two distinct cell lines constitute the blastocyst, in which approximately two-thirds of the cells comprise the trophectoderm (TE), and the remainder comprises the inner cell mass (ICM). The ICM results in the embryo itself, whereas the TE cells will give rise to extraembryonic lineages, including the placenta (Frankenberg et al., Reference Frankenberg, de Barros, Rossant and Renfree2016). Diminished TE cell numbers can lead to insufficient placentation and, consequently, to embryonic losses (Koo et al., Reference Koo, Kang, Choi, Park, Kim, Oh, Son, Park, Lee and Han2002).
In murine blastocysts, the TE cells are more metabolically active than ICM cells concerning oxygen consumption, lactate, and ATP production (Houghton Reference Houghton2006). In contrast, cattle cells isolated from TE consumed higher levels of pyruvate and produced lactate, whereas cells isolated from the ICM consumed more glucose (Gopichandran and Leese, Reference Gopichandran and Leese2003). It has been recently shown that glucose plays a decisive role in specifying the trophectoderm in murine embryos through the activation of Cdx2 during the transition from morula to blastocyst (Chi et al., Reference Chi, Sharpley, Nagaraj, Roy and Banerjee2020). Also, it is known that fibroblast growth factor 4 (FGF4) is the crucial specification signal during the second cell differentiation between primitive endoderm (PE) and the epiblast (EPI) in the murine blastocyst (Yamanaka et al., Reference Yamanaka, Lanner and Rossant2010; Frankenberg et al., Reference Frankenberg, Gerbe, Bessonnard, Belville, Pouchin, Bardot and Chazaud2011; Kang et al., Reference Kang, Piliszek, Artus and Hadjantonakis2013; Saiz et al., Reference Saiz, Williams, Seshan and Hadjantonakis2016b). As FBS is not a defined supplement, it may contain growth factors such as FGF (Zheng et al., Reference Zheng, Baker, Hancock, Fawaz, McCaman and Pungor2006), acting in the differentiation of PE.
Therefore, FBS could cause distortions and biased results in studies on early cell differentiation. To verify the impacts of FBS on cell differentiation during the development of bovine embryos, we hypothesized that FBS supplementation during in vitro culture interferes with cell differentiation in early bovine embryo development, increasing the number of TE and PE cells. Therefore, the main goal of this study was to evaluate the effect of FBS on embryonic development in vitro by assessing rates, metabolic aspects that may influence cell differentiation, and the number of cells of bovine blastocysts, using specific markers of cell lineages.
Materials and methods
Ethical statement
This study was approved by the Animal Use Ethics Council of the College of Veterinary Medicine and Animal Science of the University of São Paulo, under protocol no. 7375181217.
In vitro maturation and fertilization
Cumulus–oophorus complexes (COCs) were obtained from ovaries at a commercial slaughterhouse. Grade I oocytes were selected based on the number of surrounding cells and cytoplasmic homogeneity. COCs were washed in HECM–HEPES (HH) medium (Bavister et al., Reference Bavister, Leibfried and Lieberman1983) followed by in vitro maturation (IVM) in 199 medium (Gibco, Thermo Fisher, Waltham, MA, USA) that was supplemented with 10% FBS; Gibco), 22 μg/ml sodium pyruvate, 50 μg/ml gentamicin, 0.5 μg/ml FSH Folltropin-V (Vetrepharm, Inc. Belleville, ON, Canada), 50 μg/ml hCG (Vetecor Laboratories, Callier, Spain) and 1 μg/ml of estradiol. The COCs were placed in drops of 90 μl IVM medium that were kept under filtered mineral oil for 22 h at 38.5°C, in 5% CO2 and high humidity. After maturation, COCs were washed in HH and transferred to 90 μl drops of IVF medium (Fert-TALP; Parrish et al., Reference Parrish, Susko-Parrish, Winer and First1988) containing 20 μg/ml of heparin under oil. Fertilization was performed using frozen–thawed sperm, and live cells were sorted using a 90/45% Percoll gradient (GE Healthcare, Buckinghamshire, UK) after centrifugation at 6600 g for 5 min. The sperm pellet formed at the bottom of the tube was then washed in IVF medium by centrifugation at 1100 g for 3 min. Before insemination, sperm motility was evaluated using optical microscopy, and sperm concentration was assessed using a haematocytometer. The concentration was adjusted to obtain a final concentration of 1 × 10⁶ sperm per ml in the IVF droplets. The droplets were inseminated, and the gametes were co-incubated for 18 h at 38.5°C in 5% CO2 and high humidity. Sperm straws from the same bull and batch were used throughout the experiment.
In vitro embryo culture
After 18 h of IVF, the presumptive zygotes were removed from the IVF plate, washed in HH medium, vortexed for 3 min to remove excess cumulus cells, and randomly distributed in groups of 20 into 90 μl drops of KSOM (Behringer et al., Reference Behringer, Gertsenstein, Vintersten and Nagy2003) culture medium. KSOM was supplemented with 3 mg/ml of bovine serum albumin (BSA), 1× MEM essential amino acids and 1× MEM non-essential amino acids, and 2.5 μg/ml of gentamicin. Embryos were cultured in an incubator at 38.5°C, with 5% CO2, 5% O2, and high humidity.
Treatments to test FBS influence on embryo cell allocation
Embryos were allocated to the three experimental groups at 90 h post insemination (90 hpi): the KSOM-FBS group was supplemented with 5 µl of FBS (ThermoFisher). In the KSOM33 group, 33% of the medium volume was removed and replaced with fresh medium. Group KSOM-Zero received no treatment during all IVC. Embryos were collected at 186 hpi for trophectoderm cell staining or 210 hpi for all other analyses, including blastocyst rates (blastocysts/inseminated oocytes) and embryonic development (blastocysts/cleaved embryos).
Analyses of metabolic characteristics of embryos
At 210 hpi, embryos were harvested to evaluate intracellular oxidative status using the fluorescent probe CellRox (ThermoFisher), and the mitochondrial membrane potential was observed using MitoTracker Red (ThermoFisher). Blastocysts were stained with 2.5 mM CellROX Green (ThermoFisher) and 1 mM MitoTracker Red (ThermoFisher) for 30 min in KSOM medium in an incubator at 38.5°C 5% CO2, 5% O2, and high humidity (n = 8 blastocysts per group). Blastocysts were then fixed in 4% paraformaldehyde for 20 min and visualized under an epifluorescence microscope.
The activities of the oxidizing agents nicotinamide adenine dinucleotide (NADH) and flavin adenine dinucleotide (FAD+) were measured as previously described (Dumollard et al., Reference Dumollard, Ward, Carroll and Duchen2007; Santos et al., Reference Santos, Fonseca Junior, Lima, Ispada, Silva and Milazzotto2021). Briefly, embryos were imaged individually within the culture drops under an epifluorescence microscope (Olympus IX-81, Olympus Corporation, Tokyo, Japan) using a long-distance ×20 objective. For NADH autofluorescence measurement, we used a 360–385 nm excitation and 420 nm emission filter (UMWU2 filter cube), and for FAD+ autofluorescence measurement, we used 460–490 nm excitation and 520 emission filter (UMWB2 filter cube). Images were obtained with CellSens Dimension software (Olympus Corporation) using the Z-stack function, obtaining images every 10 μm. Fluorescence intensity was measured using ImageJ software (NIH) on maximum intensity projection images generated by CellSens Dimension. Fluorescence intensity was corrected by a two-step approach in which we subtracted the average of two background values and adjusted the fluorescence decay along the Z-axis, as described previously (Saiz et al., Reference Saiz, Kang, Schrode, Lou and Hadjantonakis2016a).
Immunofluorescence and cell counting
Immunofluorescence protocols were performed on embryos from the different groups to verify whether FBS altered cell allocation. Embryos had their zona pellucida removed by incubation in 0.5% protease in PBS (w/v) for 2 min, and they were fixed using 4% paraformaldehyde for 20 min at room temperature, followed by three washes in phosphate-buffered saline solution with 1 mg/ml polyvinylpyrrolidone (PBS–PVP) and stored at 4°C until use.
Embryos were permeabilized using 0.5% Triton X-100 solution in PBS–PVP for 15 min and then placed for 1 h at room temperature in blocking solution containing 0.1% Triton X-100, 1% BSA, and 10% fetal donkey serum in PBS–PVP. Incubation with the primary antibody occurred under gentle agitation at 4°C for 16 h. The primary antibodies used were rabbit anti-Cdx2 (1:50, ab88129, Abcam, Cambridge, MA, USA) and goat anti-SOX17 (1:100, AF1924, Novus Biologicals, Littleton, CO, USA) diluted in a solution of 0.1% Triton X-100 and 1% BSA in PBS/PVP. Embryos were then washed three times for 15 min in a washing solution (WS) containing 0.1% Triton X-100 in PBS–PVP and incubated for 1 h at room temperature in the dark with secondary donkey anti-rabbit antibody NL493 (1:200, NL006, R&D Systems, Minneapolis, MN, USA) or NL557 anti-goat donkey (1:200, NL001, R&D Systems) diluted in a solution of 0.1% Triton X-100 and 1% BSA in PBS/PVP. After this incubation with the secondary antibody, embryos were washed in WS three times for 15 min in the dark, incubated with Hoechst 33342 stain for 10 min, and mounted on slides. Embryos were then analyzed with a fluorescence microscope, and the images were obtained with CellSens Dimension software (Olympus Corporation). Using the same software, we counted trophectoderm cells labelled with anti-Cdx2 antibody, PE cells labelled with anti-SOX17 antibody, and total cells labelled with Hoechst.
Statistical analysis
Data were analyzed by analysis of variance (ANOVA), considering replicate as a random variable, treatment as an independent variable, and rates, fluorescence intensity, and cell number as dependent variables using PROC GLM from SAS 9.4. Normality of data and homogeneity of variances were tested using PROC UNIVARIATE and Guided Data Analysis of SAS. Data were transformed when necessary and back-transformed for presentation. A comparison of means was performed using Tukey’s test. The level of significance was set to 0.05. We performed a power analysis using PROC POWER of SAS for each of the dependent variables, and the results varied from 0.845 to 0.999, indicating that the experimental numbers were adequate for these experiments.
Results
Analysis of blastocyst formation and development rates
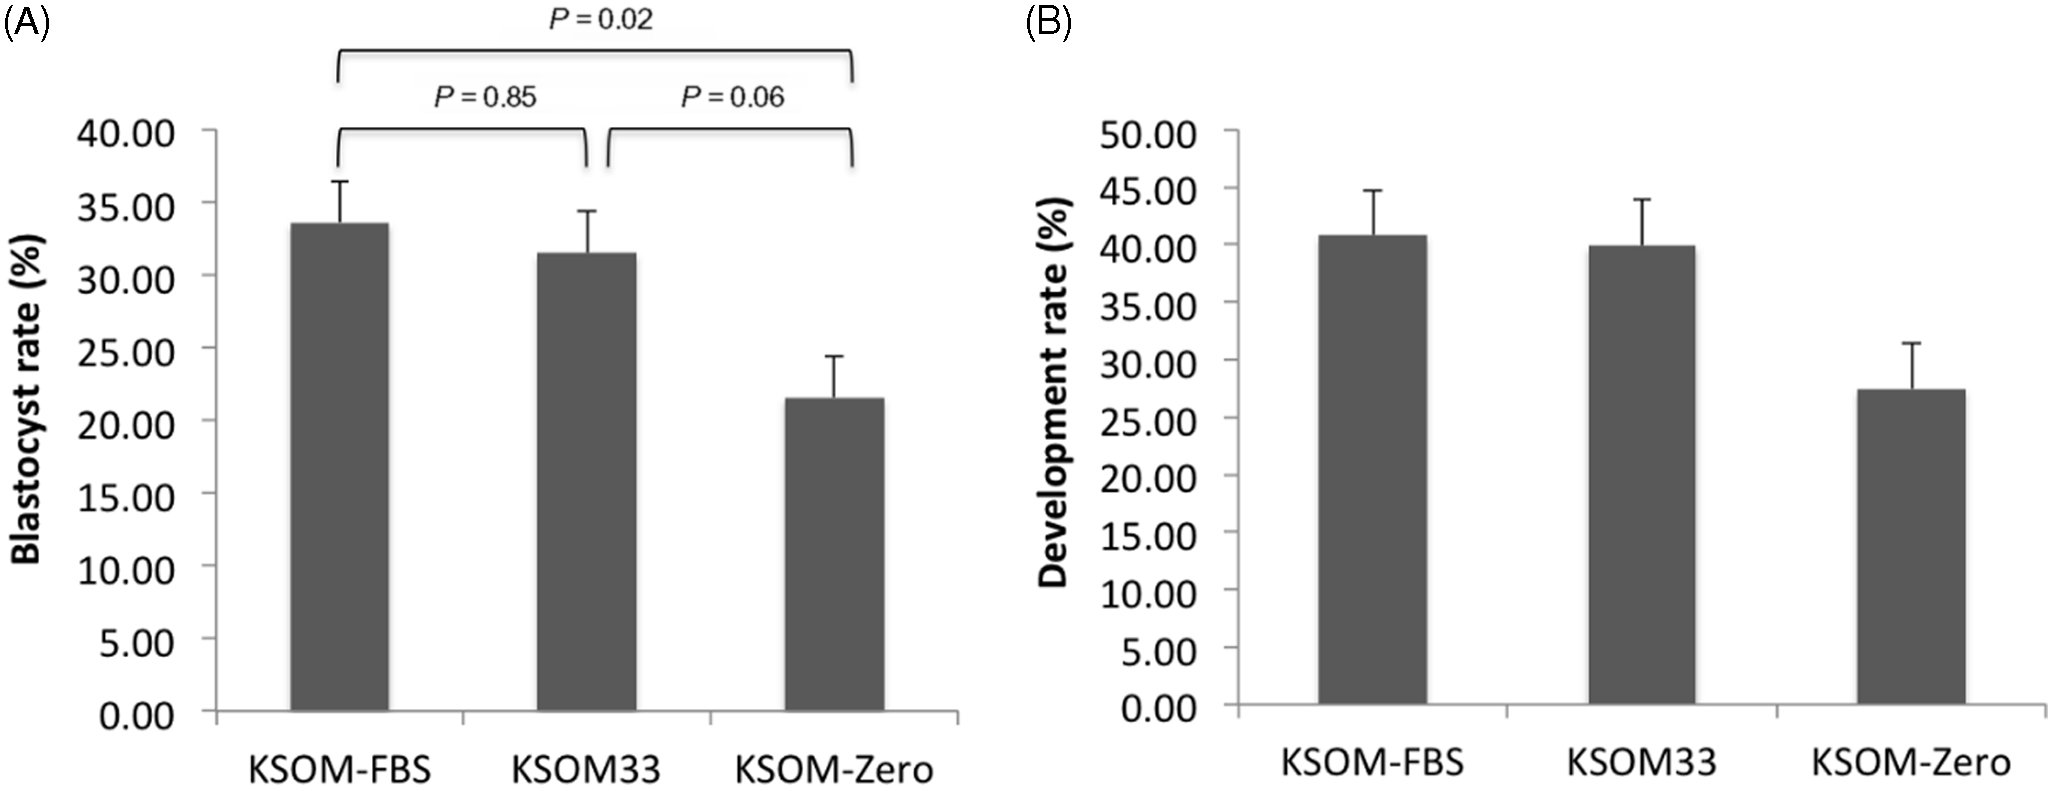
Among the three groups, the KSOM-FBS group [33.61 ± 2.85%; mean ± standard error of the mean (SEM), 134/390] had the highest rate of blastocyst formation (n = 8 replicates) but did not differ statistically (P = 0.85) from the KSOM33 group (31.48 ± 2.85%, 130/460). Results showed that the blastocyst rate in the KSOM-FBS group was higher (P =0.02) than in the KSOM-Zero group (21.57 ± 2.85%, 96/413), which did not differ statistically (P = 0.06) from the KSOM33 group (Figure 1A).
Results from in vitro embryo production in the three experimental groups. (A) Blastocyst rate (blastocysts/oocytes). P-values of mean comparisons are shown within the graph. (B) Development rate (blastocysts/cleaved embryos). Values are expressed as mean ± standard error of the mean (SEM). n = 8 replicates.

Development rate (n = 8 replicates) was not different when KSOM-FBS (40.79 ± 3.94%, 134/316, P = 0.07) and KSOM33 (39.93 ± 3.94%, 130/370, P = 0.09) groups were compared with the KSOM-Zero group (27.45 ± 3.94%, 96/323). Similarly, there was no statistically significant difference between the KSOM-FBS group and the KSOM33 group (P = 0.98; Figure 1B).
Analysis of metabolic activity
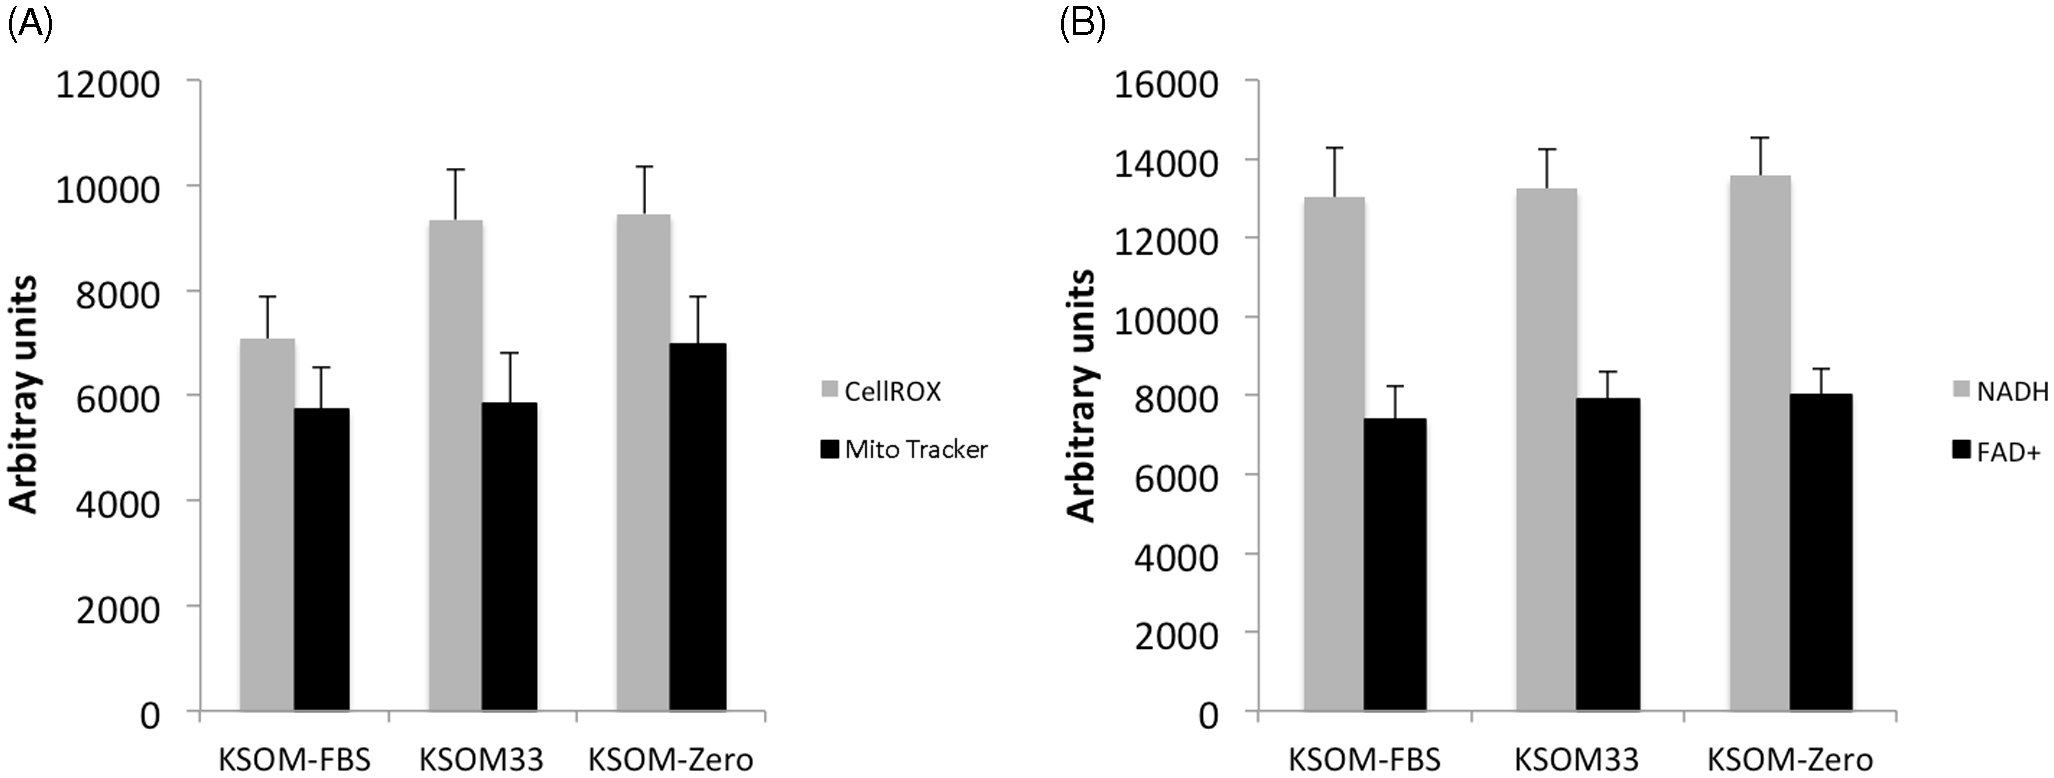
There was no significant difference in the production of reactive oxygen species (ROS), and there was also no statistical difference concerning the mitochondrial activity of the analyzed embryos from the different groups (n = 11–16 embryos per group), as verified with the CellROX Green and MitoTracker Red fluorescence intensities respectively (Figure 2A).
Quantitative image analysis of energy metabolism in the three experimental groups. (A) Measurement of mitochondrial activity using CellROX or MitoTracker. n = 16, 11 and 13 for KSOM-FBS, KSOM33 and KSOM-Zero groups, respectively. (B) Measurement of coenzymes NADH and FAD+ through autofluorescence. n = 8, 12 and 13 for KSOM-FBS, KSOM33 and KSOM-Zero groups, respectively. Values are expressed as mean ± standard error of the mean (SEM).

The results also did not show statistical differences in cellular energy production in the three groups (n = 8–13 embryos per group), demonstrated by the absence of statistical difference in autofluorescence for NADH and FAD+ (Figure 2B).
Differential cell count
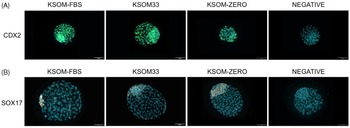
We collected embryos at 186 hpi and stained for CDX2 (Figure 3A) to determine TE, ICM, and total cell numbers (n = 8–13 embryos per group). KSOM-FBS and KSOM33 groups presented a higher number of TE cells and total cell number than the KSOM-Zero group (Table 1). No differences in the number of ICM cells or the ratio of TE/total cells were observed (Table 1).
Immunofluorescence of blastocysts from the three experimental groups. (A) Representative images of embryos stained for CDX2 (green). Nuclei are stained with Hoechst (blue). (B) Representative images of embryos stained for SOX17 (red). Nuclei are stained with Hoechst (blue). Scale bar equals 100 µm.

Cell count of CDX2-positive cells (TE), CDX2-negative cells (ICM), total cells after immunostaining of 186 hpi blastocysts. Different superscript letters within columns indicate significant statistical difference (P < 0.05). n = 13, 10 and 8 for KSOM-FBS, KSOM33 and KSOM-Zero groups respectively. Values are expressed as mean ± standard error of the mean (SEM)

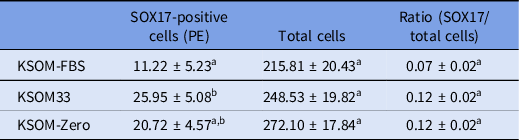
Next, we analyzed PE differentiation through SOX17 immunostaining (n = 16–21 embryos per group) in 210 hpi blastocysts (Figure 3B). Surprisingly, the KSOM33 group presented more SOX17-positive cells than the KSOM-FBS group, whereas the KSOM-Zero group was not different from other groups. No differences were observed regarding the number of total cells or the ratio between SOX17-positive cells and total cells (Table 2).
Cell count of SOX17-positive and total cells after immunostaining of 210 hpi blastocysts. Different superscript letters within columns indicate significant statistical difference (P < 0.05). n = 16, 17 and 21 for KSOM-FBS, KSOM33 and KSOM-Zero groups respectively. Values are expressed as mean ± standard error of the mean (SEM)

Discussion
The first objective of this study was to verify whether the absence of FBS during embryo culture would reduce blastocyst and development rates in our conditions. This study’s second and foremost objective was to evaluate whether FBS supplemented into embryo culture medium would have consequences on cell differentiation due to alterations in energy metabolism or the presence of growth factors present in the serum.
Three experimental groups were defined: 5% supplementation (v/v) with FBS (KSOM-FBS group), removal and refreshment of 33% of the medium volume (KSOM33), or without any supplementation (KSOM-Zero) at 90 hpi. The values observed for blastocyst rate showed that the absence of FBS reduced the blastocyst and development rates; however, this was not observed when there was a 33% renewal of the medium at 90 hpi. Half-renewal of culture medium reduced ROS and improved blastocyst formation during rabbit embryos in vitro culture (Wang et al., Reference Wang, Cao, Hu, Zhou, Wang, Alam, Qu and Liu2022). In addition, the renewal of medium can remove amino acid degradation products such as ammonium, which can impair embryo development (Gardner and Lane, Reference Gardner and Lane1993). Similar to our results, embryos cultured in synthetic oviduct fluid (SOF) in the absence of FBS presented reduced blastocyst formation (Van Langendonckt et al., Reference Van Langendonckt, Donnay, Schuurbiers, Auquier, Carolan, Massip and Dessy1997).
Cell count results showed that supplementation with FBS or medium renewal at 90 hpi increased the total number of cells compared with lack of supplementation. Corroborating our findings, a more significant amount of total cells was found in D7 blastocysts cultured with serum or BSA compared with non-supplemented medium (Lazzari et al., Reference Lazzari, Wrenzycki, Herrmann, Duchi, Kruip, Niemann and Galli2002). The increased total cell number in these groups could be related to an amplified activity of the pentose phosphate pathway, which generates ribose for DNA synthesis, which led to an increase in TE cell number within these same groups.
The increased proliferation of these cells could be due to the renewal of amino acids in the medium. Supplementation with essential and non-essential amino acids increased the numbers of total cells, ICM cells, and TE cells compared with supplementation with fewer amino acids during bovine embryo culture (Steeves and Gardner, Reference Steeves and Gardner1999; Lee et al., Reference Lee, Fukui, Lee, Lim and Hwang2004). In addition, it was shown that glucose and amino acids enhance the proliferation of porcine and ovine trophoblasts in vitro through activation of the mTOR pathway (Kim et al., Reference Kim, Burghardt, Wu, Johnson, Spencer and Bazer2011, Reference Kim, Song, Wu and Bazer2012), which was shown to be activated by glucose in mouse embryos (Chi et al., Reference Chi, Sharpley, Nagaraj, Roy and Banerjee2020).
Interestingly, even though TE cells were increased and the number of ICM cells was not statistically different, the ratio of TE:Total cells was not different, similar to that observed in a recent study that compared sequential medium with reduced concentrations of glucose and amino acids (Santos et al., Reference Santos, Fonseca Junior, Lima, Ispada, Silva and Milazzotto2021). Interestingly, in this referred study, medium that reduced 50% of nutrient concentration increased total and TE cells. Conversely, when all nutrients were reduced to 25%, the total, TE and ICM cell counts were diminished (Herrick et al., Reference Herrick, Rajput, Pasquariello, Ermisch, Santiquet, Schoolcraft and Krisher2020).
Contrary to our hypothesis, FBS supplementation decreased the number of PE cells, as observed by SOX17 staining, compared with KSOM replacement. In the mouse, FGF4 signalling through the ERK pathway is responsible for PE specification (Yamanaka et al., Reference Yamanaka, Lanner and Rossant2010; Kang et al., Reference Kang, Piliszek, Artus and Hadjantonakis2013), and similar results were observed in bovine embryos (Kuijk et al., Reference Kuijk, van Tol, van de Velde, Wubbolts, Welling, Geijsen and Roelen2012; Canizo et al., Reference Canizo, Ynsaurralde Rivolta, Vazquez Echegaray, Suvá, Alberio, Aller, Guberman, Salamone, Alberio and Alberio2019). FGF4 requires endogenous heparan sulfate for proper signalling (Lanner et al., Reference Lanner, Lee, Sohl, Holmborn, Yang, Wilbertz, Poellinger, Rossant and Farnebo2010), and heparin is often supplemented with FGF4 in exogenous treatments (Yamanaka et al., Reference Yamanaka, Lanner and Rossant2010; Kang et al., Reference Kang, Piliszek, Artus and Hadjantonakis2013). Therefore, if an excess of FGF was present after FBS supplementation, the lack of an excess of heparan sulfate or heparin might not have led to proper FGF4 signalling. However, as the serum is an undefined component, there could be several other possibilities to justify the decrease in SOX17-positive cells after FBS treatment; for example, the ERK pathway is inhibited by protein kinase B (Galetic et al., Reference Galetic, Maira, Andjelkovic and Hemmings2003), which can be activated by insulin or IGF signalling (Navarrete Santos et al., Reference Navarrete Santos, Ramin, Tonack and Fischer2008).
In conclusion, the results of this study confirm that it is possible to produce bovine blastocysts using KSOM medium without the use of FBS, as long as the replacement of 33% of the volume of the culture medium is performed at 90 hpi. It was also observed that the supplementation of FBS did not change the studied metabolic variables, but that the total and TE cell numbers were reduced when no supplementation with FBS or medium was added at 90 hpi, and FBS decreased PE cell number. In conclusion, FBS did not increase the number of TE or PE cells as hypothesized, but an absence of embryo feeding at 90 hpi negatively influenced the number of total cells or cells allocated to the TE.
Acknowledgements
This work was supported by the São Paulo State Research Foundation (FAPESP; grant 2017/09576–3). FAPESP provided additional financial support to FEL (2019/03014–9), CPC (2018/18924–8) and MDG (2017/25574–0). The authors would like to thank all members of the Laboratory of In Vitro Fertilization, Cloning, and Animal Transgenesis for technical support during the execution of this study.
Author contribution
Felipe Eduardo Luedke: Investigation, Writing – Original Draft, Visualization Caroline Pereira da Costa: Investigation. Camilla Mota Mendes: Investigation, Writing – Review and Editing. Thais Rose dos Santos Hamilton: Investigation, Formal analysis. Marcella Pecora Milazzotto: Conceptualization, Resources, Writing – Review and Editing, Mayra E.O.A. Assumpção: Resources, Writing – Review and Editing. Marcelo Demarchi Goissis: Conceptualization, Visualization, Formal Analysis, Supervision, Project Administration, Funding Acquisition, Writing – Review and Editing.
Competing interests
The authors declare no competing interests.