



1. Introduction
Solar flares are among the most energetic manifestations of solar activity, releasing vast amounts of energy in the solar atmosphere (see, e.g., Aschwanden Reference Aschwanden2006; Hudson Reference Hudson2011; Benz Reference Benz2017), with significant consequences for both space- and ground-based technologies (see, e.g., Fraley Reference Fraley2020; Pilipenko Reference Pilipenko2021). Their sudden onset can disrupt satellite operations, radio communications, Global Navigation Satellite System (GNSS) navigation, and even pose radiation risks to astronauts and high-latitude aviation (see, e.g., McManus et al. Reference McManus, Carr and Adams2011; Omatola & Okeme Reference Omatola and Okeme2012).
A primary operational challenge is near-term flare onset prediction (minutes of lead time), rather than hour-scale forecasting (see, e.g., Camporeale Reference Camporeale2019; Telikicherla et al. Reference Telikicherla, Woods and Schwab2024). While traditional forecasting methods rely on magnetic field evolution and active region classification to provide alerts on the order of hours to days, they cannot determine the precise onset of an individual flare (see, e.g., Barnes et al. Reference Barnes, Leka and Schrijver2016; Leka et al. Reference Leka, Park and Kusano2019a, b; Park et al. Reference Park, Leka and Kusano2020). In contrast, diagnostics in soft X-rays (SXR) and ultraviolet emission have revealed signatures of preflare heating in the minutes preceding the impulsive phase (Kane Reference Kane1974; Fární k & Savy 1998; Chifor et al. Reference Chifor, Tripathi, Mason and Dennis2007; Battaglia et al. Reference Battaglia, Fletcher and Benz2009; Hudson et al. Reference Hudson, Simões, Fletcher, Hayes and Hannah2020; Krista Reference Krista2025; Woods et al. Reference Woods, Dalda and De Pontieu2021).
Hudson et al. (Reference Hudson, Simões, Fletcher, Hayes and Hannah2020) described a pre-impulsive thermal buildup–minutes-scale increases in soft-X-ray temperature and emission measure (EM) preceding the onset of hard-X-ray emission. Hudson (Reference Hudson2025) proposed the Flare Anticipation Index (FAI) to provide an early warning of flare onset by quantifying preflare thermal activity in GOES soft-X-ray channels. Hudson (Reference Hudson2025) claims that this behavior makes the FAI a promising operational tool for real-time flare prediction, including weak events or cases that are difficult to classify using (for instance) magnetic-field evolution alone. These claims are based on a study of a sample of 20 flares that occurred over three days in January 2024.
In this work, we expand the reference sample proposed by Hudson (Reference Hudson2025) through a systematic validation of the FAI using nearly five decades of GOES soft X-ray observations (1980–2025). For this purpose, we selected 200 days evenly spaced between 1980 and 2025 and analyzed all flares that occurred on those days, calculating the FAI alerts for each day. Our objectives were: (i) to quantify the statistical performance of the FAI as a precursor diagnostic, (ii) to characterize its limitations, and (iii) to explore its potential as an operational tool for real-time flare prediction.
This paper is organized as follows. Section 2 (Data and Methods) describes the GOES/XRS data and preprocessing (2.1) and defines the Flare Anticipation Index and the evaluation procedure (2.2). Section 3 presents the statistical results. Section 4 discusses operational implications, limitations, and parameter sensitivities. Section 5 summarizes the main findings and outlines the next steps toward real-time deployment and future validation.
2. Data and Methods
2.1. GOES soft X-ray data
We analyzed GOES/XRS soft-X-ray observations in the 0.5–4 Å (XRS-A) and 1–8 Å (XRS-B) bands over 200 evenly spaced days between 1980 and 2025, sampling multiple GOES spacecraft and solar cycles. The sample days were selected uniformly in time to avoid clustering during high-activity years and to provide a representative mixture of flare and non-flare intervals.
We used GOES/XRS level-2 fluxes in physical units (W m
 $^{-2}$
). Datasets with sub-minute cadence were resampled to a uniform 1-minute resolution to ensure consistency across the full time range.
Background subtraction followed the approach described by Hudson (Reference Hudson2025). Specifically, the background X-ray emission was removed by computing a running difference between each data point and the value measured
 $\Delta t = 5$
minutes earlier. This simple differencing scheme effectively suppresses the slowly varying background while preserving short-term enhancements associated with preflare heating. The procedure was applied independently to both GOES channels (0.5–4 Å and 1–8 Å), producing detrended time series suitable for the computation of temperature, emission measure, and the Flare Anticipation Index (FAI).
We compute temperature T and emission measure EM from the two-channel ratio using the <monospace>sunkit-instruments</monospace> implementation, calling <monospace>calculate_temperature_em()</monospace>. Unless stated otherwise, we use the package defaults (isothermal assumption, coronal abundances, and the response functions appropriate for the spacecraft/epoch). The inversion is applied only when both channels exceed
 $10^{-9}$
W m
 $^{-2}$
to avoid ratio noise in very low signals; results are reported in MK for T and in units of
 $10^{49}$
cm
 $^{-3}$
for EM (
 $\mathrm{EM}_{49}$
).
For validation against flare occurrence and classification, we used the GOES event list peak times and classes (A/B/C/M/X). Each FAI alert was associated with the closest GOES flare peak occurring within the succeeding 30-minute window. In cases where multiple flares occurred within that interval, the nearest peak in time was used for the association.
After background subtraction and T/EM inversion, we retain only samples with positive flux in both channels, valid T and EM, and no quality flags. The resulting dataset is used for computing the FAI and for all summary statistics in this work.
2.2. Flare Anticipation Index (FAI)
The FAI combines normalized variations of temperature and emission measure, capturing the thermal energy buildup during hot onset precursor events (HOPEs). It can be computed in real time from GOES fluxes, providing a scalable diagnostic for preflare conditions. In this study, we used the same parameters as in Hudson (Reference Hudson2025)’s paper : integration time of 1 min, difference time
 $\Delta t = 5$
min for background subtraction, an initial value for EM increment of
 $0.005~\mathrm{EM}_{49}$
, and a temperature range of [7,14] MK. This article uses fixed values for the FAI parameters.
3. Results
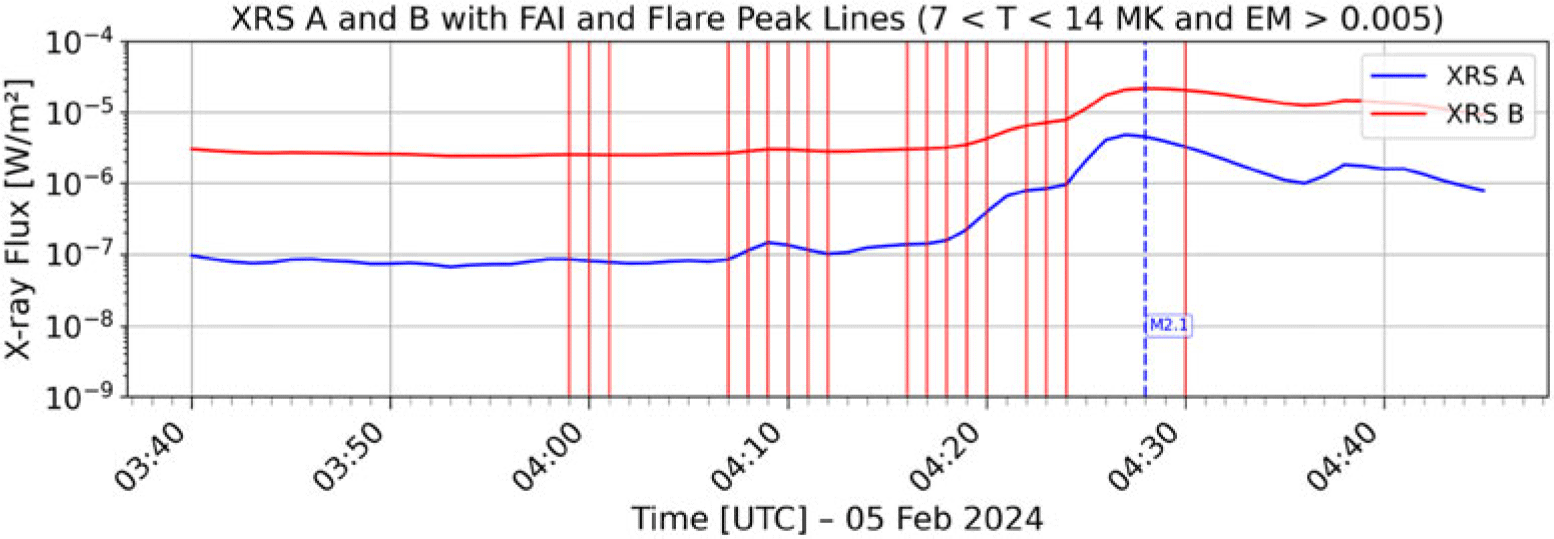
Figure 1 presents an example of one of the flares studied, SOL2024-02-05 (M2.1), for which the full procedure described in Section 2 was applied. FAI alerts detected by the algorithm are shown as red vertical lines, and the blue dashed line indicates the time of the flare peak. In this particular event, an FAI alert was recorded up to
 $\approx 29$
minutes before the peak, illustrating the operational potential of the index for flare nowcasting. For subsequent statistical evaluation, each FAI alert was associated with at most one flare: if at least one alert occurred within the 30-minute window prior to the peak, the flare was considered “associated.”
GOES/XRS soft-X-ray fluxes in the 0.5–4 Å (A; blue) and 1–8 Å (B; red) bands for the SOL20240205T0428_M2.1 flare. Vertical red lines mark FAI trigger times computed from GOES-derived temperature and emission measure satisfying
 $7<T<14~\mathrm{MK}$
and
 $\mathrm{EM}>0.005$
. The vertical blue dashed line marks the GOES peak time. Flux is in W m
 $^{-2}$
(log scale).

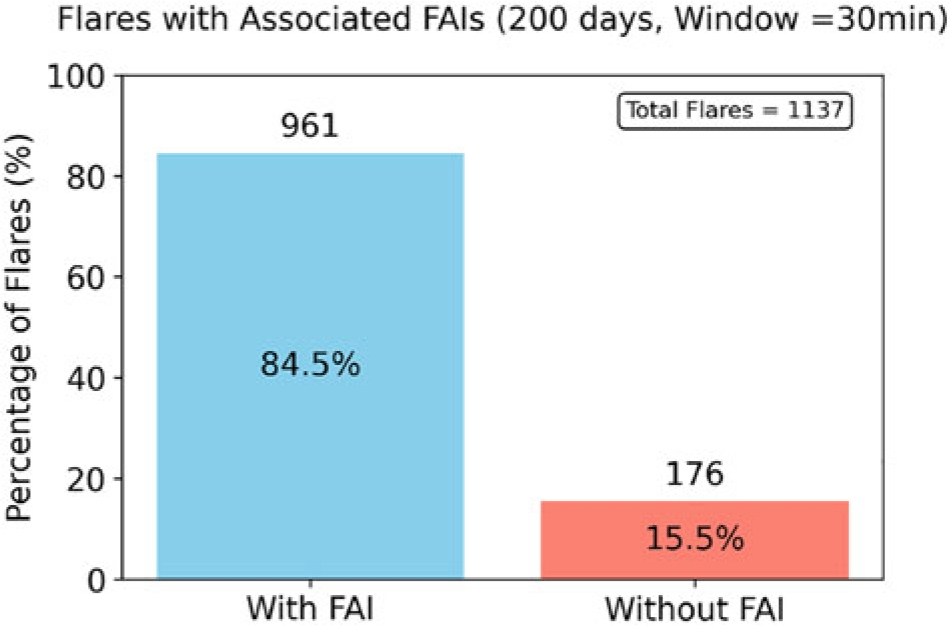
Figure 2 summarizes the fraction of flares (as listed by NOAA) that had at least one FAI alert within 30 minutes prior to their peak. Here, we define a detection (true positive, TP) as a “flare with
 $\ge 1$
FAI alert within a 30-minute window” and a false negative (FN) as a “flare with no alerts in that window.” Out of a total of 1137 flares analyzed, 84.5 % (
 $\approx 961$
) had at least one FAI alert before the peak, while 15.5 % (
 $\approx 176$
) had no alerts in that window. Therefore, from a forecasting perspective, the non-detection rate (FN) is non-negligible, and its dependence on flare class and analysis parameters should be further investigated.
Fraction of flares with at least one FAI alert in the
 $30\,\mathrm{min}$
interval preceding the GOES peak, evaluated over 200 days. Of 1,137 flares in the sample,
 $84.5\%$
(961/1,137) had an associated FAI alert and
 $15.5\%$
(176/1,137) did not. Percentages and counts are shown on the bars.

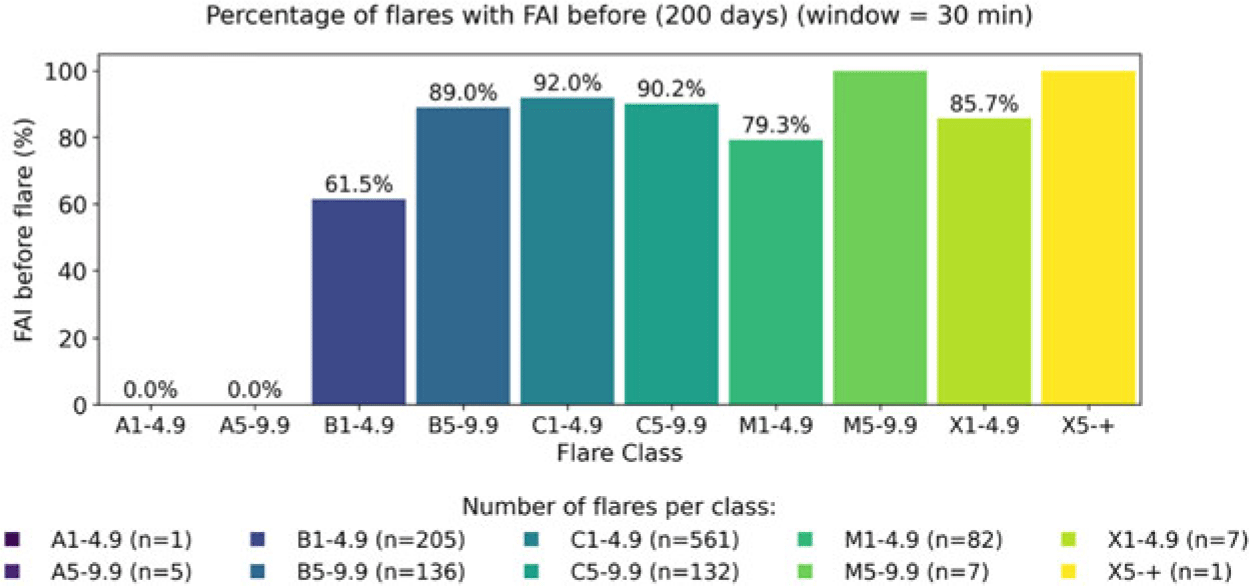
Figure 3 shows the fraction of flares in each subclass that received at least one FAI alert in the 30-minute window. A clear trend is observed: lower-energy classes (A and B) show a lower probability of exhibiting a prior FAI, whereas higher-energy classes (M, X) reach much higher probabilities. This energy dependence suggests that the index’s effectiveness increases with event magnitude–likely because thermal enhancements (T, EM) are more detectable in larger events–while in weaker events, the signal is closer to instrumental noise.
Fraction of flares with at least one FAI alert in the 30-min interval prior to the GOES peak, grouped by GOES class (bin labels on the x-axis). Percent values are annotated on the bars; sample counts for each bin are shown in the legend (e.g., C1-4.9:
 $n=561$
). Results are based on the 200-day sample used in this study. Note that the A-class bins have very small n, so their fractions are not statistically robust.

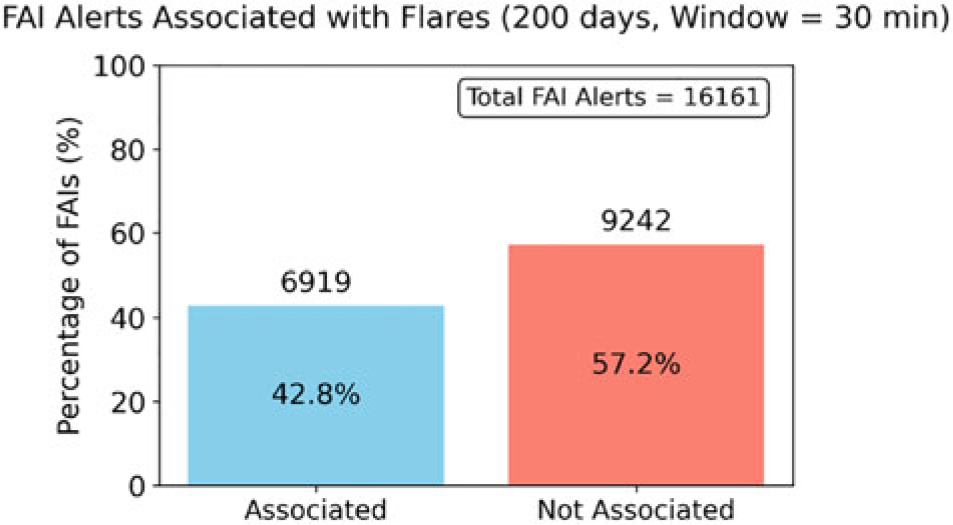
The analysis was also performed from the perspective of FAI alerts. Figure 4 shows the set of FAI alerts and whether they were associated with a flare within the 30-minute window following the alert. It can be seen that a significant portion of FAI alerts is not associated with a flare within 30 minutes after the alert. From an operational standpoint, these unassociated alerts are interpreted as potential false positives (FP)–that is, EM/T increases that trigger the FAI criterion but do not culminate in a flare within the considered window. Possible causes include non-flare transient heating, flares peaking outside the analyzed window, overlapping events, or instrumental/noise effects. Quantifying the FP rate = (unassociated FAIs)/(total FAIs) will be addressed in future work.
Association of FAI alerts with GOES flares over the 200-day sample using a 30-min association window (our matching rule). Of the 16,161 total alerts, 6,919 (
 $42.8\%$
) are associated with a flare and 9,242 (
 $57.2\%$
) are unassociated. Unassociated alerts are candidates for false positives, though some may reflect weak or unclassified activity.

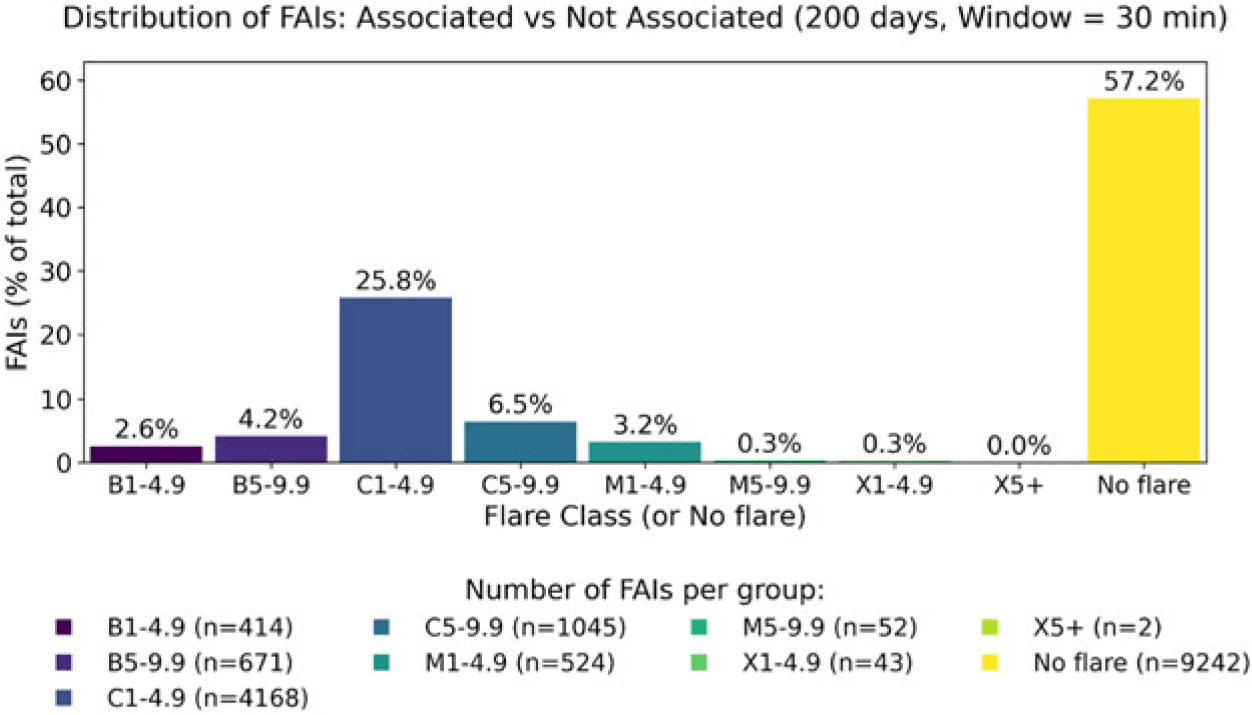
Figure 5 presents the distribution of FAI alerts associated with flares, separated by flare subclass. Most FAIs are associated with C-class flares, which may be due to the higher number of flares in this class compared to others.
Distribution of all FAI alerts by associated GOES flare class using a 30-min association window over the 200-day sample. For alerts matched to a flare, the bin reflects the flare’s GOES peak class (B1–4.9, B5–9.9, C1–4.9, C5–9.9, M1–4.9, M5–9.9, X1–4.9, X5+); “No flare” denotes unassociated alerts. Percent values are annotated on the bars; the legend lists the counts n for each bin. The largest share is unassociated (57.2%), with most associated alerts concentrated in the C-class bins. Bins with very small n (e.g., X5+) are not statistically robust.

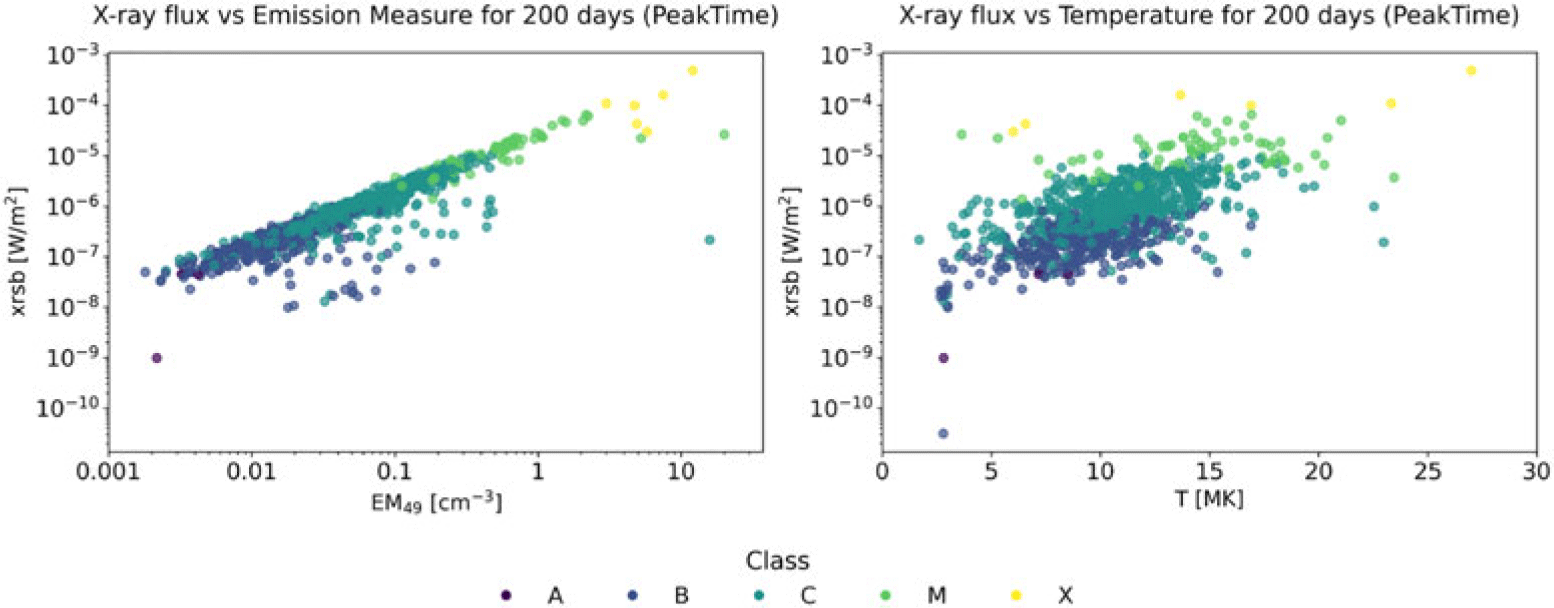
Finally, Figure 6 shows the relationship between GOES X-ray flux and derived parameters (temperature and emission measure). As expected, more energetic events are simultaneously hotter and have higher EM; this physical correlation supports the interpretation of FAI as a measure of thermal buildup prior to the impulsive peak. The consistency of this relationship reinforces the physical plausibility of the index, although, as discussed below, its practical application depends on threshold selection (in our case EM
 $>$
0.005 EM
 $_{49}$
and T in [7,14] MK) and the temporal window used.
Relationships between GOES/XRS 1–8 Å peak flux and derived thermal parameters at the flare peak for the 200-day sample. Left: flux vs. emission measure (EM
 $_{49}$
, in
 $10^{49}\,\mathrm{cm}^{-3}$
). Right: flux vs. temperature T (MK). Points are colored by GOES class (A–X). Flux and EM axes are logarithmic; T is linear. The tight flux–EM correlation and broader flux–T trend indicate that peak soft-X-ray flux is primarily set by EM, with temperature showing much less variability.

Overall, the results show that:
-
• FAI detects thermal increases prior to many large flares: sensitivity is high for M/X events (high detection fraction).
-
• For weak events (A/B), the probability of detecting a prior FAI decreases, likely due to signal-to-noise limitations and instrumental constraints.
-
• There are both false negatives (
 $\approx 15.5$
% of flares show no alerts within 30 min of the peak) and a notable number of FAI alerts not associated with listed flares in the window (potential false positives).
-
• Future improvements include adjusting thresholds, optimizing the temporal window, and refining one-to-one associations.

4. Discussion
The FAI is sensitive and reliable for anticipating medium and large flares (M/X-class). For smaller events, the signal is less clear due to instrumental limitations and signal-to-noise constraints.
Main challenges include:
-
• Identifying False positives: FAI increases not followed by a flare (possibly caused by weak transient heating or overlapping events).
-
• Identifying False negatives: flares without detectable anticipation, especially in lower classes.
-
• Parameter dependence: detection performance is affected by the temporal window, background subtraction method, and threshold selection.
The results demonstrate that the FAI is a sensitive tool for flare anticipation, particularly for major events, although its robustness depends on careful parameter selection and on its combination with other diagnostics.
5. Conclusions
The FAI reproduces and extends the existing HOPE results to a broader statistical sample. FAI shows strong promise for real-time operations in the case of large flares; however, limitations remain for weak events and in the handling of false positives. For weaker events, the uniformity of the NOAA flare listing is a serious problem. A-B class events may or may not be recognized, and there is a known problem of masking, whereby high quiescent flux levels reduce the probability of detection of weak events (e.g., Wheatland Reference Wheatland2010).
Beyond operational applications, our results provide physical insight into the preflare phase. The detection of systematic FAI increases supports the existence of gradual preheating in the corona, consistent with the HOPE scenario. This preheating likely reflects partial magnetic energy release prior to the impulsive onset, being more prominent in M/X-class events, while weaker flares may remain below instrumental sensitivity. In particular, the observed rise in emission measure indicates that denser and hotter plasma is already present before flare onset, reinforcing the interpretation of a gradual, partial energy release preceding the main impulsive phase. These findings highlight the need for magnetic reconnection models to explicitly account for this early stage of energy buildup and release (?).
Future steps include:
-
• Exploring sensitivity to parameter choices and temporal windows.
-
• Quantifying average anticipation times.
-
• Expanding the benchmark sample to include more days and evaluating the dependence of FAI performance on the quiet and active phases of the solar cycle.
Acknowledgements
We thank Astrid Veronig (University of Graz) for insightful comments and valuable discussions on the analysis and interpretation of GOES data. This work was supported by the Observatorio Astronómico Nacional, Universidad Nacional de Colombia. J.C. Buitrago-Casas was funded through NASA ECIP award 80NSSC23K1063.
 7
 EM>0.005
 −2
 30min
 84.5%
 15.5%
 n=561
 42.8%
 57.2%
 49
 1049cm−3


