Introduction
Dynamic climate variations during emergencies and disasters expose point-of-care (POC) and other emergency resources to environmental stresses that impact performance and durability.Reference Louie, Sumner and Belcher 1 – Reference Rust, Carlson and Nichols 11 Characterizing conditions during emergencies and disasters allows technology developers, operators, and emergency responders to understand the broad operational requirements of instruments and equipment. The goals of this paper were (1) to introduce a new mathematical method of modeling temperature-humidity conditions experienced in emergencies and disasters; (2) to validate the approach using recent disasters; and (3) to formulate recommendations on the safe and accurate use of POC resources.
Methods
Settings
Profiles were created for:
-
1. Banda Aceh, Indonesia, at the time of the 2004 tsunami [data collected from December 26, 2004 to January 25, 2005];
-
2. New Orleans, Louisiana USA, seven days before until 24 days after Hurricane Katrina made landfall in 2005 [data collected August 22, 2005 to September 21, 2005];
-
3. Springfield, Massachusetts USA, during the month of January 2009 [data collected January 1, 2009 to January 31, 2009], where paramedics observed glucose meter failures in cold ambient temperatures (12.8°C) as reported by Dr. James Nichols;Reference Rust, Carlson and Nichols 11
-
4. Port-au-Prince, Haiti, following the 2010 earthquake [data collected January 14, 2010 to February 13, 2010];
-
5. Sendai, Japan, after the 2011 earthquake and tsunami [data collected March 11, 2011 to April 10, 2011] with comparison to the colder month of January 2011 [data collected January 1, 2011 to January 31, 2011];
-
6. New York, New York USA, after Hurricane Sandy made landfall in 2012 [data collected October 29, 2012 to November 29, 2012]; and
-
7. a 24-hour rescue from Hawaii USA to the Marshall Islands (and back) applicable to future emergency rescue episodes [data collected January 1, 1973 to October 30, 2011].
Modeling Procedure
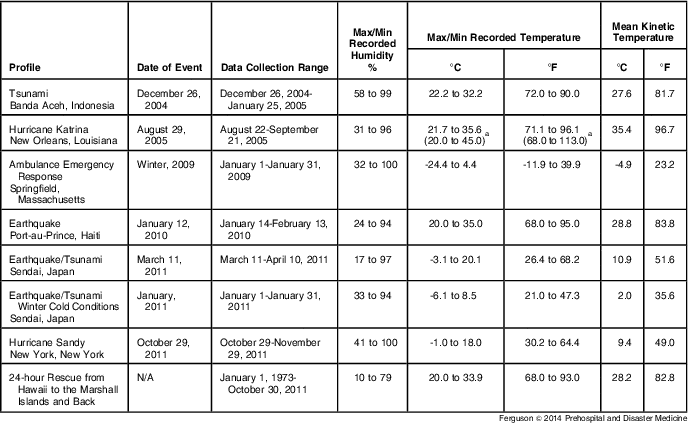
Table 1 defines the events, durations of the profile generation, and climate ranges. Data from the National Climatic Data Center (Asheville, North Carolina USA) was obtained for the weather station closest to the site of each disaster. Temperature and humidity closest to each hour were selected within the time frame of 30 minutes before to 29 minutes after each hour. Then the median hourly temperature and humidity covering the temporal period of the event were adjusted to encompass the highest and lowest National Climatic Data Center values, so as to better simulate realistic climatic extremes during the diurnal time course of each profile.
Emergency and Disaster Profiles

aChanged to anecdotal temperatures observed inside hospitals.Reference Klein and Nagel 12 , Reference Kline 13
For New Orleans, high and low temperatures of 45°C and 20°C, respectively, were used to simulate observed temperatures actually reported inside hospitals.Reference Klein and Nagel 12 , Reference Kline 13 For Banda Aceh, the profile used 3-hour medians from four different weather stations, because of lack of complete surface meteorological records for those stations. A temperature of 999.9 or humidity of 999 indicates errors in the meteorological measurements; these points were therefore removed.Reference Delamatar, Finley and Babcock 14 Temperatures then were checked against surrounding temporal recorded values and removed if a change greater than 5°C occurred within one hour. Such a disparity was considered indicative of measurement errors.
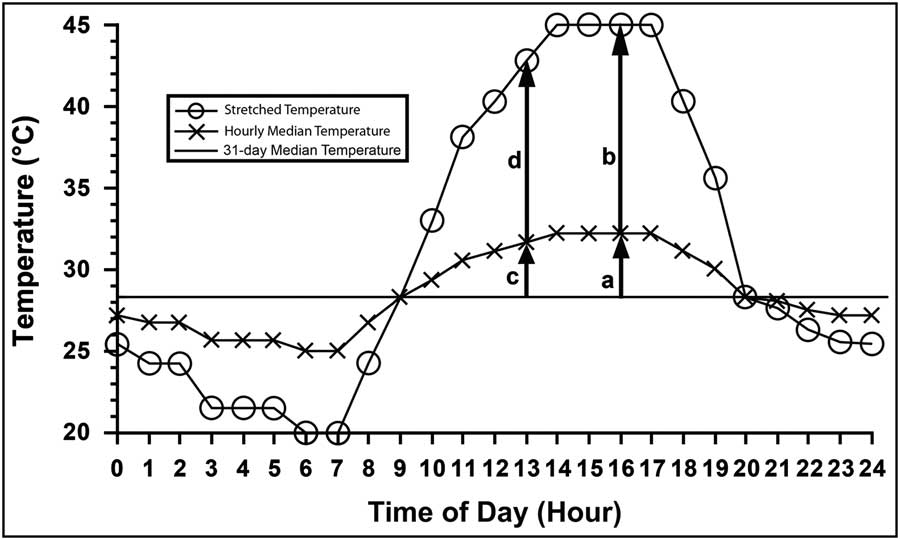
Using the diurnal temperature profile for New Orleans, Figure 1 illustrates the proportional stretching method for hourly medians determined with the following equation:
Stretching algorithm for temperature and humidity, illustrated for Hurricane Katrina. The stretched median hourly curve reflects highs and lows while following proportionally the median temperatures reported. See text and Eq. 1 for details of a, b, c, and d.

 $${\it d} = {{\it bc} \over \it a}$\eqno\rm Eq. \ {1}$$
where a is highest hourly median temperature minus the overall hourly median, b is the highest temperature minus the highest hourly median, c is the hourly median temperature to be stretched minus the overall median, and d is the median temperature minus the hourly median for the point that is stretched. Profiles were programmed using MatLab (MathWorks, Natick, Massachusetts USA). Stretching the median hourly conditions to the extremes observed was intended to reflect better the high and low temperature and humidity conditions experienced during the events.
Simulation of a Pacific Rescue Response
A profile was created simulating an emergency rescue response from Hawaii to the Marshall Islands and back using a combination of temperature stretching and flight conditions. Data were collected from the years of 1973 to 2011 from one station on Ebeye, an island in the Marshall Islands. Flight to and from Hawaii to Ebeye and a 12-hour ground rescue was simulated. Flight times were obtained from a commercial airline that travels to and from the locations, then rounded up to the next hour. 15 The time of ascent and descent was estimated to be a half hour. Humidity of 10% was used during flights to simulate conditions experienced inside the cabin.Reference Thibeault 16 The land response for Ebeye encompassed the hottest portion of the day using the stretching methodology described above from the times of 8 am to 8 pm. To simulate very humid conditions, median hourly humidity data were used instead of the stretched, lowered values.
Mean Kinetic Temperature
Mean kinetic temperature is a simplified way of expressing the overall temperature impact on first-order chemical reactions. Mean kinetic temperature weights the effects of temperature variations over an extended period of time according to the following equation:
 $$${\rm MKT}\,{\rm = }\,\displaystyle{{\rDelta E\,/\,R} \over {{\rm - In}\left( {{{{\rm e}\left( {{{\rDelta {\rm E}} \over {{\rm RT}_{{\rm 1}} }}} \right)\, + \,e\left( {{{\rDelta E} \over {{\rm RT}_{{\rm 2}} }}} \right)\, + \, \ldots \, + \,e\left( {{{\rDelta E} \over {RT_{n} }}} \right)} \over n}} \right)}}$\eqno\rm Eq.\ 2$$
where ΔE is the heat of activation, 83.144 kJ mole−1; R is the universal gas constant, 8.4144·10−3·mole−1·Kelvin−1; Tn is the average temperature (Kelvin) in the measurement interval (usually an hour); n is number of average temperatures being considered, taken at equal intervals.Reference Taylor 17 , Reference Bott and Oliveira 18 For example, a temperature-sensitive reagent of device exposed to temperatures of 20°C for one hour, 30°C for the next hour, and 45°C for the final hour, (n = 3) is equivalent to a MKT of 36.8°C, that is, a thermal exposure of 36.8°C for three hours. To convert from Celsius to Kelvin, Celsius + 273.15 = Kelvin.
Profile Validation
To validate stretched profiles, 10 days were randomly selected from the data set used to generate each profile and then it was determined whether (1) any temperature and humidity points exceeded or were lower than the stretched profile, and (2) daily variations were correctly encompassed by the stretched profile. The profile from Hawaii to the Marshall Islands was validated by having an expert who performed actual rescues review the pattern for authenticity based on field experience.
Results
Disaster Events
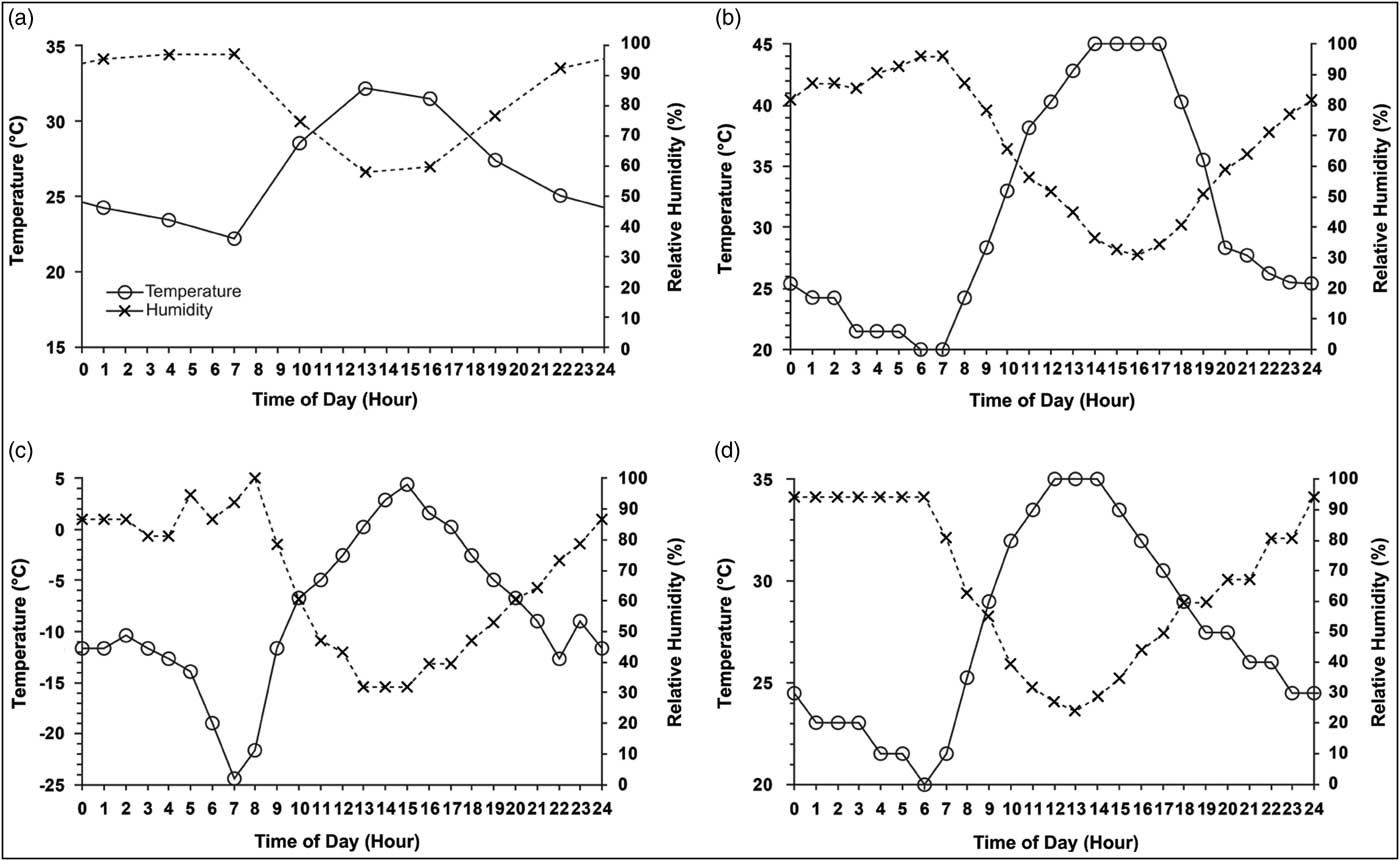
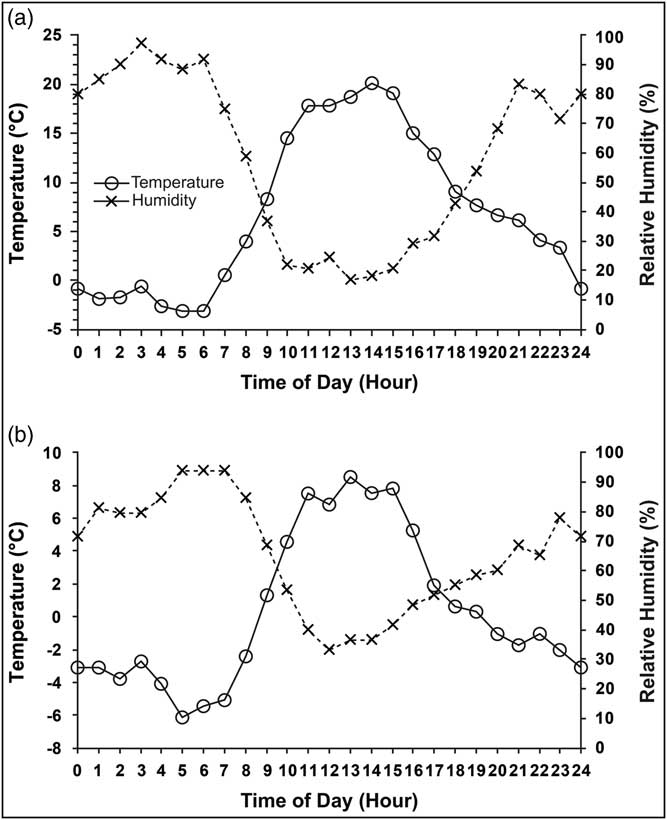
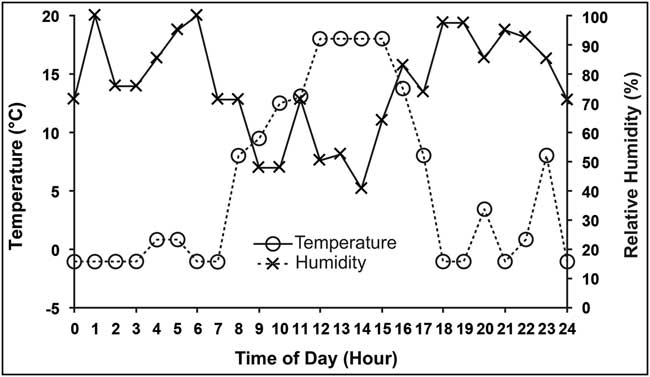
Table 1 shows the parameters and calculated MKT for each profile. Figure 2a shows the profile created for the 2004 Tsunami in Banda Aceh, Indonesia where temperatures ranged from 22.2°C to 32.2°C, humidity from 58% to 99%, and MKT was 27.6°C. Figure 2b shows the profile created for New Orleans, Louisiana USA during Hurricane Katrina where temperatures ranged from 20°C to 45°C, humidity from 31% to 96%, and MKT was 35.4°C. Figure 2c shows the profile created for the month of January 2009 in Springfield, Massachusetts USA where temperatures range from −24°C to 4.4°C, humidity from 32% to 100%, and MKT was −4.9°C. Figure 2d shows the profile for Port-au-Prince, Haiti following the 2010 earthquake where temperature ranges from 20°C to 35°C, humidity from 24% to 94%, and MKT was 28.8°C. Figure 3a shows the profile after the 2011 earthquake and tsunami in Sendai, Japan, where temperatures range from −3.1°C to 20.1°C, humidity from 17% to 97%, and MKT was 10.9°C. Figure 3b, the profile created for the month of January 2011, to demonstrate environmental conditions, had the earthquake occurred during a colder month of that year. Temperatures ranged from −6.1°C to 8.5°C, humidity from 33% to 94%, and MKT was 2.0°C. Figure 4, the profile created for Hurricane Sandy after it made landfall, had a temperature range from -1 to 18°C, humidity range of 41 to 100%, and MKT was 9.4°C.
Disaster and emergency profiles. Stretched profiles generated for Banda Aceh, Indonesia (Frame a); New Orleans, Louisiana USA (b); Springfield, Massachusetts USA (c); and Port-au-Prince, Haiti (d) appear similar, but fall within different temperature ranges shown by the vertical axes. The profiles show a wide range of potential climates that POC devices, reagents, and other resources must endure in order to perform well during disaster responses.

Japan during the earthquake/tsunami and during a colder month. Profiles for Sendai, Japan, after the 2011 earthquake and tsunami (Frame a) and the month of January (b) demonstrate actual (a) and potentially worse conditions (b), had the earthquake occurred during the colder month. Temperatures during the month of January of -6.1°C to 8.5°C are cooler than the range of -3.1°C to 20.1°C during earthquake time period.

Temperature and Relative Humidity Profile for New York After Hurricane Sandy Made Landfall.

Hawaii USA—Marshall Islands Rescue
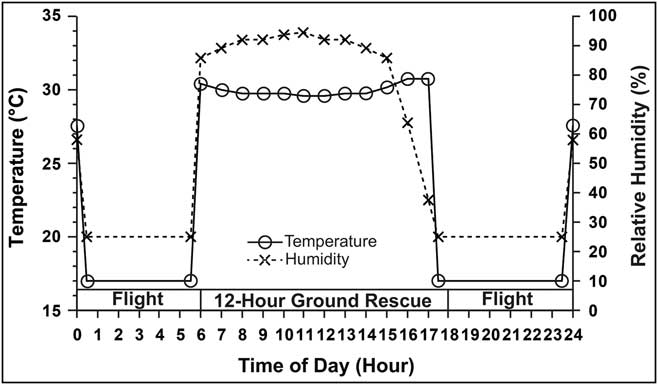
Figure 5 shows the profile created for the Marshal Islands rescue where the six hour flight temperature was 20°C and humidity, 10%, with on-ground rescue conditions of temperatures ranging from 22.5°C to 33.9°C and humidity ranging from 73% to 79%. The MKT was 28.2°C (82.8°F).
Twenty-four hour simulated flight and rescue from Hawaii USA to the Marshall Islands and back. The 24-hour simulated rescue operation from Hawaii to the Marshall Island and back demonstrates the adaptability of dynamic profiling to customize individual rescue operations, and therefore to anticipate conditions and enhance preparedness.

Profile Validation
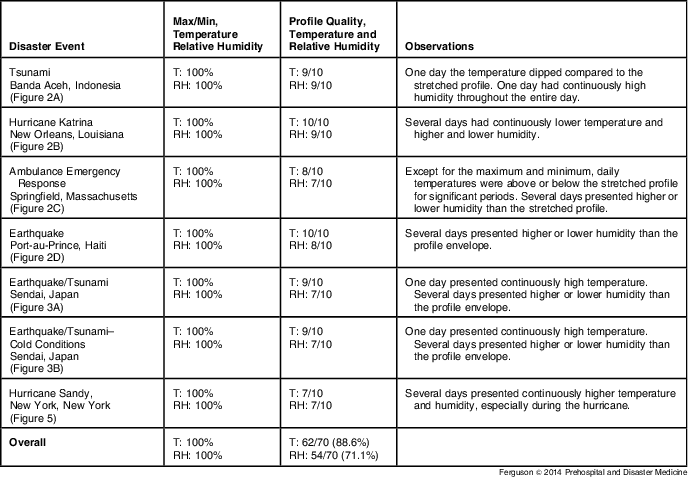
Table 2 compares 10 randomly selected days to the stretched profile. Daily temperature and humidity never exceeded or went below the stretched profile. Daily temperature variations were represented very well by the stretched profiles with 88.6% (62/70) falling within the envelope. Humidity was represented well by the stretched profile with 71.1% (54/70) relative humidity falling within envelope. The days that were not represented well had primarily higher continuous humidity conditions throughout the day.
Validation of Profiles

Discussion
Novel environmental profiles were created that can be used to understand challenges encountered during disaster and emergency responses. Figures 2–5 illustrate a wide variety of austere conditions in which medical diagnostic and monitoring devices should be prepared to perform well. Simulating real temperature and humidity variations makes clear the operational difficulties that users of POC instruments, reagents, and other disaster resources (eg, drugs) may encounter. Use of observed maximum and minimum temperature and humidity occurring during the events (Table 1) assures that the profiles reasonably reflect extremes that can occur.
Between 1980 and 2010, the United States experienced 640 disaster events. Of those events, 64.5% (413/640) were weather-related. 19 Deaths associated with weather-related events account for 87.8% of all disaster deaths. 19 This evidence shows that if it is to fulfill its role, POC testing must be able to function in situations where austere weather conditions are the cause of the community distress. The approach can be used to prepare disaster response by planners and POC users well in advance of heading to sites of complex emergencies and disasters.
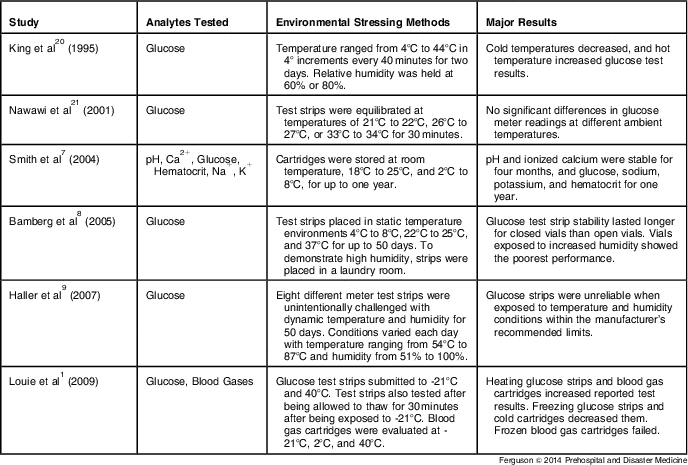
Table 3 summarizes the key findings of past environmental robustness studies.Reference Louie, Sumner and Belcher 1 , Reference Smith, Davis-Street and Calkins 7 – Reference Haller, Shuster and Schatz 9 , Reference King, Eigenmann and Colagiuri 20 , Reference Nawawi, Sazali and Kamuruzaman 21 Although most results confirm that temperature and humidity play a role in performance, investigators did not address dynamic changes.Reference Smith, Davis-Street and Calkins 7 – Reference Haller, Shuster and Schatz 9 , Reference King, Eigenmann and Colagiuri 20 In order to understand the effect of temperature and humidity on POC stability, studies should incorporate dynamic profiles that simulate conditions based on actual measured meteorological conditions.
POC Testing Environmental Stress Studies

Abbreviations: Ca2+, calcium; K+, potassium; Na+, sodium; POC, point of care.
Profiles also can be used to project potential conditions that may be experienced. For example, while Figure 3A reflects cold conditions that occurred after the earthquake and resulting tsunami in Sendai, Japan, Figure 3B shows potential conditions had the earthquake occurred during a colder month. 22 Since disaster effects often can be compounded by potential extreme climatic events, this approach can be adopted to simulate other environmental conditions and provide insights on robustness necessary in specific regions.
Profiles also can be generated for specific rescue simulations. Figure 5 simulates a 24-hour air rescue. Combining the diurnal dynamic profile of on-ground rescue conditions with simulated flight conditions allows one to evaluate the rescue event as a whole. This strategy allows one to understand more accurately the individual needs of specific rescue operations. Other rescue scenarios that could be evaluated include ambulance, short distance open-air helicopter, and boat-based operations.
Profile validation assured the ability of stretching to accurately model daily conditions and demonstrated that profiles encompassed the highest and lowest temperature and humidity observed while maintaining the general pattern of the daily variations. Daily humidity variations were less well represented by the stretched profile than temperature (Table 2). Humidity is more sporadic and less easily simplified into a 24-hour diurnal profile, but the humidity profiles generally reflected field conditions, and POC resources must be protected from moisture.
Investigators have explored methods of protecting POC from austere conditions.Reference Vanholder, Borniche and Claus 10 , Reference Herr, Newton and Santhrach 23 – Reference Serio, Petronelli and Sammartino 25 Emergency response teams have reported limited success with insulating containers and other means of heating or cooling devices. For example in Haiti, emergency medical response teams were unable to use handheld i-STAT whole-blood analyzers when ambient temperatures exceeded 35°C. One team designed an insulated box using cardboard, polystyrene, and an ice pack that allowed use of the i-STAT for 15-20 minutes before overheating occurred again.Reference Vanholder, Borniche and Claus 10 Rust et al have designed an active battery powered container that protect from cold conditions. 26
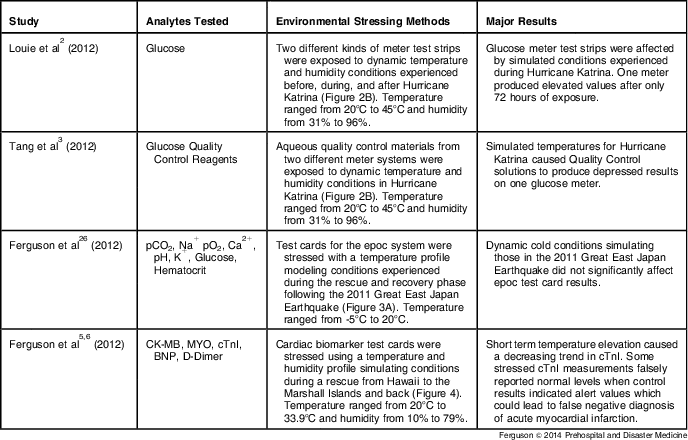
Dynamic profiles provide a useful means to test (Table 4) the effectiveness of these approaches before implementation in an actual emergency event.Reference Louie, Ferguson and Sumner 2 , Reference Tang, Ferguson and Louie 3 , Reference Ferguson, Louie and Curtis 5 , Reference Louie, Ferguson and Curtis 6 , Reference Ferguson, Vy and Louie 27 Another potential application of profiling is determining drug or vaccine stability in austere environments. Several studies have shown thermal effects accelerate drug degradation.Reference Valenzuela, Criss and Hammargren 28 – Reference Grant, Carrol and Church 31 In 2008, Gammon et al found that temperature stresses led to significant decreases in drug concentrations in eight pharmaceuticals, including lidocaine, dopamine, and nitroglycerine, commonly carried by emergency medical service teams. Reference Gammon, Su and Jordan 30 These drug degradation studies do not evaluate drug stability using environmental conditions taken from disaster events. Reference Valenzuela, Criss and Hammargren 28 – Reference Grant, Carrol and Church 31 Thus, profiling should be used to evaluate drug degradation using conditions experienced in actual emergency and disaster events.
Dynamic POC Testing Environmental Stress Studies

Abbreviations: BNP, B-type natriuretic peptide; Ca2+, calcium; CK-MB, creatine-kinase MB isoform; cTnI, cardiac troponin I; K+, potassium; MYO, myoglobin; Na+, sodium; pCO2, partial pressure of carbon dioxide; pO2, partial pressure of oxygen; POC, point of care.
Mean kinetic temperature helps evaluate cumulative thermal stress experienced over a period of time and is designed to weight high temperature excursions more than low based on the assumption of simple first-order chemical kinetics. Although the weighting may be appropriate for the evaluation for drug degradation, a recent study showed that cold temperatures can be harmful to POC as well.Reference Louie, Sumner and Belcher 1 Additionally, humidity is not accounted for as a potential source of stress, where drying or premature activation of moisture barriers could threaten stability. Also, when exposed to direct solar radiation, POC devices, reagents, and their containers can experience heat loads (therefore surface temperatures) far exceeding reported daily air temperatures. Although MKT is useful for evaluating high temperature stress, accurate evaluation of all potential sources of stress is necessary to ensure proper protection of POC supplies.
Limitations
The limitation of this stretching method is that certain disasters may not occur in predictable environmental conditions; thus it is difficult to understand what temperature and humidity will be encountered. This method will provide a basis for users to understand the environmental conditions that first responders have experienced in the past, and insure understanding of the limitations of POC equipment use.
Conclusions and Recommendations
Environmental stress profiling will help technology developers and device operators assess whether existing and new POC instruments and reagents are accurate and effective in conditions experienced during complex emergencies, rescue operations, and disasters. Using temperature and humidity profiles to improve the robustness of in vitro diagnostics and pharmaceutical supplies will improve standards for licensing products. Therefore, the following is recommended:
-
1. Dynamic environmental stresses should be used to evaluate POC system performance, reagent stability, drug stability, vaccine viability, and protective containers.
-
2. Disaster standards addressing environmental robustness should include dynamic environmental challenges and simulations based on real-world conditions present during emergencies and disasters.
-
3. Research is needed to develop new methods of evaluating the cumulative effects of dynamic temperatures and humidity, similar to using mean kinetic temperature but more effectively dealing with possible low temperature extremes.
-
4. Research also can be designed to develop simple products (eg, insulated containers) that will protect POC devices and reagents from climate extremes.
-
5. Evidence can be gathered to more accurately and directly determine temperature and humidity extremes experienced by POC devices and reagents by placing long-term sensors with the devices and reagents.
-
6. Moisture barriers can be incorporated into devices, reagents, drugs, and other resources for their protection from high humidity.
-
7. Environmental stresses that could accelerate POC technologies failure, such as exposure to solar radiation, should be considered.
Acknowledgements and Disclaimer
The authors thank Dr. Elizabeth Char for assisting with the Marshall Island rescue profile. They are also grateful to the members of their Meteorological Advisory Board, for suggestions and critique on the dynamic modeling method. The authors thank Stephanie Sumner for her assistance and Nick Warnock for help with Matlab programming. The content is solely the responsibility of the authors and does not necessarily represent the official views of NIBIB or the National Institutes of Health. Tables and figures were provided courtesy and permission of Knowledge Optimization, Davis, California USA.