


INTRODUCTION
In an era of unabated growth in economic inequality in the United States spanning roughly 50 years (Solt Reference Solt2020), a large and growing body of scholarship strives to understand the politics of redistribution in America and to grasp the factors that augment or erode Americans’ support for redistributive policies (Alesina and La Ferrara Reference Alesina and La Ferrara2005; Condon and Wichowsky Reference Condon and Wichowsky2020; Culpepper et al. Reference Culpepper, Shandler, Jung and Lee2025; Edlund Reference Edlund1999; Kelly and Enns Reference Kelly and Enns2010; Kluegel and Smith Reference Kluegel and Smith1986; McCall Reference McCall2013; Peyton Reference Peyton2020; Piston Reference Piston2018). One consistent finding in this literature concerns the exercise of economic self-interest and the tendency of lower-income individuals to favor government redistribution more than those with higher incomes (Alesina and La Ferrara Reference Alesina and La Ferrara2005; Culpepper et al. Reference Culpepper, Shandler, Jung and Lee2025; Doherty, Gerber, and Green Reference Doherty, Gerber and Green2006; Edlund Reference Edlund1999; Fong Reference Fong2001; Kluegel and Smith Reference Kluegel and Smith1986; Newman, Reny, and Ooi Reference Newman, Reny and Ooi2022; Piston Reference Piston2018). This finding aligns with long-standing theory contending that voters are capable of engaging in rational calculations of their material interests and arriving at policy preferences that maximize such interests (Chong Reference Chong, Huddy, Sears, Levy and McDermott2023).
Surprisingly, our accumulating scientific knowledge about public support for redistribution—both in the United States and abroad—is largely based on the preferences people report during their brief time taking surveys in person, over the telephone, or online (i.e., “reported preferences”). In other words, what we think we know about mass preferences on redistribution is based near-exclusively on the responses given by people in the fleeting and artificial context of survey response. The vast majority of published studies measure support for redistribution in the abstract by relying on the response of survey-takers to statements, such as “The government should take measures to reduce differences in income levels” (Finseraas Reference Finseraas2009; Rueda and Stegmueller Reference Rueda and Stegmueller2016; Schmidt-Catran Reference Schmidt-Catran2016) and “Do you think it should be the government’s responsibility to reduce income differences between the rich and poor?” (Alt and Iversen Reference Alt and Iversen2017). While a few studies go beyond measuring abstract support by soliciting preferences over concrete state-level redistributive policy proposals (Boudreau and MacKenzie Reference Boudreau and MacKenzie2018; Franko, Tolbert, and Witko Reference Franko, Tolbert and Witko2013; Newman and Teten Reference Newman and Teten2021; Tolbert, Witko, and Wolbers Reference Tolbert, Witko and Wolbers2019), these studies nevertheless rely on reported preferences and do not retrieve election results data to analyze actual voting on these proposals. Studies using experimental economic games measure subjects’ redistribution of artificial monetary units (e.g., points or tokens), or relatively small sums of actual money, with other players in small group settings (Lekfuangfu, Powdthavee, and Riyanto Reference Lekfuangfu, Powdthavee and Riyanto2023; Wiese et al. Reference Wiese, Powdthavee, Yeo and Riyanto2025). While behavioral in nature, it is unclear if or how these game-bound behaviors conceptually or empirically relate to behavioral support for government redistribution.
In the end, the literature’s heavy reliance on reported preferences begs the question of whether key patterns of opinion formation on redistribution, such as the established role of economic self-interest, would manifest when analyzing real-world choices (i.e., “revealed preferences”). It is well known that the preferences people report in surveys to researchers may deviate from their actual preferences (Beshears et al. Reference Beshears, Choi, Laibson and Madrian2008) or subsequent behavior (Couture and Dooley Reference Couture and Dooley1981; Wardman Reference Wardman1988), which is why economists studying consumer behavior generally prefer to use choices observed in the marketplace to test theory and build knowledge. The distinction between reported preferences and actual behavior was made salient in the foundational study by LaPiere (Reference LaPiere1934), who found that the reported preference of hotel and restaurant proprietors to refuse service to Chinese persons was almost never fulfilled when confronted with an actual Chinese patron. This study highlighted that the attitudes people report may not predict their behavior, leading to an extensive literature focused on understanding attitude–behavior discrepancies (Bechler, Tormala, and Rucker Reference Bechler, Tormala and Rucker2021). Reported preferences typically suffer from “hypothetical bias” (Murphy et al. Reference Murphy, Geoffrey Allen, Stevens and Weatherhead2005), where survey-takers overstate their preferences over a particular set of choices in hypothetical settings where endorsed actions, outcomes, or policies are nonbinding in the real world. The tendency for people to overstate their preferences is theorized to partially derive from their desire to have a positive self-image, maintain their “moral credentials,” and demonstrate social responsibility (De Corte, Cairns, and Grieve Reference De Corte, Cairns and Grieve2021; Monin and Miller Reference Monin and Miller2001). Put succinctly, endorsing redistribution in the abstract in a survey may not translate into costlier forms of behavioral support for concrete redistributive policies. Moreover, observed economic self-interest effects may be confined to reported abstract policy support and not manifest when analyzing actual voting on redistribution.
These possibilities are bolstered by several findings in the literature. First, Margalit and Raviv (Reference Margalit and Raviv2024) find that, when asked to describe the government actions Americans think of when responding to the commonly-asked “government should reduce income differences between rich and poor” survey question, only small percentages selected taxing the rich to spend on the poor. Instead, these authors find that roughly 40% of respondents endorsed abstract reduction of income differences without any concrete policy actions in mind.Footnote 1 Second, Americans tend to endorse equality and social welfare provision in the abstract while resisting concrete government policies that promote these ends (Gilens Reference Gilens2009; McClosky and Zaller Reference McClosky and Zaller1984). This disconnect between abstract and concrete support has been attributed to ambivalence deriving from holding countervailing humanitarian and individualistic values (Feldman and Zaller Reference Feldman and Zaller1992), as well as belief in agency-based and structural explanations for wealth and poverty (Bartels Reference Bartels2016; Kluegel and Smith Reference Kluegel and Smith1986), which have opposing relationships to support for redistribution (Alesina and La Ferrara Reference Alesina and La Ferrara2005; Fong Reference Fong2001; Kluegel and Smith Reference Kluegel and Smith1986; McCall Reference McCall2013). Race and prejudice are also relevant factors, as considerations of race may be less operative in abstract endorsement of government “reducing income differences” than with support for concrete redistributive programs benefiting stigmatized minorities (Gilens Reference Gilens2009) and visible populations of non-white “have-nots” (Newman, Reny, and Ooi Reference Newman, Reny and Ooi2022).
Third, reported preferences for redistribution may not translate to revealed behavioral support due to the potential complexity of real-world policy proposals and voters’ lack of complete information or understanding leading to decision errors (Beshears et al. Reference Beshears, Choi, Laibson and Madrian2008) or the enactment of “unenlightened” self-interest (Bartels Reference Bartels2016).Footnote 2 These possibilities are accompanied by evidence that Americans misperceive the factors that shape their own support for redistribution. Kane and Newman (Reference Kane and Newman2023) document that Americans believe that the amount and sources of income of the wealthy are important determinants of their desire to impose heavier taxes on the rich when, in fact, they play a modest or insignificant role. Trump (Reference Trump2025) uncovers a similar inconsistency related to work ethic, as Americans say that hard work is an important attribute of a rich person who deserves their wealth but then do not drastically increase their support for taxing rich people who do not work hard. Last but not least, the campaign and media environment surrounding real-world redistributive policies may erode the exercise of economic self-interest and heighten voters’ susceptibility to engaging in “unenlightened” self-interest by activating distrust in government and aversion to taxation (Barton and Piston Reference Barton and Piston2022).
Taken together, this work highlights the uncertain external validity of findings relying on reported preferences and the potentially precarious nature of knowledge built on reported preferences. Put simply, Americans may seem economically self-interested on redistribution when taking brief pauses out of their day to respond to a survey, but may not follow through to actually vote their reported preference on redistribution when given the chance. And, if given the chance to vote directly on redistribution, myriad factors may stymie the exercise of economic self-interest. At present, there is a paucity of research offering a dedicated analysis of revealed preferences (e.g., vote choices) over real-world redistributive policies. Nations and subnational governmental units with direct democracy offer an important opportunity to observe voting directly on economic policies. Surprisingly, only a few studies analyze voting on redistributive referendum or ballot initiatives, and each of these has important limitations in terms of testing for economic self-interest.
In the American subnational context, most of the published work analyzing election returns data on state and local ballot measures focuses on proposals to fund public works projects or social programs with bonds (Altonji, Lang, and Puggioni Reference Altonji, Lang and Puggioni2016; Bowler and Donovan Reference Bowler and Donovan1994; Brunner, Robbins, and Simonsen Reference Brunner, Robbins and Simonsen2018; Brunner, Ross, and Washington Reference Brunner, Ross and Washington2011; Hankinson, Magazinnik, and Sands Reference Hankinson, Magazinnik and Sands2026; Zimmer et al. Reference Zimmer, Buddin, Jones and Liu2011) or sales taxes (Laniyonu and Byerly Reference Laniyonu and Byerly2021) as compared to tax increases on high-income earners.Footnote 3 An innovative field experiment by Sands (Reference Sands2017) observed whether subjects signed a petition to place a redistributive measure on the Massachusetts state ballot in an upcoming election. While constituting a behavioral measure of support for redistribution, this outcome captures support during the petition drive for putting redistribution on the ballot rather than a “Yes” vote to adopt the policy. Moreover, while estimating subject-level covariates (e.g., gender, ethnicity, and age), this field experiment did not estimate subjects’ income, which rendered it unable to test for economic self-interest. Looking outside of the United States, Mueller, Vatter, and Schmid (Reference Mueller, Vatter and Schmid2016) analyzed municipal-level voting on an inter-regional fiscal equalization referendum in Switzerland in 2004 that would increase monetary transfers from richer to poorer regions. Importantly, the new tax burdens and benefits created by this 2004 referendum were defined regionally, by Swiss canton, rather than at the individual or household level, and the unit of analysis in Mueller, Vatter, and Schmid (Reference Mueller, Vatter and Schmid2016) was Swiss municipality, which is a very large and diverse aggregation of voters. Both of these features of this study dampen the light it sheds on the question of interest to us, which is if the income level of voters systematically relates to their revealed support for raising taxes on the wealthy to fund social spending.
In the end, a substantial contribution to the literature can be made by analyzing voting directly on redistribution, and assessing whether citizens’ presumed exercise of economic self-interest emerges when the outcome is voters’ revealed preferences rather than survey takers’ reported preferences. While research taking advantage of direct democracy in the United States analyzes voters’ revealed preferences on an array of economic policies, a significant addition to the literature would come in the form of a dedicated analysis of voters’ revealed preferences over redistributive policies proposing increased taxes on high-income earners to fund social programs. Finally, given that past studies analyzing voting on economic policies use large units of geographic aggregation of election results, such as American state (Bowler and Donovan Reference Bowler and Donovan1994) or Swiss municipality (Mueller, Vatter, and Schmid Reference Mueller, Vatter and Schmid2016), the literature would be greatly advanced by a study utilizing election results at the smallest level of geographic aggregation possible.
DATA AND METHODS
Voting on redistributive ballot measures in American states with direct democracy offers a revealed-preference behavioral measure of support for redistribution and a valuable opportunity to test for economic self-interest using externally valid data. We identified redistributive policy initiatives placed on a state ballot between 2010 and 2024. Our analysis included any initiative proposing to increase taxes on high-income earners to generate revenue for social spending, and we focused on ballot measures where passage by voters would result in policy adoption (see Appendix A of the Supplementary Material).Footnote 4 The unit of analysis in our study is election precinct, which is the smallest unit of geographic aggregation for election results data in the United States.Footnote 5 This allows us to measure revealed preferences on redistribution at the most granular level available to researchers (Lee et al. Reference Lee, Grant Baldwin, Agustin Markarian and Newman2026). For brevity, we refer to precinct-level voting as “revealed preferences” but note that technically they are aggregated revealed preferences.
Several of the cases we identified could not be included in our analysis due to the absence of publicly-available state-wide precinct-level election results, as many states did not start compiling and making such data publicly available until the 2010s. In addition to state-wide precinct-level election results, our analysis required corresponding election-year state-wide precinct boundary shapefiles in order to merge election results with demographic data from the U.S. Census Bureau. This resulted in our identification of eight redistributive ballot measures across six American states. See Table A1 in the Supplementary Material for more information about case selection and inclusion criteria. While our use of precincts improves upon past research analyzing election results using drastically larger aggregations of voters, such as American states (Bowler and Donovan Reference Bowler and Donovan1994) or Swiss municipalities (Mueller, Vatter, and Schmid Reference Mueller, Vatter and Schmid2016), the aggregate nature of our precinct-level data and theoretical interest in the behavior of voters introduces the problem of ecological inference (Tam Cho and Gaines Reference Tam Cho and Gaines2004). We took several steps to address this issue, including weighting our regression models by each precinct’s estimated voting age population (Appendix C2 of the Supplementary Material) and ancillary analyses of income-homogeneous precincts and an ecological inference model (Appendix D1 of the Supplementary Material).
Our analysis included the following ballot initiatives voted on by state citizens between 2010 and 2024: Washington Initiative 1098 (2010), California Proposition 30 (2012) and Proposition 55 (2016), Colorado Amendment 73 (2018), Arizona Proposition 208 (2020), Illinois Graduated Income Tax (or “Fair Tax”) Amendment (2020), Massachusetts Question 1 (2022), and Washington Initiative 2109 (2024). Six of these measures involved straightforward proposals to increase taxes on high earners to fund social spending, one involved a constitutional amendment to do away with flat taxes to allow for a graduated income tax, and one involved a change to capital gains taxation. While these measures varied in scope and detail (see Appendix A of the Supplementary Material), they all directly addressed redistribution through progressive tax reforms or related fiscal measures. Election results data and precinct shapefiles were retrieved from various sources (see Appendix E2 of the Supplementary Material), including state election offices, the MIT Election Lab, the Redistricting Data Hub, and IPUMS-NHGIS (Manson et al. Reference Manson, Schroeder, Van Riper, Knowles, Kugler, Roberts and Ruggles2024). Where necessary, precinct shapefiles were projected into a common coordinate reference system (EPSG:26915) and validated for topological consistency. The precinct-level data we compiled across these eight ballot measures provided a total of 73,053 observations of aggregate revealed support for redistribution among precinct voters. For each ballot measure, we computed the percentage of votes cast in favor of redistribution, which was the “Yes” vote for all measures except Initiative 2109 in Washington. For this initiative, a “No” vote indicated opposition to repealing the state capital gains tax and thus a vote in support of redistribution from the rich to spend on social services. The proportion of votes cast in favor of redistribution in each election precinct served as the dependent variable in our analysis.
To conduct our analysis, we needed information about the demographic characteristics of our election precincts. As such, we gathered demographic data from IPUMS-NHGIS (Manson et al. Reference Manson, Schroeder, Van Riper, Knowles, Kugler, Roberts and Ruggles2024), using both Decennial Census block-level data (2000 or 2010 or 2020) and American Community Survey (ACS) five-year block-group-level data for the closest pre-election period for each ballot measure (e.g., 2008–12 ACS for 2012 elections and 2012–16 ACS for 2016 elections).Footnote 6 Because Census block and block-group boundaries do not perfectly align with election precinct boundaries, we employed a two-step geographic merging process. First, we merge census data with precincts using census shapefile centroids: when a census block or block-group centroid falls within a precinct, we aggregate the census data into the precinct. For precincts that do not contain a census block or block-group centroid, we use areal interpolation using the areal R package to estimate block- and block-group-level variables into precinct boundaries. Areal interpolation allows us to merge Census (source) and precinct (target) data, weighing source data based on the degree of spatial overlap with target shapefiles under the assumption that individuals are evenly distributed across source features (Prener and Revord Reference Prener and Revord2019).Footnote 7
Our main independent variables capture precinct-level income composition, and we used three different measures of the economic standing of precinct voters. First, Proportion Below Median Income is the estimated share of precinct households with annual incomes below the state median in the year of the election containing each redistributive measure; this variable offers an easily interpretable estimate of the size of the precinct population theoretically most likely to support redistribution (i.e., lower-income residents). Second, Median Income, measured in thousands of USD, allows for a test of the relationship between the average income of households within a precinct and precinct voter support for redistribution. Third, to explore potential nonlinearity and the voting behavior of distinct income groups, we calculated the proportion of precinct households falling into each quintile (labeled Q1–Q5) of the state income distribution in the year of the election containing each redistributive measure. For example, Q1 captures the proportion of households in a precinct whose incomes fall in the first quintile of the state-year income distribution; for Proposition 208 in Arizona in 2020, the first income quintile included households with annual incomes ranging from $0 to $26,747 (cutoff point: $25,000) and, across precincts in Arizona, the proportion of households in this Q1 range varied from as low as 0% to as high as 100%. When using these quintile proportion measures, we use two different excluded reference categories: the middle quintile (Q3) or the highest quintile (Q5). Using Q3 as the omitted reference group allows us to assess the voting behavior of lower- and upper-income precinct voters relative to middle-income precinct voters. Alternatively, using Q5 as the omitted reference group allows us to assess the voting behavior of lower- through upper-middle-income precinct voters relative to high-income precinct voters.
We estimated ordinary least squares (OLS) models predicting precinct support for redistribution as a function of one of the above-referenced income composition measures and a set of controls. All models included controls for proportion male, proportion under 18 years of age, proportion aged 65 years or older, proportion non-white, proportion homeowners, proportion with a bachelor’s degree or higher, proportion unemployed, logged voting age population, and logged population density. Importantly, our analyses included model specifications with and without a control for precinct partisan lean, measured as Democratic vote share in the presidential election prior to the ballot measure.Footnote 8 This variable plays two potentially distinct roles in our analysis. First, partisan lean may act as a confounder if it is predictive of both neighborhood income composition and support for redistribution. We know that there are partisan differences in income and home ownership (Doherty, Kiley, and Asheer Reference Doherty, Kiley and Asheer2024), the characteristics of the neighborhoods people live in (Brown and Enos Reference Brown and Enos2021) or choose to move to (Martin and Webster Reference Martin and Webster2020), and support for redistribution (Franko, Tolbert, and Witko Reference Franko, Tolbert and Witko2013; Newman and Teten Reference Newman and Teten2021; Tolbert, Witko, and Wolbers Reference Tolbert, Witko and Wolbers2019). As such, precinct partisanship may be correlated with income composition, and failing to control for partisan leanings could render spurious relationships between precinct income composition and support for redistributive policies. Controlling for partisan lean therefore helps address this concern. Second, partisan lean may act as a mediator given that income and socioeconomic status factor into party identification (Gelman, Kenworthy, and Su Reference Gelman, Kenworthy and Su2010; McCarty, Poole, and Rosenthal Reference McCarty, Poole and Rosenthal2016) and that the characteristics of the neighborhoods people live in can lead to changes in their partisanship (Martin and Webster Reference Martin and Webster2020), both of which render it plausible that income affects support for redistribution through partisan leanings. In this case, controlling for partisan lean would capture part of the causal pathway from income to support for redistribution, unnecessarily attenuating our estimated income coefficient. By presenting results from models with and without the partisan lean control, we provide readers with estimates that account for potential confounding while also revealing the total effect of income composition, including any indirect effects operating through partisan attachments. To prevent low-population precincts from exerting disproportionate influence, we weighted our OLS models by each precinct’s estimated voting age population. This approach shifts the analysis from one in which all precincts contribute equally (unweighted) to one in which all potential voters contribute equally, approximating an individual-level relationship aggregated through precincts.
For our initial presentation of findings, we present results from four distinct OLS models for each of our eight ballot measures: models using Proportion Below Median Income as the focal income composition measure that include or exclude partisan lean in our set of covariates, and models using Median Income as the focal income composition measure that include or exclude partisan lean in our set of covariates. To summarize findings across our eight cases, we estimated meta-analytic coefficients using the meta package (Balduzzi, Rücker, and Schwarzer Reference Balduzzi, Rücker and Schwarzer2019).Footnote 9 To explore potential nonlinearity and the voting behavior of distinct income groups, we estimated a final set of models using the proportion in each income quintile as the focal predictors, with the proportion in Q3 or Q5 as the excluded comparison category. We then summarize these by-quintile findings across our eight cases with meta-analytic estimates.
RESULTS
Figure 1 displays the estimated coefficients for Proportion Below Median Income (left panel) and Median Income (right panel) for each case, alongside the meta-analytic estimates, for models excluding and including partisan lean (see Appendix C of the Supplementary Material for full results). Beginning with the left panel and models excluding partisan lean (gray coefficients), for 7 out of 8 cases, precincts with larger shares of households earning incomes below the state-year median exhibit significantly higher revealed support for redistribution. Thus, when excluding a control that may mediate a portion of the relationship between income and support for redistribution, the findings are nearly uniform with respect to sign and statistical significance. The pooled meta-analytic estimate (
$ \beta =0.082 $
 , 95%CI [0.076, 0.088]) indicates that a one-percentage-point increase in the share of below-median-income households is associated with a 0.082-percentage-point increase in votes cast for redistribution; a one standard deviation increase in the share of below-median-income households is associated with a 1.7-percentage-point increase in votes cast for redistribution.
Precinct Income Composition and Support for Redistribution
Note: All models use heteroskedasticity-robust standard errors and are weighted by voting age population. Points denote coefficients, and capped horizontal bars denote 95% confidence intervals. “Meta” refers to fixed-effects meta-analytic estimates pooling across the eight cases.

Figure 1. Long description
A multi-panel dot plot with two side-by-side graphs. The Y-axis for both panels lists nine categories from top to bottom: A Z, C A 12, C A 16, C O, Meta, I L, M A, W A 10, and W A 24. A legend on the right identifies grey dots as Demographics and black dots as Demographics plus Partisan Lean.
Left Panel: The X-axis is labeled Coefficient for Proportion Below Median Income, ranging from minus 0.05 to 0.15. A vertical red dashed line marks the 0.00 baseline. Most coefficients are positive, located to the right of the red line. The Meta estimate shows a positive coefficient of approximately 0.04 for the black model and 0.08 for the grey model.
Right Panel: The X-axis is labeled Coefficient for Median Income in Thousands, ranging from minus 1 e minus 03 to 0 e plus 00. A vertical red dashed line marks the 0 baseline on the far right. All data points are negative, located to the left of the red line. The Meta estimate shows a negative coefficient of approximately minus 5 e minus 04 for both models.
In both panels, horizontal capped bars represent 95 percent confidence intervals. Adding Partisan Lean generally shifts the coefficients closer to the zero baseline compared to the Demographics-only model.
Turning to our models including precinct partisan lean (black coefficients), we observe statistically significant coefficients for Proportion Below Median Income for 5 out of 8 cases, with a positive and significant average (meta-analytic) coefficient. The meta-analytic estimate (
$ \beta =0.035 $
 , 95% CI [0.032, 0.039]) indicates that a one-percentage-point increase in the share of below-median-income households is associated with a 0.035-percentage-point increase in votes cast for redistribution; a one standard deviation increase in the share of below-median-income households is associated with a 0.7-percentage-point increase in votes cast for redistribution. The reduction in coefficient sizes caused by controlling for partisan lean is expected if we believe that it functions at least partially as a mediator through which economic status impacts support for redistribution. The statistically significant and relatively large coefficients for I-1098 in WA (2010) and Proposition 30 in CA (2012) (model excluding partisan lean) align with survey-based findings documenting significantly higher reported support for these measures among lower-income respondents in each state (Franko, Tolbert, and Witko Reference Franko, Tolbert and Witko2013; Tolbert, Bowen, and Donovan Reference Tolbert, Bowen and Donovan2009). Moreover, we observe some comparability in the size of relationships of interest between election results and survey data. For example, Franko, Tolbert, and Witko (Reference Franko, Tolbert and Witko2013) report a 0.15 change in the probability of support for WA I-1098 when moving from respondents earning above to below $60K per year and we observe a 0.121 (0.082 when including partisan lean) increase in “Yes” vote for I-1098 associated with a one-unit increase in the proportion of below-median-income households in a precinct—equivalent to moving from 0% to 100% below-median-income households (see Tables C15 and C23 in the Supplementary Material).
The right panel of Figure 1 presents the results from models using Median Income to capture the economic standing of precinct voters. The results in the right panel indicate that higher median income is consistently associated with lower support for redistribution, with negative and statistically significant coefficients from models excluding (8 out of 8 cases) and including (8 out of 8 cases) partisan lean. The meta-analytic estimates indicate similar average coefficients for Median Income across models excluding and including partisan lean. Using the meta-analytic estimate from the model including partisan lean (
$ \beta =-0.00046 $
 , 95%CI [−0.00048,−0.00044]), a $1,000 increase in a precinct’s median income is associated with a 0.046-percentage-point decrease in revealed support for redistribution; alternately, a standard deviation ($42,253) increase in precinct median income is associated with a 1.9-percentage-point decrease in support for redistribution. The negative and significant coefficients observed for Proposition 55 in CA (2016) (excluding partisan lean) and Question 1 in MA (2022) align with survey-based findings documenting a significant decrease in reported support for these measures associated with an increase in respondents’ income (Newman and Teten Reference Newman and Teten2021). As robustness checks, we demonstrate that the results in Figure 1 are not due to “suppression effects” (Lenz and Sahn Reference Lenz and Sahn2021) and hold when estimating bivariate models (Appendix C1 of the Supplementary Material), when stacking the data instead of estimating meta-analytic coefficients (Appendix D2 of the Supplementary Material), when using beta regression instead of OLS (Appendix D3 of the Supplementary Material), and when excluding weights for precinct voting age population (Appendix D4 of the Supplementary Material).
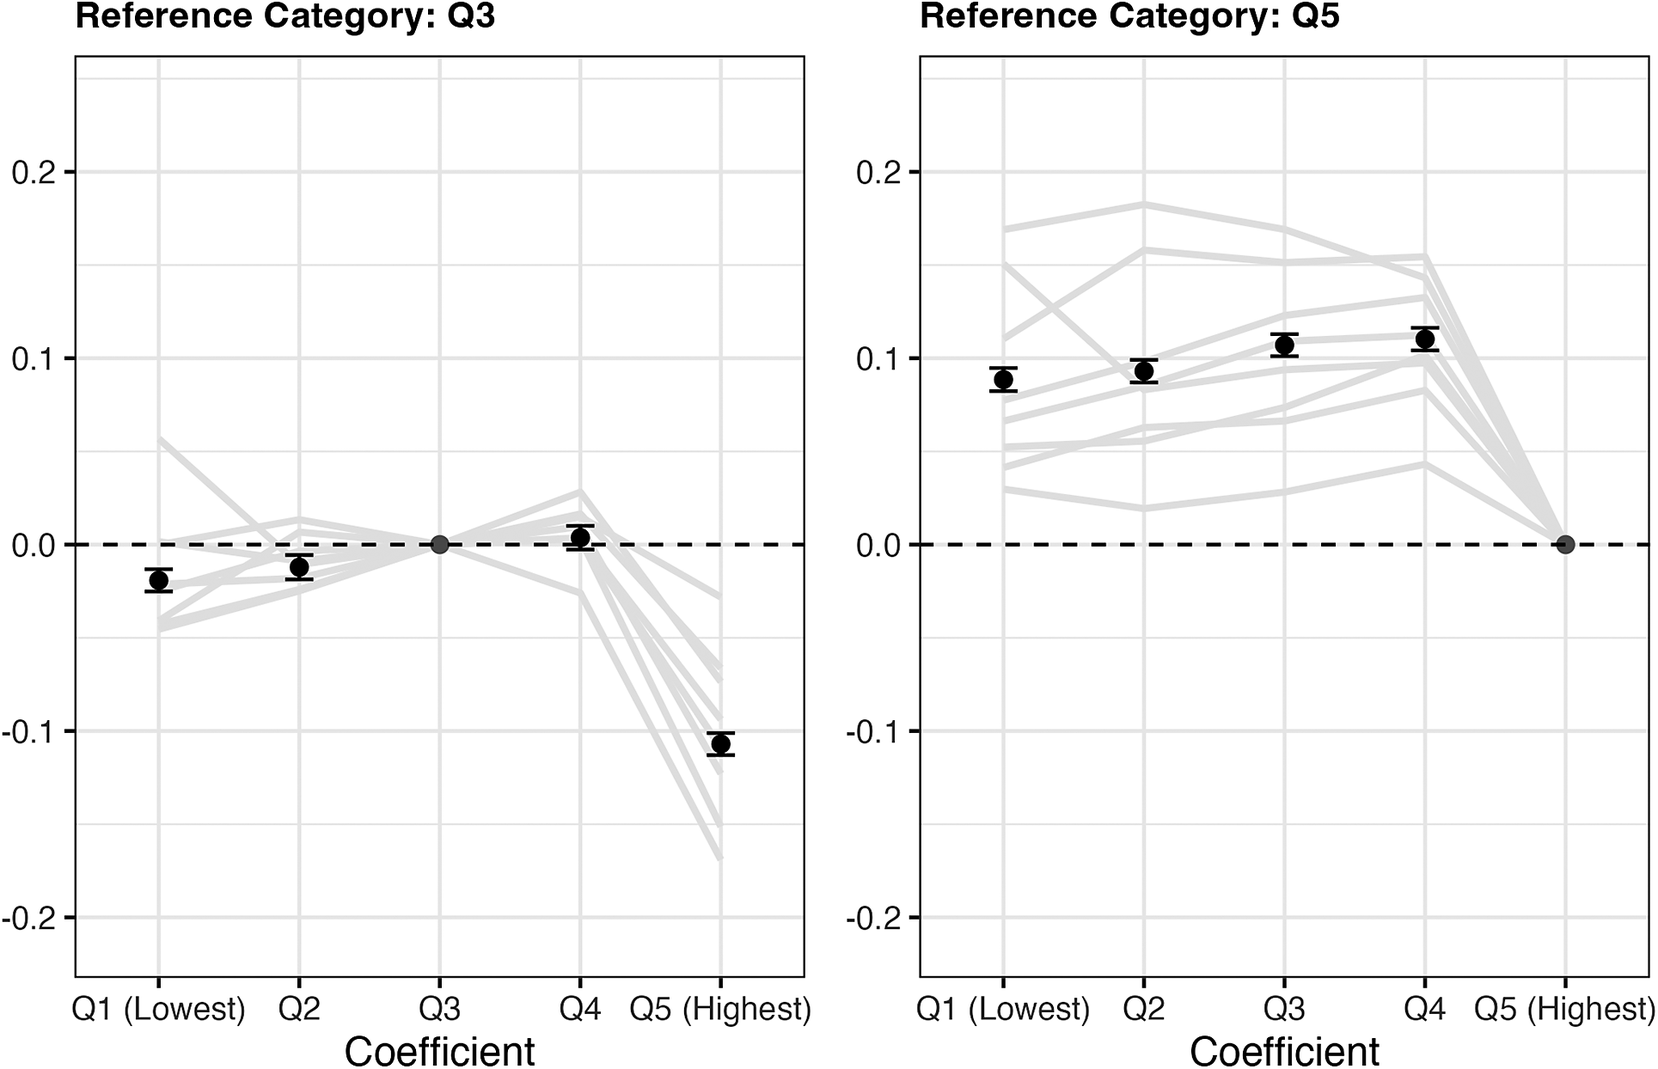
Figure 2 examines potential nonlinearities and the voting behavior of distinct income groups. The gray lines depict the results when analyzing the eight ballot measures separately, and the plotted black coefficients present meta-analytic estimates. To simplify presentation, all results in this figure are from models including partisan lean (see Appendix C2.1 of the Supplementary Material to view results excluding partisan lean). As a reminder, each Q1–Q5 variable measures the estimated proportion of precinct households falling within the respective quintile. The left panel presents results from regression models where precinct support for redistribution is regressed on Q1, Q2, Q4, and Q5 plus controls (including Democratic vote share in the previous election), and the right panel does the same but includes Q3 and omits Q5. Coefficients can be interpreted as the expected change in precinct percentage pro-redistribution votes associated with an increase in the proportion of precinct households falling into the respective income quintile relative to an increase in the proportion in the excluded quintile.
Precinct Income Group Proportion and Support for Redistribution
Note: All models use heteroskedasticity-robust standard errors and are weighted by voting age population. Gray lines trace state-specific estimates; black points and capped vertical bars are fixed-effects meta-analytic estimates pooling across the eight cases.

Figure 2. Long description
A two-panel graph with panels labeled Reference Category Q 3 on the left and Reference Category Q 5 on the right. Both panels share a vertical y-axis ranging from negative 0.2 to 0.2 and a horizontal x-axis labeled Coefficient with five categories: Q 1 Lowest, Q 2, Q 3, Q 4, and Q 5 Highest. A dashed horizontal line sits at 0.0.
In the left panel (Reference Category Q 3), the data point for Q 3 is fixed at 0.0. To the left, Q 1 and Q 2 show slightly negative pooled estimates around negative 0.02. To the right, Q 4 is near 0.0, while Q 5 drops sharply to a pooled estimate of approximately negative 0.11. Gray state-specific lines show significant variance, particularly for Q 1 and Q 5.
In the right panel (Reference Category Q 5), the data point for Q 5 is fixed at 0.0. Moving from left to right, pooled estimates for Q 1, Q 2, Q 3, and Q 4 show a steady linear increase from approximately 0.09 to 0.11. All four categories remain entirely above the zero line. Gray state-specific lines are clustered above the zero line for Q 1 through Q 4 before converging at zero for Q 5.
Starting with the left panel, where Q3 serves as the excluded reference category, the most visible finding is the reduction in pro-redistribution votes associated with the increased presence of high-income (Q5) earners in a precinct. A one-percentage-point increase in Q5 households is associated with a roughly 0.107-percentage-point drop in pro-redistribution votes in the meta-analysis (
$ \beta =-0.107 $
 , 95%CI [−0.113,−0.101]). The left panel also shows that a one-percentage-point increase in the presence of lower-income (Q1) households (relative to precincts with more middle-income [Q3] households) is associated with a small (0.019-percentage-point) decrease in the proportion of votes in favor of redistribution in the meta-analysis (
$ \beta =-0.019 $
 , 95%CI [−0.025,−0.013]). Turning to the right panel, where the highest quintile (Q5) is the excluded reference category, we see that the coefficients are similar across Q1 (
$ \beta =0.089 $
 , 95%CI [0.082, 0.095]) and Q2 (
$ \beta =0.093 $
 , 95%CI [0.087, 0.099]) and slightly higher for Q3 (
$ \beta =0.107 $
 , 95%CI [0.101, 0.113]) and Q4 (
$ \beta =0.11 $
 , 95%CI [0.104, 0.116]). Taken together, the panels in Figure 2 reveal that support for redistribution was the lowest in heavily high-income precincts and highest in heavily middle- and upper-middle-income precincts. While there were differences in the changes in pro-redistribution votes associated with increasing proportions of Q1–Q4 households, these differences were slight compared to the pronounced drop in redistribution support associated with the increasing prevalence of high-income (Q5) households. Given the aggregate nature of our data, we complement the results in Figure 2 with an analysis of support for redistribution in income-homogeneous low- and high-income precincts and an ecological inference model (Appendix D1 of the Supplementary Material). Results from both ancillary analyses suggest significantly higher support for redistribution among low-income voters vis-à-vis high-income voters.
As several of the cases included in our analysis correspond to published studies using survey data to analyze reported support for state-level redistributive initiatives (Franko, Tolbert, and Witko Reference Franko, Tolbert and Witko2013; Newman and Teten Reference Newman and Teten2021; Tolbert, Witko, and Wolbers Reference Tolbert, Witko and Wolbers2019), we can engage in a coarse yet serviceable comparison of findings across income groups between our precinct-level election results data and individual-level survey data. While our findings overall align with survey-based findings in terms of evidence of the exercise of economic self-interest on redistribution, there are nuanced points of departure in a few instances related to where specifically in the income distribution economic self-interest is being exercised the most (see Appendix H of the Supplementary Material). We observe two instances (I-1098 in WA and Proposition 30 in CA) where election results and survey findings (Franko, Tolbert, and Witko Reference Franko, Tolbert and Witko2013; Tolbert, Witko, and Wolbers Reference Tolbert, Witko and Wolbers2019) depart in terms of the exercise of economic self-interest by high-income state residents in opposition to redistribution, with survey-based findings suggesting its absence and election results data suggesting its presence. These two instances, however, are countered by two other instances (Proposition 55 in CA and Question 1 in MA) where election results and survey findings (Newman and Teten Reference Newman and Teten2021) align on the exercise of economic self-interest among the poor in favor and the rich in opposition to redistribution. Across three published studies using survey data, the overall takeaway is that nonaffluent citizens favor redistributive proposals more than affluent citizens, and our findings align with this conclusion.
In summary, the results in Figures 1 and 2 provide suggestive evidence of a general exercise of economic self-interest consistent with standing wisdom relying near exclusively on individual-level survey data and reported preferences. Consistent with prior survey findings, our results imply that affluent voters are less supportive of redistribution than nonaffluent voters. This said, when conducting more nuanced analyses (i.e., Figure 2), we find that the increasing prevalence of low-income households has a somewhat smaller association with support for redistribution than the increasing prevalence of middle-income or upper-middle-income households. While this pattern is intriguing, it is important to avoid drawing too large conclusion from these slight differences and to focus on the main takeaway: the economic standing of precinct voters is systematically related to their revealed support for redistribution, with support the lowest among precincts disproportionately populated with high-income households subject to proposed tax increases.
Heterogeneity by Partisan Leanings
Prior research suggests that the exercise of economic self-interest may vary based on partisanship and political context. For example, Gelman (Reference Gelman2008) only observed significant and sizable differences in voting patterns between low- and high-income Americans in poor and more politically conservative states, noting that the wealthy in more affluent and politically liberal states were seemingly not exercising their economic self-interest the way their wealthy counterparts were in poor and more conservative states. One potential explanation for this is the increasing importance of noneconomic considerations in shaping the policy preferences of affluent Americans. For instance, Gilens and Thal (Reference Gilens and Thal2018) find that, among affluent Americans, altruistic concern for the well-being of others leads to greater identification with the Democratic Party and heightened support for liberal economic policies.
This is complemented by research demonstrating more pronounced income-based differences in perceptions of growing economic inequality (Waight and Goldstein Reference Waight and Goldstein2025) and preferences over taxing high-income earners (Vilbig Reference Vilbig2026) among Republican vis-à-vis Democratic identifiers. Aligning with these findings, Boudreau and MacKenzie (Reference Boudreau and MacKenzie2018) find that the provision of information about growing economic inequality in California provoked increased support for a redistributive ballot measure (Proposition 30 in 2012) among Republican, but not Democratic, identifiers. Reinforcing these findings, repeated surveys conducted by the Pew Research Center soliciting Americans’ support for raising taxes on wealthy households find opposing patterns across respondent income by partisanship: among Democrats, higher-income respondents were more supportive of progressive taxation than lower-income respondents; however, among Republicans, the opposite was observed—with lower-income respondents more supportive than higher-income respondents (Cerda Reference Cerda2025; Fingerhut Reference Fingerhut2017). These findings released by Pew are corroborated by Tolbert, Witko, and Wolbers (Reference Tolbert, Witko and Wolbers2019) and Newman and Teten (Reference Newman and Teten2021), who each find more pronounced increases in reported support for redistributive state ballot measures associated with lower-income status among Republican (vs. Democratic) identifiers.
In this section, we examine whether precinct partisan leanings moderate the relationship between precinct income composition and support for redistribution. We regressed support for redistribution on the interaction between precinct Proportion Below Median Income and Democratic Presidential Vote Share in the prior election. We estimate these models separately for each ballot measure and in a “stacked” specification that pooled all eight ballot measures while including ballot measure fixed effects.Footnote 10 All models included demographic controls. Figure 3 displays the marginal effect of Proportion Below Median Income across values of precinct partisan lean. The results indicate a consistent negative moderation effect: as precincts become more Democratic-leaning, the effect of Proportion Below Median Income on support for redistribution diminishes and, in half of the cases, reverses (see Table C25 in the Supplementary Material). In this half of cases (AZ, CO, and CA 2012 and 2016), an increase in the prevalence of lower-income households is associated with reduced support for redistribution, implying that higher-income Democratic precincts were more supportive of redistribution than lower-income Democratic precincts. The diverging marginal effects in these four cases help explain their insignificant coefficients in Figure 1. When looking on average across all cases (i.e., “stacked data”),Footnote 11 the implied takeaway is that the exercise of self-interest in favor of redistribution among low-income voters is most operative among Republican voters. These findings strongly align with prior research documenting more visible economic self-interest effects among voters on the political right, with affluent voters on the political left seemingly acting against their own economic self-interest in pursuit of other motives (e.g., altruism). Importantly, the pattern of results reported in Figure 3 holds when using the check on interaction models recommended by Hainmueller, Mummolo, and Xu (Reference Hainmueller, Mummolo and Xu2019) (Appendix G of the Supplementary Material).
Marginal Effects of Proportion below Median Income by Precinct Partisan Lean on Support for Redistribution
Note: All models use heteroskedasticity-robust standard errors and are weighted by voting age population. The black line presents the marginal effects using “stacked” data including all cases, with 95% confidence intervals indicated by the gray ribbon. Gray lines depict marginal effect estimates for each case.

Figure 3. Long description
The X-axis represents Precinct Democratic Voter Share in Prior Presidential Election, ranging from 0.25 to 1.00. The Y-axis represents the Marginal effect of Proportion Below Median Income on Support for Redistribution, ranging from negative 0.05 to 0.15. A horizontal dashed line marks the zero effect threshold.
* The primary data is a thick black line labeled Stacked, which begins at a Y-value of approximately 0.08 at X equals 0.25 and descends linearly to approximately negative 0.02 at X equals 0.90. This line is enveloped by a light gray ribbon representing a 95 percent confidence interval.
* Individual gray lines represent specific cases, labeled at their rightmost endpoints.
* W A 10 is nearly horizontal, staying around 0.08.
* M A and I L show slight negative slopes, ending between 0.03 and 0.05.
* W A 24, C O, C A 16, C A 12, and A Z show much steeper negative slopes.
* A Z and C A 12 have the steepest declines, crossing the zero threshold around X equals 0.60 and ending near negative 0.07.
CONCLUSION
This research note provides the most comprehensive analysis to date of Americans’ revealed preferences on government redistribution. A massive corpus of research on the politics of redistribution relies near-exclusively on reported preferences in surveys, with little research analyzing instances where Americans were given the opportunity to cast a vote on redistribution directly. The exercise of economic self-interest is a standing wisdom in the redistributive politics literature, and this study corroborates decades of survey-based findings with an analysis of aggregated revealed preference election results data using all redistributive ballot measures in the twenty-first century from states with publicly-available statewide precinct-level election results. We uncover clear and consistent evidence of the exercise of economic self-interest in the form of greater support for redistribution in precincts dominated by nonaffluent households and significantly lower relative support in precincts dominated by high-income households subject to increased taxation.
One caveat in our findings was the non-monotonic nature of the pattern of support for redistribution associated with the increasing presence of households moving up the income quintile ladder. Our findings did not suggest higher support among low-income relative to middle- or upper-middle-income precincts. Instead, we found only slight differences in support for redistribution associated with increased proportions of low-, middle-, and upper-middle-income households. The most obvious explanation for this is that most of the redistributive measures analyzed in our study involved defined income thresholds for elevated taxation that were above the incomes of households in the first four income quintiles. Adding to this, the social spending outlined in these ballot proposals was not targeted for programs specifically benefiting the poor, but instead was public education, healthcare, and other public goods benefiting households across a wider stretch of the state income distribution. In the end, any assumed linear relationship between household income and support for redistribution may be a relic of reported preferences on questions soliciting abstract support for redistribution. When shifting from abstract survey questions to concrete policy proposals typically involving clear income thresholds for triggered tax increases, it stands to reason that support would be comparably elevated among nonaffluent households and that the main cliff in support would be observed among households at the income threshold for tax increases.
SUPPLEMENTARY MATERIAL
To view supplementary material for this article, please visit https://doi.org/10.1017/S000305542610207X.
DATA AVAILABILITY STATEMENT
Research documentation and data that support the findings of this study are openly available at the American Political Science Review Dataverse: https://doi.org/10.7910/DVN/1JK0Z9.
ACKNOWLEDGMENTS
The authors thank William Franko and the three anonymous reviewers for their insightful feedback on the manuscript. The authors would also like to thank the editor at the American Political Science Review for their valuable guidance during the review process.
CONFLICT OF INTEREST
The authors declare no ethical issues or conflicts of interest in this research.
ETHICAL STANDARDS
The authors affirm this research did not involve human participants.




 Open access


Comments
No Comments have been published for this article.