Introduction
As gerontologists and geriatricians begin to identify the means to increase active life expectancy, rather than mere life expectancy, it is likely that an elderly person's social networks will be shown to be even more indispensable to health and successful aging. However, the importance of social networks will not be fully documented nor understood unless better measures … are implemented in research and clinical settings. (Lubben, Reference Lubben1988: 49)
These sentiments by James Lubben, published 30 years ago, could probably begin any academic discussion of social relationships today. In particular, for the social relationship concept of social isolation, scholars have been studying and writing on this subject in older adults for decades and yet we are seemingly no further ahead in implementing consistent measures that come from consistent definitions (e.g. Victor et al., Reference Victor, Scambler, Bond and Bowling2000). In recent years, possibly because of the launch of the United Kingdom's (UK) Campaign to End Loneliness which has put the spotlight on loneliness, issues of social relationships, social (dis)connection and health have been given considerable focus. In Canada, the last two reports of the National Seniors Council (2014, 2017) have focused on social isolation, and there are targeted funding initiatives as well on social isolation of older adults (Employment and Social Development Canada, 2016). However, lack of consistency of definitions and measurement scales of social isolation makes it challenging to identify socially isolated adults and to know the extent of the problem.
Not only do we need consistent definitions across studies, we also need clear cut-off points to identify who is socially isolated and determine the prevalence of social isolation. Unfortunately, unlike the loneliness literature in which there are a number of established and validated loneliness scales that also include established cut-offs (e.g. De Jong Gierveld Loneliness Scale; De Jong Gierveld and Kamphuis, Reference De Jong Gierveld and Kamphuis1985), the research literature has so far yielded less consistency in measures of social isolation, making cross-study comparisons particularly difficult.
There are many reasons as to why consistent definitions and measures are not used. First, there may be practical reasons to use certain measures of social isolation. For example, a single indicator of social isolation, like living alone, may be the most feasible measure to use in certain cases. An obvious example here may be health practitioners wanting to track social indicators in their clients quickly, or emergency preparedness personnel utilising available social indicators contained in census databases to pinpoint areas of vulnerability. Second, there may be reasons of availability of information. For example, researchers may draw on data-sets that have included an array of social indicators with no established measurement scale. This may be particularly the case in large population-based data-sets in which the main research objective may not focus solely on social connection or isolation per se. As such, measures may depend on what information is available in given data-sets.
Lastly, the concept of social isolation appears to overlap and relate to several broad social relationship literatures, each with its own histories and approaches. As such, depending on the approach, different social aspects are emphasised in definitions of social isolation (e.g. social network, social support, etc.). We discuss some of these literatures below.
How do different definitions and cut-offs impact prevalence rates of social isolation for adults? How does prevalence differ based on age or sex? The present study uses baseline data from one large-scale population-based study, the Canadian Longitudinal Study on Aging (CLSA), to explore these questions. We argue that this is an opportune time to compare different definitions of social isolation, among the same sample of participants.
Definitions of social isolation and related terms
In order to define social isolation, it is helpful to examine the ways in which social isolation has been linked to or distinguished from other social relationship concepts. One important over-arching distinction is between structural (e.g. quantity of social relationships) and functional (e.g. social support) features of social relationships (e.g. Holt-Lundstad et al., Reference Holt-Lunstad, Smith and Layton2010; Valtorta et al., Reference Valtorta, Kanaan, Gilbody and Hanratty2016). For example, Wenger (Reference Wenger1991) described function as what members of a social network do. Holt-Lunstad et al. (Reference Holt-Lunstad, Smith and Layton2010) used this structural and functional distinction in their large-scale meta-analysis of social relationships and mortality to help contextualise findings and trends relating to concepts of interest. Notably, they defined measures of social isolation (structural) as tapping into ‘a pervasive lack of social contact or communication, participation in social activities, or confidant’ (Holt-Lunstad et al., Reference Holt-Lunstad, Smith and Layton2010: 9).
Another common distinction used to describe social relationships is between objective and subjective characteristics. Indeed, there seems to be more or less consensus by researchers that social isolation is an ‘objective’ measure of relationships, and is commonly contrasted with the ‘subjective’ concept of loneliness (e.g. Victor et al., Reference Victor, Scambler, Bond and Bowling2000; Masi et al., Reference Masi, Chen, Hawkley and Cacioppo2010; Steptoe et al., Reference Steptoe, Shankar, Demakakos and Wardle2013; Newall and Menec, Reference Newall and Menec2019; but see also Nicholson, Reference Nicholson2009). De Jong Gierveld and Van Tilburg (Reference De Jong Gierveld and Van Tilburg2006: 583) wrote on the subject: ‘Social isolation … has to do with the objective characteristics of a situation and refers to the absence of relationships with other people. The central question in this context is, To what extent is an individual alone?’ Valtorta et al. (Reference Valtorta, Kanaan, Gilbody and Hanratty2016) recently took on the considerable task of listing and categorising the existing measurement tools of social relationships. In addition to structural/functional dimensions, the approach of Valtorta et al. (Reference Valtorta, Kanaan, Gilbody and Hanratty2016) distinguished subjective/objective dimensions of social relationship measures.
In sum, there seems to be relative agreement that social isolation constitutes an objective ‘lack’ or ‘absence’ of social contact or relationships. However, there is less consensus on how this ‘lack’ is measured or quantified or the social aspects to be used to indicate this ‘lack’. This has particular relevance for the issue of cut-off values necessary to identify socially isolated adults and to produce prevalence rates. This quantification of ‘lack’, so to speak, necessarily brings together conceptual definitions with operational definitions (measures and cut-offs), which we discuss next.
Measuring social isolation: cut-offs and prevalence rates
Cut-offs are necessary to identify socially isolated groups of adults and to provide prevalence rates of social isolation. Prevalence rates of social isolation vary widely, no doubt because of differences in measures and cut-offs used as well as varying populations and other characteristics like age. Valtorta and Hanratty noted:
Quantifying the extent of loneliness and social isolation is essential, but it has been a challenge to researchers. Variation in the current estimates partly stem from the absence of universally accepted definitions and the difference in the phenomena observed, as well as from the range of indicators and measurement tools used. (Valtorta and Hanratty, Reference Valtorta and Hanratty2012: 518–519)
Possibly the most commonly used cut-off for social isolation derives from the Lubben Social Network Scale (LSNS) (Lubben, Reference Lubben1988; Lubben et al., Reference Lubben, Blozik, Gillman, Iliffe, von Renteln Kruse, Beck and Stuck2006) which combines structural and functional items. The original ten-item version contains questions relating to living alone, frequency of contact with family/friends, feeling close to family/friends, reciprocal confidant relationships and help-giving. It was based on the Berkman–Syme Social Network Index to be a more easily administered and scored scale and to be used specifically for an older population (Lubben, Reference Lubben1988). The revised six-item (LSNS-6) scale contains two three-item friend and relatives sub-scales asking participants parallel questions about the number of friends/relatives (including spouse): (a) who are in contact with them at least on a monthly basis; (b) who they feel they can talk to about private matters; and (c) who they feel close enough to that they could call on for help, if needed (Lubben et al., Reference Lubben, Blozik, Gillman, Iliffe, von Renteln Kruse, Beck and Stuck2006). Possible responses are on a five-point scale from 0 = none to 5 = nine or more, so that total scores can range from 0 to 30. An established cut-off score of less than 12 is used to classify people as being socially isolated (Lubben et al., Reference Lubben, Blozik, Gillman, Iliffe, von Renteln Kruse, Beck and Stuck2006). This scale distinguishes between family and friends as well as social network size (number of social contacts) and social support (sub-set of these contacts whom the participant relies on for support) (Lubben, Reference Lubben1988). Therefore, notably, the LSNS-10 and the LSNS-6 both contain structural/objective (number of contacts) and functional/subjective (confidant/call for help) questions. Indeed, it could be argued that four out of the six items are social support items. Thus, it was placed in the mid-point for each of the dimensions of subjectivity/objectivity and structural/functional of Valtorta et al. (Reference Valtorta, Kanaan, Gilbody and Hanratty2016). We would argue that conceptually it therefore captures social network and social support, but does not necessarily line up with many of the definitions proposed for social isolation as outlined above.
Several studies have used the LSNS-6 scale and corresponding cut-off to produce prevalence rates. For example, a Canadian study using data on older adults (aged 65+; community-dwelling) living in the province of British Columbia found that 17 per cent of older adults were socially isolated based on the LSNS-6 (Kobayashi et al., Reference Kobayashi, Cloutier-Fisher and Roth2009). A study out of Japan (Shimada et al., Reference Shimada, Yamakazi, Nakano, Ngoma, Takahashi and Yasumura2014) showed that 31 per cent of older people (65+) living alone and 24 per cent living with family were isolated. Lubben and colleagues (Lubben et al., Reference Lubben, Blozik, Gillman, Iliffe, von Renteln Kruse, Beck and Stuck2006; Blozik et al., Reference Blozik, Wagner, Gillmann, Iliffe, von Renteln-Kruse, Lubben, Beck, Stuck and Clough-Gorr2008) reported prevalence rates of community-dwelling older adults (ages 65+) out of London, UK (15%), Hamburg, Germany (20%) and Solothurn, Switzerland (11%). Moreover, other studies using a combination of structural/functional and objective/subjective dimensions have produced comparable prevalence rates. In one Canadian study using Statistics Canada population data of community-dwelling adults (aged 65+), the authors utilised two questions to assess social isolation: whether participants live alone (yes/no); and how many friends/relatives they ‘feel at ease with and can call upon for help’ (no doubt based on Lubben's Scale, as described above). Social isolation was defined as living alone and reporting few (three or less) close friends/relatives. Based on this cut-off, results showed that 17.5 per cent of older adults were socially isolated (Cloutier-Fisher and Kobayashi, Reference Cloutier-Fisher and Kobayashi2009).
Others have used more data-driven approaches to produce cut-offs. Steptoe and colleagues (e.g. Shankar et al., Reference Shankar, McMunn, Banks and Steptoe2011; Steptoe et al., Reference Steptoe, Shankar, Demakakos and Wardle2013) used data from the English Longitudinal Study on Ageing (ELSA) to create a Social Isolation Index that included five structural items: (a) unmarried/living alone; (b) less than monthly contact with children; (c) less than monthly contact with other family; (d) less than monthly contact with friends; and (e) do not participate in organisations such as social clubs, resident groups religious groups or committees (Steptoe et al., Reference Steptoe, Shankar, Demakakos and Wardle2013). Each indicator was scored as 1 point (yes/no), resulting in a possible range of 0–5, with higher scores indicating more isolated. To determine who was socially isolated or not, Steptoe et al. (Reference Steptoe, Shankar, Demakakos and Wardle2013) took the highest quintile (matching to ⩾2 out of 5) as their cut-off score, resulting, naturally, in a prevalence rate of 19 per cent (highest quintile) for this sample (aged 52+). According to the framework of Valtorta et al., this scale could be categorised as ‘multi-item measures combining questions about frequency of contact with others and participation in activities’ (see table 1 in Valtorta et al., Reference Valtorta, Kanaan, Gilbody and Hanratty2016); the scale is high on the structural dimension and low on subjectivity. Thus, this type of scale seems to align with definitions of social isolation as being an ‘objective’ measure of having low social contact and contacts.
As there is a wide variation in prevalence rates, in summarising research, some have described the prevalence of social isolation as low, others as quite high. Victor et al. (Reference Victor, Scambler, Bond and Bowling2000), reporting on five UK studies from 1957 to 1989 noted that, generally, prevalence rates among older adults are low, ranging from 2 to 20 per cent. Others have reported the prevalence of social isolation as being high, such as over 35 per cent or even 40 per cent (Nicholson, Reference Nicholson2009, Reference Nicholson2012); however, these latter high prevalence rates may be misleading as the studies that these figures are drawn from include specialised population groups (e.g. psychiatric inpatients; Smith and Hirdes, Reference Smith and Hirdes2009, from Nicholson, Reference Nicholson2012). For their study, Smith and Hirdes (Reference Smith and Hirdes2009) used one item from the Resident Assessment Instrument - Mental Health that asked about how recently people had been in contact with friends or family. The 29 per cent of the sample of psychiatric inpatients who had been in contact with their friends/family more than 30 days ago were categorised as being socially isolated. These findings underscore how difficult it is to compare and contrast prevalence rates from studies using different samples and using different measures and cut-offs.
The present study, using one large population-based database, allows an opportunity to look at different definitions systematically in a large, national sample; thus adding to past research using single samples to compare measures of social isolation (e.g. Chappell and Badger, Reference Chappell and Badger1989; Eckhard, Reference Eckhard2018). Chappell and Badger's (Reference Chappell and Badger1989) work examining older adults aged 60+ suggested that different measures predict well-being differently: specifically, that measures conceptually similar to ‘structural’ aspects of relationships such as low social contact did not predict well-being outcomes (life satisfaction; happiness), but that more ‘functional’ aspects like lack of confidants/companions (friends) did. Most recently, Eckhard's (Reference Eckhard2018) study drew on German studies including participants aged 18+ and compared measures assessing social contact (structural), discussion network (confidant–functional) and social support (functional). In this study, Eckhard defined the social contact measure as: living alone; not being in a couple relationship; getting together with friends, relatives and neighbours less than monthly; and helping friends, relatives and neighbours less than monthly. Examining those aged 56+, Eckhard reported prevalence rates between 7.5 and 8 per cent using this social contact measure. Further, in contrast to Chappell and Badger's (Reference Chappell and Badger1989) study results for their ‘structural’ measures, Eckhard's study results indicated that the social contact measure was the strongest predictor of the well-being outcomes of life satisfaction, health and poverty. Of note, for the social support measure (which asked people to choose from a list those whom they could ask for help if they were to need long-term care), isolation decreased with older age. The author argued that this result could be due to older age groups not wanting to ‘burden’ anyone with having to help them, rather than reflecting isolation per se (Eckhard, Reference Eckhard2018).
In sum, studies reporting on prevalence rates using national data or drawing on large population-based studies of community-dwelling older adults use a variety of social network, social support and social participation items, sometimes drawing on structural and functional questions, or a combination of both. Some include more or less objective/subjective questions, and line up more (or less) with definitions of social isolation as described previously. When a cut-off score is produced, this can be based on conceptual reasons or be data-driven. Based on the above analysis, prevalence rates range from 2 to 40 per cent in older adults, but this range may be more attributable to different measures used (and in some cases specialised populations) than to an actual real range in the older adult population. Thus, the extent of social isolation among older adults is difficult to know. Moreover, we could expect that prevalence estimates may differ based on such factors as age, sex or socio-economic status. For example, studies reporting on correlates of being socially isolated suggest that social isolation may differ by males/females, age groups, income or marital status (e.g. Kobayashi et al., Reference Kobayashi, Cloutier-Fisher and Roth2009). Moreover, Eckhard (Reference Eckhard2018) reported prevalence differences based on age and sex using different definitions of social isolation. For example, at younger ages (18–55), prevalence of social isolation based on the social contact scale ranged from 2 to 3 per cent; whereas it was approximately 8 per cent at the older ages (56+). However, when using a functional measure of social isolation (assessing confidants), results indicated that isolation was higher among younger as compared to older adults. Thus, of interest to us in the present study was the ability to use one large-scale Canadian database to be able to compare different definitions of social isolation (from the more simple one-item indicators to complex; combining or keeping separate structural/functional items) and cut-offs and their respective prevalence estimates as well as by different groups (age, sex, etc.). A description and rationale of our selected measures is described in detail next.
The present study: systematic comparison across measures and participant characteristics
In sum, as based on the above discussion, two issues need to be considered in identifying socially isolated individuals:
(1) How is isolation defined? That is, what variables (scales) are used to define it?
(2) What cut-offs are used to classify individuals as socially isolated?
As discussed above, there is little consistency in the literature in either of these areas. In the present study, we therefore consider several different approaches. We used several definitions and cut-offs to define social isolation based on: conceptual considerations and comparing items with those in commonly used scales such as the LSNS (Lubben et al., Reference Lubben, Blozik, Gillman, Iliffe, von Renteln Kruse, Beck and Stuck2006). Using different definitions, we then identified socially isolated adults and compared these groups according to socio-demographic, health and well-being outcomes.
It should be noted that for conceptual clarity, we agree with other researchers about keeping distinctions between structural (including restricted social networks, living alone), functional (social support) (e.g. Harasemiw et al., Reference Harasemiw, Newall, Shoostra, Mackenzie and Menec2018) and perhaps even emotional/evaluative (loneliness) features. What do we gain by keeping these factors distinct for conceptual clarity? We argue that keeping distinctions: (a) allows researchers to clarify relationships between the different features (e.g. Does social support mediate the relationship between structural aspects and health? How do isolated and lonely differ from not isolated and lonely?); and (b) allows targeting for interventions/programmes/preparedness. For example, the broad structural characteristic of living alone/unpartnered may be useful and simple for emergency preparedness to guide which areas to target first. Targeting those with low social contacts may be more useful for educational programmes/resources designed to increase contacts, such as befriending programmes. Taking this logic a step further, having prevalence rates for each definition would give a sense of the magnitude of the population that needs to be reached.
In the present study, we compared definitions of social isolation (some single, some more composite or complex) to identify socially isolated adults. In particular, we began with perhaps the simplest definition: living alone/unpartnered. For composite scales we were guided by the LSNS-6 described above (Lubben et al., Reference Lubben, Blozik, Gillman, Iliffe, von Renteln Kruse, Beck and Stuck2006) (which combines structural and functional) and as well as scales similar to the Social Isolation Index of Steptoe et al. (Reference Steptoe, Shankar, Demakakos and Wardle2013) (which includes the structural features of marital status/living alone, frequency of contact with family members and friends, and social organisation participation), also similar to Eckhard's (Reference Eckhard2018) social contacts measure. Importantly, we also compared prevalence rates of different groups: males/females, age groups (45–64 and 65+) and education level (low and high). Again, this allowed us to determine how prevalence within these groups changed using different conceptions of social isolation. Finally, we examined how different indicators of social isolation related to health and well-being outcomes (e.g. similar to Chappell and Badger, Reference Chappell and Badger1989; Eckhard, Reference Eckhard2018). In the following sections, we discuss each of the structural and functional aspects used for the present study.
Structural characteristics: living alone
A simple definition of social isolation is: living alone. Living alone is consistently predictive of loneliness (e.g. De Jong Gierveld, Reference De Jong Gierveld1987; Newall et al., Reference Newall, Chipperfield and Bailis2014) and is typically used in measures of social isolation. As stated succinctly by Victor et al. (Reference Victor, Scambler, Bond and Bowling2000: 410), ‘Not all those who live alone are isolated, whilst most of the isolated live alone’.
According to the latest Canadian Census 2016 information on household composition, for the first time, one-person households are the most common type of household in Canada, accounting for 28.2 per cent of households; and more females aged 65+ (33%) live alone than males (18%) (Statistics Canada, 2017). We used this indicator as a comparison point as we would expect sex and age differences to emerge with this indicator, though it was not clear whether we would see sex/age differences on more composite measures of social isolation that go beyond co-habitation.
Structural characteristics: social networks
A social network can be defined as all of an individual's social contacts or further defined according to such aspects as overall size, homogeneity and frequency of contact (e.g. Lubben, Reference Lubben1988). Researchers (e.g. Lubben, Reference Lubben1988) have noted the important distinction to be made between friend and family networks. We can also describe our social connections as sources of support, as did Berkman and Syme in their highly influential work on social networks (e.g. Berkman and Syme, Reference Berkman and Syme1979). In particular, they identified four sources of support as being particularly important: (a) marriage, (b) close friends and relatives, and (c) religious and (d) informal/formal group associations. This perspective continues to influence definitions and conceptions of social (dis)connection, as exemplified by the Social Isolation Index of Steptoe et al. (drawing on ELSA), for example, which taps into all sets of these sources of contact. Indeed, researchers, including ourselves, have drawn on the work of Berkman and Syme to develop typologies of social networks based on different sources of contact (e.g. Wenger, Reference Wenger1991; Litwin, Reference Litwin2004; Harasemiw et al., Reference Harasemiw, Newall, Shoostra, Mackenzie and Menec2018; Smith and Victor, Reference Smith and Victor2019).
Although Berkman and Syme argued that certain sources of contact are more important than others, in their influential work on social relationships and mortality, Berkman and Syme discussed the idea that it may be the sum of social connection that is important as well, recognising that trade-offs could be made:
Of particular interest is the number of possible relationships that place an individual in a particular risk category. For instance, people who were not married but who had many friends and relatives were found to have mortality rates equal to those who were married but who had fewer contacts with friends and relatives … Trade-offs and substitutions such as this assured us that about 60 percent of the sample, through one kind of contact or another, managed to maintain reasonably low mortality risk. It was only in the presence of mounting social disconnection, when individuals failed to have links in several different spheres of interaction, that mortality rates rose sharply. (Berkman and Syme, Reference Berkman and Syme1979: 1085)
Thus, not surprisingly perhaps, many researchers have built on this research using simple sums of contacts. This approach recognises that someone may not have children or may not be married, for example, but may have sources of contact that provide a substitution or trade-off. Similarly, for the present study, we utilised questions that asked about frequency of contact with family (relatives and children) and friends and neighbours, keeping in mind the notion of substitution and trade-offs.
Structural characteristics: social participation
Valtorta et al. included ‘question(s) about participation in social activities (see table 1 in Valtorta et al., Reference Valtorta, Kanaan, Gilbody and Hanratty2016) as reflecting the structural dimension of social relationship measures. Scales such as Berkman and Syme's (Reference Berkman and Syme1979) Social Network Index and the Social Isolation Index of Steptoe et al. (Reference Steptoe, Shankar, Demakakos and Wardle2013) include these types of questions. Indeed, there is an extensive literature on social participation that typically asks participants to indicate the number of social activities they participate in over a week or month (Herzog et al., Reference Herzog, Ofstedal and Wheeler2002). Lack of social participation might even constitute a definition of social isolation itself as, for example, De Jong Gierveld et al. (Reference De Jong Gierveld, Van Tilburg, Dykstra, Vangelisti and Perlman2006) argued that social participation is the opposite of social isolation. We drew from a listing of social activities in the CLSA (e.g. cultural activities, volunteering) and, due to the fact that many of our participants would still be in the workforce, included a question about participation in work as well.
Functional characteristics: (perceived) social support
In differentiating social network from social support, Lubben drew from Thoits and noted:
a social support system is that subset of persons within an individual's social network on whom that individual can rely for support … Any measure of social networks or support must clarify which construct is being measured: social networks or social support. (Lubben, Reference Lubben1988: 45)
Of course, almost 30 years later, these same distinctions were systematically made of existing social relationship scales by Valtorta et al. (Reference Valtorta, Kanaan, Gilbody and Hanratty2016) using the distinction of structural/functional. Interestingly, though named the ‘Lubben Social Network Scale’, the LSNS-6 and LSNS-10 measure both social network and social support (Valtorta et al., Reference Valtorta, Kanaan, Gilbody and Hanratty2016). Indeed, these authors noted that they found many scale labels to be misleading (Valtorta et al., Reference Valtorta, Kanaan, Gilbody and Hanratty2016) and therefore measures may have more overlap than their names suggest. The present study can help us know how important it is to make explicit these distinctions, as it sets out to show empirically and systematically the different prevalence rates based on including structural only versus structural and functional (social support) aspects.
In addition to distinguishing between social network and social support, in the social support literature an additional important difference is between perceived and actual social support. Many scales tap into perceived social support: the perception that support is there when and if needed. This can be differentiated from (actual) social support being needed and/or received or given by an individual. The latter can ideally differentiate between an individual not needing support or not having available support (Lubben, Reference Lubben1988). The former makes no presumption of (nor do scales measure) actual need or exchange of support in response to needs. In cases in which a person may not feel they need help, these types of scales require participants to imagine if they needed help whether it would indeed be available. One such scale is the Medical Outcomes Survey (Sherbourne and Stewart, Reference Sherbourne and Stewart1991) from which we drew items to measure perceived social support (i.e. functional aspect of relationships). We chose tangible and emotional support items we felt most paralleled those contained in the LSNS on levels of closeness and perceptions of help.
Methodology
Data source
The data used for this study derive from the baseline tracking cohort of the CLSA collected starting in September 2011 (baseline data available in 2014) (Kirkland et al., Reference Kirkland, Griffith, Menec, Wister, Payette, Wolfson and Raina2015). The CLSA will follow approximately 51,000 community-dwelling Canadians (aged 45–85) for 20 years. Tracking cohort participants, examined for the purposes of the present study, are interviewed via telephone and live in regions across Canada. A separate sample of comprehensive cohort participants are given extensive physical and psychological assessments at 11 sites across Canada and therefore live near (within a 50 kilometres radius) these sites. Data will be collected approximately every three years (Raina et al., Reference Raina, Wolfson, Kirkland, Griffith, Oremus, Patterson, Tuokko, Hogan, Wister, Payette, Brazil and Shannon2009). The baseline tracking cohort consists of a nationally representative sample of 21,241 participants who completed telephone interviews. Although described elsewhere in detail (Raina et al., Reference Raina, Wolfson, Kirkland, Griffith, Oremus, Patterson, Tuokko, Hogan, Wister, Payette, Brazil and Shannon2009), tracking cohort participants were randomly selected (stratified by age/sex) in each of the Canadian provinces through a combination of random-digit dialling, recruitment through the previously on-going Canadian Community Health Survey (CCHS 4.2) Statistics Canada study and mail-outs through Health Ministries (see Kirkland et al., Reference Kirkland, Griffith, Menec, Wister, Payette, Wolfson and Raina2015). Participants were ineligible for the study based on the following criteria: unable to speak English or French; presence of cognitive impairment; currently residing in an institution; resident of the three territories and some remote regions; living on federal First Nations reserves and other First Nations settlements in the provinces; or full-time members of the Canadian Armed Forces (Raina et al., Reference Raina, Wolfson and Kirkland2008, Reference Raina, Wolfson, Kirkland, Griffith, Oremus, Patterson, Tuokko, Hogan, Wister, Payette, Brazil and Shannon2009).
Sample and weights
For the present analyses, 70 participants were excluded due to ages deviating outside the specified age range of 45–85, resulting in a total of 21,171 (unweighted) participants for the current study. Weights for the tracking cohort were utilised as prepared by the CLSA to improve the accuracy of estimates so that they were representative of the eligible population of provinces within Canada. As specified by the CLSA (2008), trimmed weights were used for descriptive statistics.
Measures
Note that percentages included in this section are weighted.
Socio-demographics
Age
Age was recorded in years (range 45–85). A dichotomised age variable was created for ages 45–64 (67.7%) and 65–85 (32.3%) for comparison purposes.
Sex
Participants’ sex was recorded as male (48.5%) or female (51.5%).
Education
Participants were asked a series of questions related to education level (e.g. graduated high school, highest grades/degrees completed). Based on this information, we distinguished between those who had completed a diploma, certificate or degree beyond high school (70.4%) and those who had not (29.6%).
Living alone and marital status
For co-habitation, participants were asked: ‘How many people, not including yourself, currently live in your household?’ A dichotomous co-habitation variable was created that reflected living alone or living with others. For marital status, participants indicated their current marital/partner status (single, never married or never lived with a partner; married or living with a partner in a common-law relationship; widowed; divorced; separated). A variable was created that reflected being married/common-law or not. In addition, a combined variable was created to reflect living alone and being unmarried/common-law (17.5%) versus living with others or being married/common-law (82.5%) for the purposes of the five-point social isolation scale as described below.
Social variables
Social network: frequency of contact
Participants were asked questions about social network members, including the last time they got together (i.e. in-person) with each group: 1 = within the last day or two; 2 = within the last week or two; 3 = within the past month; 4 = within the past six months; 5 = within the past year; 6 = more than a year ago. Specifically, participants were asked about the following five groups: friends, neighbours, siblings, children and other relatives. For the purposes of the present analysis, we differentiated between friends/neighbours, relatives (siblings/other) and children, similar to Steptoe et al. (Reference Steptoe, Shankar, Demakakos and Wardle2013).
Frequency of contact with friends/neighbours
A combined variable was calculated which reflected participant contact with friends or neighbours: 1 = do not have friends or do not know neighbours or have not gotten together with friends/neighbours in past month (9.6%); 0 = have gotten together with friends/neighbours in past month (90.4%).
Frequency of contact with relatives
A combined variable was calculated which reflected participant contact with siblings or other relatives: 1 = do not have relatives or siblings or have not gotten together with siblings/relatives in past month (29.7%); 0 = have gotten together with relatives in past month (70.3%).
Frequency of contact with children
Finally, for the children variable, 2,232 participants indicated living with children; 2,691 indicated not having children. A dichotomous variable was created for frequency of contact with children: 1 = do not have any children or did not get together with children in past month (23.6%); 0 = has gotten together with children in past month (76.4%).
Social participation, including work
Participants were asked how frequently they participated in eight activities in the past 12 months (family/friendship activities, church or religious activities, sports or physical activities, and educational and cultural activities, service club or fraternal organisations, neighbourhood or community associations, or volunteering). Possible response options were: 5 = never; 4 = at least once a year; 3 = at least once a month; 2 = at least once a week; 1 = at least once a day. For each activity, scores were re-coded as: 1 = monthly participation or more; 0 = less than monthly participation. Responses were summed across the items, resulting in an overall social participation score that could range from zero to eight activities.
We also included work as an additional indicator of social participation. In regards to work, participants were asked if they were completely retired, partly retired or not retired. This variable was dichotomised to reflect working (full/partial) or not (retired). A combined variable was created for the purposes of the social isolation scale (below) that reflected whether a person participated in any monthly activities or worked either part or full time. The combined social participation variable was calculated as: 1 = participates in less than two activities and does not work (5.4%); 0 = participates in two or more monthly activities OR works (94.6%).
Social support: tangible support
Participants completed the Medical Outcomes Study (MOS; Sherbourne and Stewart, Reference Sherbourne and Stewart1991) social support scale. This scale contains questions asking participants how often four types of support (tangible, emotional, affectionate, positive social interaction) are available, if needed. For the purposes of the present study, we used one tangible support item from the MOS that aligned with a similar item from the LSNS. Specifically, people were asked about whether there was someone ‘to help you if you were confined to bed’. Response options included 1 = none of the time; 2 = a little of the time; 3 = some of the time; 4 = most of the time; 5 = all of the time. We dichotomised responses to reflect having this type of support ‘some of the time to none of the time’ (23.0%) or ‘most to all the time’ (77.0%).
Social support: emotional support
We also drew on the MOS to assess participants’ perceptions around having someone to talk to. Specifically, participants were asked about whether there was ‘someone to confide in or talk to about yourself or your problems’. We dichotomised responses to reflect having this type of support ‘some of the time to none of the time’ (15.5%) or ‘most to all the time’ (84.5%).
Health and wellbeing
Health
Measures of perceived health and number of chronic conditions were used to indicate participants’ health status. Participants were asked: ‘In general would you say your health is excellent, very good, good, fair or poor?’ A dichotomous measure was created with 1 = excellent to very good (87.9%) and 2 = fair/poor (12.1%).
Participants were also asked about ‘long-term’ physical health conditions that would be expected to last, or have already lasted, six or more months and that have been diagnosed by a health professional. Participants were asked about 34 chronic conditions which were subsequently collapsed into 16 categories (osteoarthritis/arthritis; respiratory; cardiovascular; diabetes; stroke; dementia or Alzheimer's disease; Parkinson's; multiple sclerosis; neurological – other; gastrointestinal; vision; cancer; osteoporosis; back problems; thyroid; hearing difficulties). To capture hearing difficulties, we included a question that asked participants whether they use any devices (e.g. hearing aid, cochlear implant) for hearing (yes/no). To obtain total scores for number of chronic conditions, responses were summed and were subsequently categorised as four or more chronic conditions (24.1%) or less than four (75.9%) to reflect level of health.
Loneliness and depression
The ten-item version of the Center for Epidemiological Studies Depression Scale (Radloff, Reference Radloff1977) is used as a screening tool for symptoms of depression (not as a diagnostic tool per se). The scale includes questions asking people to consider in the past week how often they experienced various cognitive, physical and emotional symptoms of depression, including feeling lonely. For the purposes of the present study, we used this one item from the scale to measure people's experience of loneliness in the past week and grouped according to: felt lonely never/rarely or some of the time (one or two days per week) (89.6%) versus felt lonely occasionally (three or four days per week) or always (10.4%).
To assess depression, we utilised the full ten-item scale. According to previous research, we re-coded the responses such that responses ranged from zero to three, and reverse-coded the positively worded statements (e.g. Andresen et al., Reference Andresen, Malmgren, Carter and Patrick1994). Possible scores could therefore range from 0 to 30 with higher scores indicating greater risk of depression. Again, using previously established cut-offs for this scale (Andresen et al., Reference Andresen, Malmgren, Carter and Patrick1994), we categorised people based on a cut-off of greater or equal to 10 as having depression symptoms (16.9%) or not (83.1%).
Social isolation: composite scales
Structural social isolation scale (five-point)
We created a social isolation (structural) score by assigning one point each for the following participant characteristics (Menec et al., Reference Menec, Newall, Mackenzie, Shooshtari and Nowicki2019):
• Living alone and unmarried/common law.
• Do not have friends or know neighbours or have not gotten together with friends/neighbours in past month.
• Do not have relatives or siblings or have not gotten together with relatives in past month.
• Do not have any children or did not get together with children in past month.
• Participates in less than two social activities per month and does not work.
To go beyond single indicators of social isolation (e.g. lives alone or no children), a range of 3+ was specified to classify a participant as isolated. As examples, this would mean that someone who lived alone but who had social contact/social participation/work would not be classified as socially isolated. This would also mean, for example, that someone could live with others, but be classified as isolated if they had a combination of not getting together with others outside the household at least once a month or low social participation in activities. Put another way, using a 3+ cut-off allows for substitutions and trade-offs of social relationships (e.g. Berkman and Syme, Reference Berkman and Syme1979). A dichotomised variable classified people as being socially isolated (5.8%) or not.
Structural/functional social isolation scale (three-point)
To create a scale that was similar to LSNS, we incorporated the structural scale as well as tangible social support (help if sick) and emotional social support (presence of confidant). We created a social isolation (structural and functional) score by assigning one point each for the following participant characteristics:
• Low social contact based on five structural items (three or more out of five).
• Low emotional support (have a person to confide in none of the time or some of the time).
• Low tangible help (have someone to help if sick none of the time or some of the time).
Again, to go beyond single indicators, we identified socially isolated adults based on this scale as scoring 2+ out of 3. This would mean that someone who was identified as isolated could score 1 on all of these indicators (i.e. lack social contact and social support), or be socially connected based on the structural items (= 0) but lack the two forms of social support, or have a combination of lack of social support/social contact. This also means a person who lacked only one form of social contact/social support (i.e. scored 1) would not be classified as being socially isolated. Finally, like the LSNS-6, if a person was socially connected based on the structural items only, they would still be classified as being socially isolated.
Results
Identifying socially isolated adults using different indicators
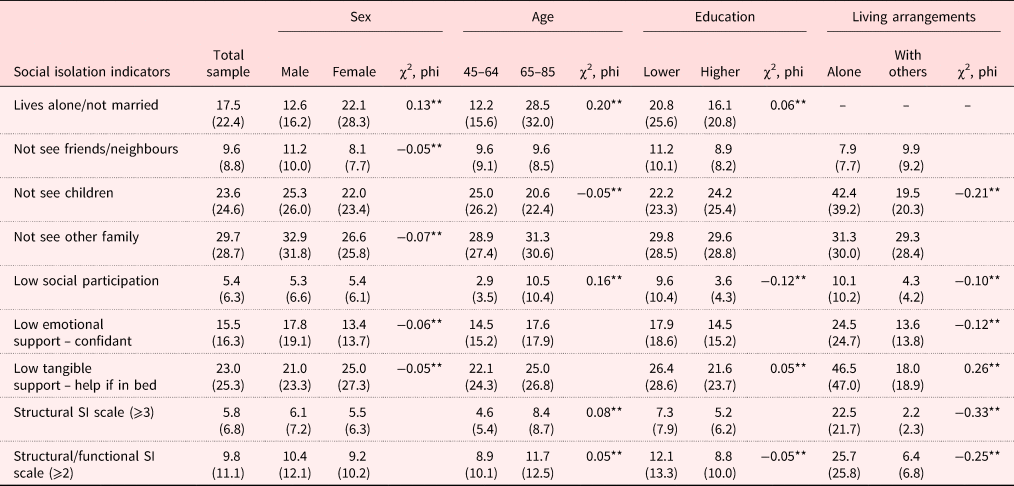
Table 1 shows for the total sample, as well as by sex, education, age group and living arrangements the proportions who can be characterised by single-item social isolation indicators. The proportions of people who could be classified as socially isolated based on the structural social isolation scale as well as the structural/functional social isolation scale are also shown. Chi-square analyses were completed to compare groups (e.g. males/females) and phi values are shown (Table 1), effect size indicators equivalent to correlation coefficients.
Social isolation (SI) indicators for total sample, and by sex, age, education levels and living arrangements

Notes: Values are weighted-trimmed percentages, with unweighted percentages in parentheses. Only phi values ⩾ 0.05 shown. N = 21,171 unweighted.
Significance level: ** p < 0.001.
To begin with single indicators, 17.5 per cent of the total sample could be categorised as socially isolated based on the indicator of living alone. A larger proportion of females (22.1%) would be categorised as socially isolated compared to males (12.6%). Moreover, those aged 65+ (28.5%) and those with a lower level of education (20.8%) are more likely to be living alone compared to their counterparts. Unsurprisingly, based on reported Canadian household statistics (Statistics Canada, 2017), females aged 65+ are the most likely to be living alone at 40.8 per cent (versus 16.5 per cent for males aged 65+) (not shown).
If we used a single network indicator like low contact with friends/neighbours, 9.6 per cent of the sample could be categorised as socially isolated (Table 1); and, in this case, males (11.2%) compared to females and those with lower education (11.2%) would be the groups most likely to have low contact with friends/neighbours (and be socially isolated). If we were to focus on low social contact with children, a fairly large proportion (23.6% of total sample) could be classified as socially isolated, and males (25.3%) compared to females, those aged 45–64 (25.0%) and especially those living alone (42.4%) would have the highest prevalence of social isolation based on this one indicator.
In contrast to these relatively higher levels of social isolation, if we were to focus our attention on ‘low social participation’ as a defining feature of social isolation (Table 1), 5.4 per cent of the total sample would be considered socially isolated. Higher proportions are seen in the older age groups and those with lower education at 10.5 and 9.6 per cent, respectively.
Turning to the perceived social support variables, 15.5 per cent of the total sample indicated lacking a readily available confidant and males are more likely to show this deficit in social connection than females (17.8% versus 13.4%). Twenty-three per cent of the total sample lacked tangible help; and, in this case, females were more likely to show this deficit (25.0% versus 21.0%) though for both sexes the prevalence of this ‘lack’ could be considered high.
Next, we can consider the composite scales: the structural social isolation scale and the structural/functional scale. Based on the structural items and a cut-off of 3+, we can see that 5.8 per cent could be classified as being socially isolated. These proportions are similar for males/females, though we can see that the socially isolated are more likely to be age 65+ (8.4%) and of lower education (7.3%). Females aged 45–64 (3.9%) had the lowest prevalence rates based on this scale (not shown). This is of interest, especially given the much higher proportions of females living alone (a variable included in this structural scale).
Turning to the structural/functional social isolation scale, we can see that social isolation prevalence would increase to 9.8 per cent for the total sample (Table 1). Note that this higher percentage reflects the fact that this scale would identify as socially isolated those who may not lack social contact (based on the structural measure) but lack social support; and conversely, this scale would not identify as socially isolated those who lacked social contact but had sufficient social support. Based on this structural/functional scale, and similar to the structural scale, older adults aged 65–85 (11.7%) and those of lower education (12.7%) had higher prevalence rates compared to their counterparts. Also, like the structural scale, for the structural/functional scale the group least likely to be socially isolated were females aged 45–64 (7.9%) (not shown).
Of note, when we compare those living alone and living with others on the composite scale outcomes, we see that the prevalence of social isolation for those living alone is very high compared to those living with others. This is not exactly surprising, given that both scales include ‘living alone’ as a variable as part of their respective scales. Nonetheless, it is of interest to see that 2 per cent of those living with others (compared to 22.5% of those living alone) would be considered socially isolated based on the structural scale. However, 6.4 per cent of those living with others (compared to 25.7% of those living alone) would be considered socially isolated based on the structural/functional scale.
In sum, based on all our single or composite indicators, we see a range of social isolation prevalence (for total sample of 45–85 year olds) from 5.4 per cent (based on social participation) to 29.7 per cent (based on not having gotten together with other relatives in the past month).
Associations between social isolation indicators and health and wellbeing outcomes
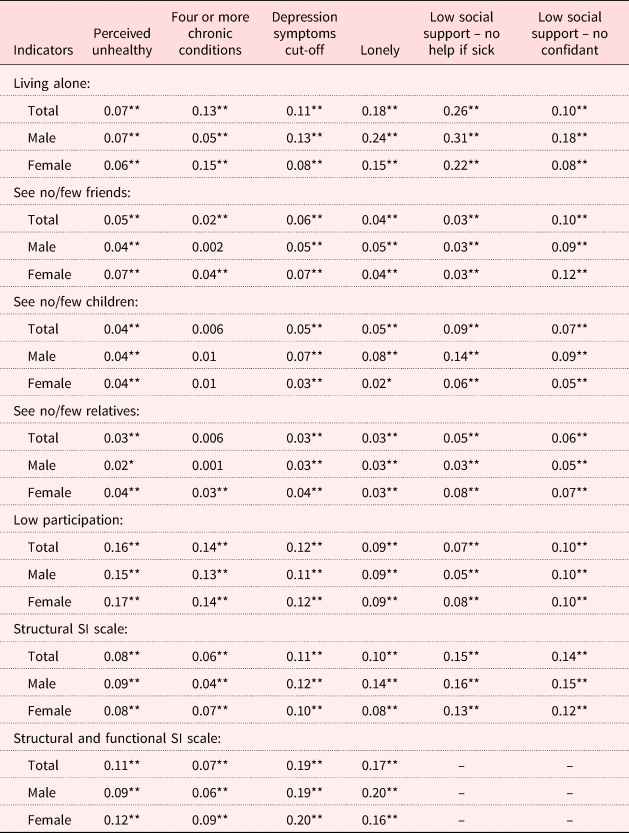
Table 2 shows the bivariate correlations with the five single-item social isolation indicators and the two composite scales and the health and well-being outcomes, by total sample and for males and females. Results suggest the relationship between social isolation indicators and the outcomes are, for the most part, weak to moderate (ranging from ± 0.007 to 0.26). Moreover, it appears that for the various outcomes, not one specific indicator seems to be driving associations.
Spearman's bivariate correlations between indicators and health and wellbeing outcomes, by total sample and sex

Notes: Weighted-analytical shown only. SI: social isolation.
Significance level: * p ⩽ 0.05, ** p ⩽ 0.001.
Some noteworthy patterns can be pointed out. For example, living alone consistently has moderate associations with the outcomes, with some associations differing by sex. In particular, for females, there was a stronger association between living alone and chronic conditions as compared to males. Interestingly, the opposite pattern of results is seen for the well-being measures of depression and loneliness, as well as social support: compared to females, there is a stronger association for males between living alone and being depressed, lonely or having lower social support. This pattern of results suggests that living alone does not play as big a role for emotional well-being for females as for males.
Indeed, living alone as well as social participation had the strongest (yet still moderate) associations with all of the outcome variables. In comparison, network variables like frequency of seeing friends, family or children had weaker associations, the exception of friends being associated with social support (presence of a confidant) for males and females, and not seeing/having children being associated with loneliness and lack of tangible support for males.
In sum, the social network variables had mostly weak associations with the health and well-being outcomes. Living alone was associated with the well-being and social support variables, especially for males, and social participation was associated with the health outcomes.
Going beyond single indicators and turning to the composite measures of social isolation, we can see that both composite scales had the strongest associations with the well-being outcomes. There were little differences in associations between males/females. An exception is that the association between the structural social isolation scale and loneliness was higher for males (r = 0.14) than for females (r = 0.08). The structural/functional scale was more strongly associated with loneliness than the structural scale, showing how loneliness and social isolation may have a range of correlations depending on definitions.
Discussion
There are many terms used to describe our social relations or social connection and we have reviewed and utilised some of them in the present paper: social network, social support, social participation, social isolation. In many respects, there are separate (non-overlapping) literatures for each of these concepts. When it comes to the concept of social isolation, we have argued that, taken together, researchers are ultimately trying to describe, define and quantify a ‘lack’ or an inadequacy of social connection. Different studies do this differently, drawing on social aspects that are more structural, functional or both.
In the present paper, we do not have conclusive answers in regards to defining social isolation, but, by systematically providing, within the same sample, various definitions from single-item indicators to the more complex, this adds to our understanding of how using different definitions leads to different prevalence rates (e.g. Eckhard, Reference Eckhard2018). Although we take the stance of keeping distinctions between structural and functional aspects of social relationships to retain conceptual clarity, we also acknowledge the different information that these aspects can together provide about the social world of older adults.
‘Lack’ based on structural indicators
When defining ‘lack’ of social connection based on structural indicators, prevalence rates of social isolation among adults aged 45–85 ranged from 5.4 per cent (low social participation) to 29.7 per cent (have not gotten together with relatives in past month) (Table 1). Discussed in more detail below, if we used the one-item indicator of living alone, 17.5 per cent were socially isolated. Notably, prevalence rates differed by age group. For example, one of the biggest differences between younger and older adults emerged for social participation (2.9% versus 10.5%). Of note, the extent of this difference most likely reflects that younger adults are participating in the workforce.
Similar to Chappell and Badger's (Reference Chappell and Badger1989) indicator of social contact, although relatively large proportions of people showed a ‘lack’ of contact (got together) with friends, children and other family, these indicators were weakly correlated with the health and well-being outcomes (Table 2). It is possible that more variation and stronger associations may have been found with indicators of contact including via the telephone or, at least for our study, via email and social media. Considering that many people will have family and friends who are geographically distant, it would be of interest to compare and contrast indicators of ‘in-person’ contact with other forms of contact (see ‘Study limitations’).
Using the composite structural social isolation scale, we identified 5.8 per cent socially isolated adults aged 45–85 based on only structural aspects (Table 1). These prevalence rates differed for different age groups (4.6% aged 45–64; 8.4% aged 65–85), reflecting almost a doubling of socially isolated individuals at 65+ compared to ages 45–64. That social isolation increases with age is consistent with previous research (e.g. Eckhard, Reference Eckhard2018). Similar to our findings, Eckhard (Reference Eckhard2018) reported a prevalence rate for those aged 56+ based on the social contact measure of approximately 8 per cent and that prevalence increases with age, particularly for females. However, compared to Steptoe et al. (Reference Steptoe, Shankar, Demakakos and Wardle2013) using similar items to create their Social Isolation Index, our prevalence rate is low. This may not be surprising, given that Steptoe used a data-driven approach to create a cut-off at the highest quintile (using a cut-off of 2+ out of 5), thus reporting 19 per cent socially isolated (aged 52+). Note that had we used a cut-off of 2+ out of 5, we would have reported a social isolation prevalence of 22.5%.
As a comparison point to the composite scales, we included in our analyses whether people lived alone or not because: living alone predicts loneliness, there is a trend that more adults are living alone in Canada and because it is typically used in definitions of social isolation (De Jong Gierveld, Reference De Jong Gierveld1987; Statistics Canada, 2017). Results in regards to living alone suggest some interesting patterns. Overall, results showed 17.5 per cent of those aged 45–85 lived alone/were un-partnered (Table 1). However, unsurprisingly, sex differences emerged (22% of females versus 13% males) which become even more disparate as we consider female and male adults aged 65–85 (41% females versus 17% males). Interestingly, although results show that females were much more likely to be living alone compared to males, when we compare the single-item indicator of living alone to the composite social isolation scale, we see that females were slightly less likely to be identified as socially isolated than males (Table 1). These findings are striking, given the living alone variable is incorporated in the composite scale, and results suggest that females are ‘substituting’ or making trade-offs (Berkman and Syme, Reference Berkman and Syme1979) in terms of their social connections in ways that buttress the effects of living alone. These types of substitutions can similarly be seen in studies using a network typology approach and examining sex/co-habitation differences (e.g. Smith and Victor, Reference Smith and Victor2019). Indeed, although females are more likely to live alone than males, they are less likely than males to have low contact with friends, children and relatives. As well, they are slightly more likely to have higher social participation (Table 1).
Although considered a ‘structural’ aspect of relationships, the living alone variable appears to be inextricably tied to isolation, support and loneliness perhaps in ways that are dissimilar to other variables and perhaps especially for males, as bivariate associations were stronger for males compared to females. This has relevance for organisations wanting to utilise quick single-item social isolation indicators available in a census database to pinpoint areas of vulnerability, for example. We acknowledge that it may be factors related to living alone that may be accounting for such bivariate relationships (Chappell and Badger, Reference Chappell and Badger1989), nonetheless this variable is of use as a target variable. Based on these bivariate correlations, the living alone variable may be particularly useful in identifying males who are at risk of poorer well-being. The variable seems less informative in identifying deficits in social connection for females and may overestimate social isolation as defined as lack of social relationships.
‘Lack’ based on functional characteristics
Drawing on functional indicators to characterise social isolation, results showed that prevalence of social isolation among adults aged 45–85 ranged from 15.5 per cent (low emotional support – confidant) to 23.0 per cent (low tangible support). The most striking difference here is the comparison between people who had low tangible support living alone (46.5%) versus living with others (18.0%). Given that we used an item asking about ‘help if confined to bed’, this difference may not be surprising. However, it highlights that almost half of people living alone would potentially not have someone to help them if extremely ill (or at least they perceive they do not). This indicator may be particularly useful for emergency preparedness personnel to get a sense of vulnerability: do people have someone to help them in extremely vulnerable situations? That is, emergency personnel may be more interested in gauging people's ‘lack’ of tangible help than in tracking someone's emotional support or living situation. Indeed, it is revealing that 18 per cent of those living with others indicated lacking this form of social support. It is possible that this reflects care-giving roles that are not necessarily reciprocal.
Based on the LSNS (Lubben, Reference Lubben1988), we created a composite scale combining the functional and structural items. Compared to the structural social isolation scale, we found that the percentage of socially isolated adults identified with the structural/functional social isolation scale increased from 5.8 to 9.8 per cent among adults aged 45–85. Like the LSNS, this structural/functional measure captures how people can have a social network (quantity) but may or may not feel supported by it. Of course, it is also designed to capture how people may have an ‘inadequate’ social network but can feel support. As mentioned above, people may feel they lack social support if they are care-giving for others (and thus have a social network but may be doing more ‘giving’ than ‘receiving’ support) or may reflect people having a network whom they simply do not trust with intimate matters. More broadly, the types of relationships in a social network (e.g. more or fewer friends/relatives) may provide different forms of perceived social support (e.g. Harasemiw et al., Reference Harasemiw, Newall, Shoostra, Mackenzie and Menec2018). Ultimately, results show clearly that prevalence rates vary depending on definitions used, and emphasise the importance of researchers selecting/creating measurement tools that reflect the aspects of social connection they are intending to assess (Valtorta et al., Reference Valtorta, Kanaan, Gilbody and Hanratty2016).
Similar to the structural social isolation scale used in the present study, using the structural/functional social isolation scale, we found that a higher proportion of older adults (11.7%) were identified as being socially isolated as compared to younger adults (8.9%). Interestingly, if we compare our age 65+ results with studies using the actual LSNS-6 (Lubben et al., Reference Lubben, Blozik, Gillman, Iliffe, von Renteln Kruse, Beck and Stuck2006; Blozik et al., Reference Blozik, Wagner, Gillmann, Iliffe, von Renteln-Kruse, Lubben, Beck, Stuck and Clough-Gorr2008), our reported prevalence rate (11.7%) is similar to that reported for those aged 65+ in Switzerland at 11 per cent, but lower than that found for the UK (15%) or Germany (20%). Moreover, the present study prevalence rate is lower than the 17 per cent reported by a Canadian study out of the province of British Columbia using the LSNS-6 (Kobayashi et al., Reference Kobayashi, Cloutier-Fisher and Roth2009), although the sample for their study included those 85+ and was drawn primarily from small towns/cities. Notably, all of these studies included those aged 85+, unlike the present analysis.
Compared to the structural social isolation scale, the structural/functional scale appears to be more predictive of the health and well-being outcomes, and especially to loneliness and depression (Table 2). That is, although we cannot show causal direction with this study, the bivariate results show that a higher score on this LSNS-type scale is associated with higher levels of depression and loneliness, for both males and females. This trend is not entirely surprising as the structural/functional composite scale is tapping into people's more qualitative feelings/functions of their relationships. These results again underline that correlations between loneliness and social isolation depend on definitions and measures used.
Study limitations
Although this study capitalises on being able to compare a number of social isolation indicators in the same sample, we are still restricted by the items contained in the database. A weakness to the present study is that questions surrounding social contact were confined to ‘getting together’ and thus did not include email, telephone, social media, etc., reflecting additional ways that people may be contacting their network. Just as one example, it was noted that a fairly high proportion of individuals would be classified as socially isolated based on the one-item variable of not frequently ‘getting together’ with children. An indicator like this, however, may indicate that participants do not live in the same city as their children, and so may be in contact with children in alternative ways to in-person contact. Unfortunately, we were not able to capture these alternative ways of connection. At the same time, an advantage to the way in which contact was measured here is that we can get a clear sense of actual in-person contact. This precludes including as socially connected someone who may not actually have any monthly in-person contact. Another limitation to the present study is that results show bivariate associations at baseline; thus results cannot show directionality nor cause and effect.
Conclusions
The CLSA provides a rich amount of data on the social connection of adult Canadians. We were able to examine single-item indicators of social network, social participation and support, as well as create and contrast composite indicators drawing on structural and functional social aspects. To conclude, this study adds to the discussion of definitions of social isolation and provides comparison points for other similar studies also attempting to compare definitions and associated cut-off points using large population-based data-sets (e.g. Eckhard, Reference Eckhard2018). By comparing single-item definitions with more composite definitions, this study shows that an indicator like living alone, though it may overestimate social isolation as defined as ‘lack’ or ‘absence’ of social contact, still provides useful information about potential gaps in social support and possible associations with poorer well-being. Given that an indicator like living alone may be more readily available than composite assessments of social connection, this is relevant information. Relatedly, this study adds to the ongoing discussion of the complexities and nuances of choosing appropriate social isolation measures (e.g. Valtorta et al., Reference Valtorta, Kanaan, Gilbody and Hanratty2016), suggesting careful consideration by researchers of what aspect of social connection they are trying to assess (e.g. structural, functional, both) and clarity and transparency of conceptual and operational definitions.
Data
This research was made possible using the data collected by the Canadian Longitudinal Study on Aging (CLSA). Funding for the CLSA is provided by the Government of Canada through the Canadian Institutes of Health Research under grant reference LSA 9447 and the Canada Foundation for Innovation. This research has been conducted using the CLSA Baseline Tracking data-set version 1.1 (application number 141205). The CLSA is led by Drs Parminder Raina, Christina Wolfson and Susan Kirkland.
Author contributions
NEGN wrote the first drafts and both NEGN and VHM worked on the ideas together and wrote the manuscript.
Conflict of interest
The authors declare no conflicts of interest.