I. INTRODUCTION
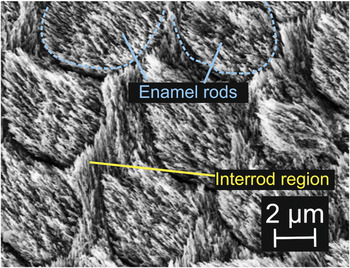
Dental enamel is able to maintain its structural integrity under mechanical loading conditions in the oral environment. A better understanding of its structure–property relationships is a basis for improvements in restorative as well as preventive dentistry. Compositionally, enamel contains ∼90% of apatite crystallites, ∼8% of water, and ∼2% of organic matrix by volume.Reference Healy, Black and Hastings1 Structurally, enamel consists of three levels of hierarchical structures. Level 1 consists of ∼50-nm-diameter apatite fibersReference Frazier2, Reference Daculsi and Kerebel3 surrounded by 1- to 2-nm-thin organic layerReference Daculsi and Kerebel3 that are closely bundled together (to form enamel rods at level 2). Level 2 consists of ∼2- to 4-μm enamel rods that span from the dentino-enamel junction (DEJ) to near tooth surface.Reference Gray, Bannister, Berry and Williams4 Groups of enamel rods form Hunter-Schreger bands at level 3.Reference Nanci5 Within each band, the enamel rods have similar local orientations but different from the neighboring bands. This feature is prevailed in the inner enamel near DEJ. At level 2, “interrod” regions were observed between rods where the crystallite orientations are significantly different from those in the center of the rodsReference Bajaj and Arola6, Reference Glimcher, Daniel, Travis and Kamhi7 and are relatively organic-rich.Reference Maas and Dumont8 The cross sections of enamel rods and the accompanying interrod regions are shown in the scanning electron microscopy image in Fig. 1.
A scanning electron microscopy (SEM) image showing the cross sections of enamel rods: the enamel rod and interrod regions. (The polished enamel surface was etched with 35% phosphoric acid for 10 s, rinsed under pipe water, and left in a dessicator for several hours before put in SEM imaging with 5 kV.)

It is often said that proteins and peptides contribute to the toughness of biomineralized materials (dentin, bone, enamel, nacre) through their extensive nonlinear deformation. Indeed, energy loss occurs when a protein or peptide is stretched even at very small strains.Reference Carlisle, Coulais and Guthold9 The interrod regions of enamel are relatively organic-rich compared to the enamel rod region and are therefore expected to exhibit hysteresis, higher inelastic energy dissipation, greater displacement under constant load (creep), lower viscosity, and a higher relaxation time for stress relaxation. Previous nanoindentation studies of enamel rod and interrod regions showed that the elastic modulus and hardness in the enamel rod region are higher than in the interrod regions.Reference Habelitz, Marshall, Marshall and Balooch10, Reference Ge, Cui, Wang and Feng11 The differences observed by Habelitz et al.Reference Habelitz, Marshall, Marshall and Balooch10 may be a result of different crystallite orientations in the two regions. In comparison, Ge et al.Reference Ge, Cui, Wang and Feng11 observed ∼50% higher elastic modulus and hardness in the enamel rod compared to the interrod region. To date, no emphasis was placed on the time-dependent property comparisons of these two regions, which may be attributed primarily to proteins but not the minerals present.
Nanoindentation has been used to characterize the time-dependent behaviors of biological materials.Reference Oyen and Cook12 Mencik et al.Reference Mencik, He and Swain13 fitted the nanoindentation data with constant load holding period by a rheological model comprising of a series of springs and dashpots to derive the time-dependent material parameters of enamel. However, their indentation areas encompass several enamel rods and did not resolve the difference between the enamel rod and interrod regions. Nanoindentation-based time-dependent properties could also be derived by utilizing single load–unload function with different ramping rate.Reference Oyen14 More elastic–viscoelastic–plastic models for Berkovich indenters have also been derived and compared to nanoindentation data of bone and polymers.Reference Oyen and Cook15, Reference Olesiak, Oyen and Ferguson16
This study aims to probe the mechanical property differences of enamel rod and interrod regions in enamel, with a focus on the contribution of time-dependent behaviors from organic matters. We used spherical indentation with ∼1-μm-radius tip to perform nanoindentation on enamel in a liquid environment. Single load–unload curve tests were used to calculate the elastic modulus, hardness, and energy dissipation for the enamel rod and interrod regions. In addition, in creep tests at constant load, energy dissipation, viscosity, and stress relaxation behaviors for both regions were determined.
II. THEORY
A. Elastic modulus and hardness
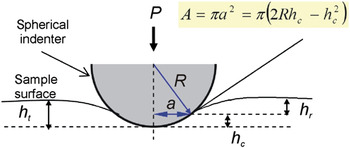
Figure 2 shows a spherical indenter in contact with a specimen surface. The projected indentation contact area, A, can be related to the indentation radius a, the indenter radius R, and the contact depth h c with

A schematic diagram of an elastic contact between an ideal stiff spherical indenter and the surface of an indented specimen. P is the applied load, R is the radius of the spherical indenter, and a is the radius of the indentation area. h t is the total indentation depth, h c is the depth of the contact area, and h r is the residual depth.

The elastic contact of a spherical indenter on an elastically isotropic material can be described byReference Hertz17:
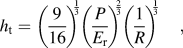
with h t the total penetration depth, P the applied load, and E r the reduced elastic modulus. With known indenter radius, plotting h t versus P 2/3 from the initial part of the loading curves show a linear relationship as long as the contact is still elastic, which is usually the case for small penetration depth. E r can then be calculated from the slope. As E r is calculated from the loading curve, it is termed E r,loading.
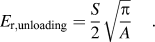
E r can also be calculated from the unloading curve. First, the unloading curve is plotted as h t versus P 2/3, where the slope Q is derived.Reference Field and Swain18 Next, differentiating the equation h t= QP 2/3 gives dh t/dP = (2/3)*Q*P −1/3. By inserting the load upon unloading as P and the derived Q, the stiffness, S = 1/(dh t/dP) can be calculated. Oliver and PharrReference Oliver and Pharr19 showed that the residual depth, h r in Fig. 2 for a paraboloid can be described by
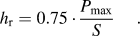
The contact depth, h c is
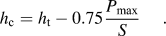
The reduced elastic modulus can be calculated from the unloading slope by
The hardness, H can be calculated by dividing the maximum load with the contact area at that point

B. Energy dissipation
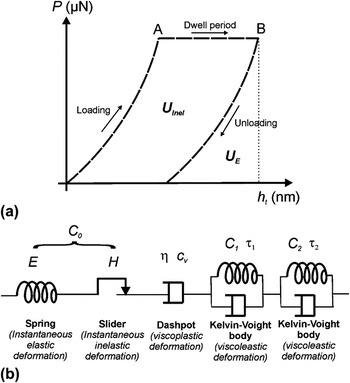
The calculation of energy dissipation from a nanoindentation is described previously by He and Swain.Reference He and Swain20 The mechanical work done is the product of applied force and resultant displacement. Therefore, the area under the loading curve as well as under the dwell period until point B in Fig. 3(a) corresponds to the total mechanical work done to the sample during the indentation, U T. Similarly, the area under the unloading curve corresponds to the elastic energy recovered from the work U E. The inelastic energy U Inel can be calculated from the difference between the U T and U E, which is the area between loading and unloading curves:

(a) A schematic drawing of load (P)–penetration (h t) curve of nanoindentation. The loading profile includes a dwell region from A to B by holding at a constant load. The area under the curves represents energy dissipated, with U E the elastic energy dissipated and the U Inel the inelastic energy dissipated. (b) The material’s deformation of the dwell region in (a) can be modeled by several elements connected in series: a spring, a slider, a dashpot, and Kelvin–Voigt bodies. The parameters involved are compliance C 0 (which is a function of elastic modulus and hardness), viscosity of the dashpot η, and the compliance and time constants of Kelvin–Voigt bodies C 1, C 2, τ 1, and τ 2.

The “Inelasticity index” can also be used to calculate the ratio of the inelastic energy to total energy for an indentation byReference He and Swain20

C. Creep
Creep here refers to the displacement induced during holding at maximum load in Fig. 3(a). For similar stress levels, this creep response can be used to compare the resistance of materials against time-dependent deformation.
D. Creep compliance
The elastic constants in Eq. (2) can be replaced by a time-dependent integral operatorReference Lee and Radok21–Reference Oyen23 for the characterization of viscoelastic response from the indentation. Equation (2) can be written as
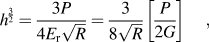
with G the shear modulus, and the term [P/2G] can be replaced by a viscoelastic hereditary integral operator for creep
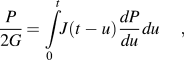
with u a dummy variable for integration. For a constant load holding following a step change of load from 0 to P max,
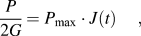
with J(t) the creep compliance function. For viscoelastic deformation that can be modeled as a spring (that describes elastic deformation), in series with a slider (instantaneous inelastic deformation), a dashpot (viscoplastic process), and one or more Kelvin–Voigt bodies (a spring parallel with a dashpot) (viscoelastic processes) [Fig. 3(b)], the compliance function J(t) isReference Mencik, He and Swain13

with C 0 the compliance constant that is related to the instantaneous elastic modulus and hardness [C 0 = f(E,H)], c v is related to the viscosity of the dashpot as c v= 1/η, Cj and τj are compliance constants and the retardation time of the jth Kelvin–Voigt body. Cj can be related to the shear moduli Gj and Poisson’s ratio υj by Cj = (1−υj)/Gj.
However, an instantaneous step change of load from 0 to P max is difficult to realize. Usually, the load can be increased from 0 to P max by applying a ramp loading at constant loading rate. In this case, a ramp correction factor, ρj,Reference Oyen14 should be included into the Kelvin–Voigt bodies where

with t R the rise time for the load to increase from P = 0 to P = P max. Equation (12) becomes

Similarly, the term c vt in Eq. (12) that represents dashpot is modified as c v(t−t R/2), assuming the indenter penetration during the t R equals to the indenter penetration that resulted from an average force of P max/2.Reference Mencik, He and Swain13 Therefore, the creep compliance function for a constant load holding following a ramp loading at constant loading rate can be described by

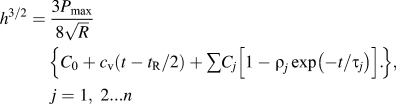
To summarize, the dwell region in Fig. 3(a) for spherical indentation, when the mechanical behavior is approximated with a combination of a spring, a slider, a dashpot, and one or more Kelvin–Voigt bodies connected in series [Fig. 3(b)], could be described byReference Mencik, He and Swain13
E. Viscosity under steady state
As derived by Sakai and Shimizu,Reference Sakai and Shimizu24 the constant creep loading for a viscoelastic fluid in steady state for a spherical indenter can be described by
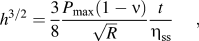
with η ss the viscosity at the steady state.
F. Stress relaxation
The data for the dwell period in Fig. 3(a) could also be used to calculate stress relaxation behavior. Firstly, the stiffness, S, from the unloading curve and the subsequent h c upon unloading at point B in Fig. 3(a) could be calculated, described under Section II.A. It has been previously shown that the ratio of the h c and h t for enamel is almost a constant.Reference He and Swain25 Therefore, the ratio of the h t/h c at point B in Fig. 3(a) is first calculated. This ratio was then used to calculate h c based on the known h t for every data point for the dwell period between points A and B. The indentation area is then calculated based on Eq. (1). The mean pressure, P m, is calculated by

As outlined in a previous study,Reference He and Swain25P m versus t could be fitted with Kohlrausch–Williams–Watts (KWW) modelReference Williams and Watts26

where β is the power law component with values in the range 0 ≤ β ≤ 1, P mo is the instantaneous stress, and τ is the effective relaxation time constant. When β = 1, the model is called Debye or Maxwell (DM) relaxation modelReference Dorrington27

III. MATERIALS AND METHODS
A. Materials
Human third molar teeth were utilized for the nanoindentation. The teeth were removed prior to orthodontic procedures according to the procedures approved by the Ethics Committee of the Medical Association Hamburg. After extraction, the teeth were disinfected in 0.1 wt% thymol before storing in Hank’s Balanced Salt Solution (HBSS, Invitrogen, Gibco Invitrogen Cell Culture, Carlsbad, CA). The teeth were cut at the junction between crown and root, and the root was discarded. The tooth surface facing the root was then glued onto a solid steel cylinder. The cuspal region of the teeth were polished, first with an abrasive paper of grit 4000, followed by 1-, 0.25-, and finally 0.05-μm diamond suspensions (Bühler, Düsseldorf, Germany). The polished tooth was then glued face-up on a steel plate with wax for subsequent investigation with nanoindentation. The polished tooth surface was investigated in regions where enamel rods were oriented parallel to the nanoindentation direction (Fig. 1).
B. Methods
The nanoindentation experiments were performed using a Triboscope indenter system (Hysitron, Minneapolis, MN) mounted on an atomic force microscope (AFM) dimension controlled by Nanoscope VI (Veeco, Santa Barbara, CA). The sphero-conical indenter (Hysitron) has a long shaft (suitable to perform nanoindentation in liquid) and a diamond tip of ∼1-μm radius. The indenter tip radius was calibrated on a fused quartz sample (Hysitron) (Er = 69.6 GPa) according to the procedures described before.Reference Ang, Bortel, Swain, Klocke and Schneider28 The initial parts of these loading curves (h t = 6–60 nm) display linear behavior and were used to obtain the radius R.
All indentation tests on human enamel were done in distilled water. Each series of indentation tests were completed within 12 h. Distilled water was chosen over HBSS as the liquid medium because salt layer would otherwise be built on the sample surface (observed with AFM scanning). Habelitz et al.Reference Habelitz, Marshall, Balooch and Marshall29 investigated the effect of storing dental enamel in deionized water for 1 day—the measured reduced elastic modulus and hardness seem to be lower after storage but still lies within the error range of the measurements on a fresh sample. Therefore, the use of distilled water in the current experiment within 12 h is not expected to cause significant change of mechanical properties.
Two loading profiles are used (described below). Each of these loading profiles was loaded on one tooth sample. The number of measurements per loading functions is 5.
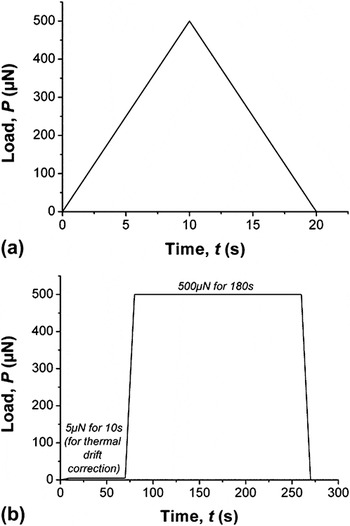
Constant rate load–unload profile [Fig. 4(a)]—(i) loading from 0 to 500 μN (50 μN·s−1) and (ii) unloading from 500 to 0 μN (50 μN·s−1).
(a) Load–unload and (b) load–hold–unload loading functions.

Load–hold–unload with constant rate loading and unloading [Fig. 4(b)]—(i) loading from 0 to 5 μN (0.2 μN·s−1), (ii) holding at P = 5 μN (60 s), (iii) loading from 5 to 500 μN (50 μN·s−1), (iv) holding at P = 500 μN (180 s), and (v) unloading from 500 to 0 μN (50 μN·s−1). Step (ii) is used for manual thermal drift correction. It is assumed that holding at such a low load does not cause increasing depth and the depth change over time is due to thermal drift. The thermal drift (nm/s) is calculated and is assumed to be linear. These drifts were then subtracted from step (iv) above to remove the thermal drift contribution during the dwell period. This methodology to remove thermal drift contribution has proven to be robust by applying the same loading function and the subsequent correction on sapphire. The displacement of sapphire surface after this correction methodology is <2 nm. Since sapphire should not exhibit creep under this loading profile and in room temperature, this <2 nm displacement represents the displacement uncertainty of the correction.
One tooth was used for each indentation loading profile in Figs. 4(a) and 4(b). For each loading profile, five indentations were done each in the enamel rod and interrod regions. The interrod region could be recognized by the <3-nm depressions due to polishing effect. The sampling rates for the load–unload and the load–hold–unload are 400 and 30 Hz, respectively.
For statistical analysis, p-value is calculated to determine whether the differences of two regions are statistically significant. For a significant level of 0.05, when p-value < 0.05, the mechanical properties of both regions are statistically significantly different.
IV. RESULTS
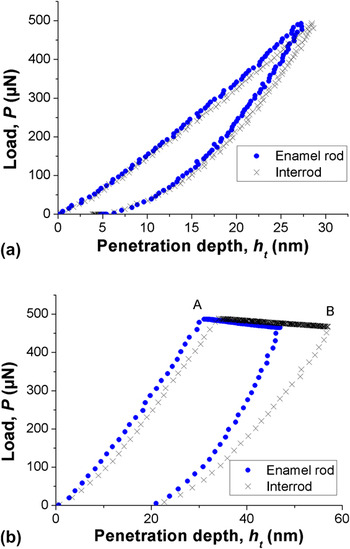
The indenter radius from tests on fused silica was calibrated to be R = 889 ± 19 nm. The polished enamel samples have a surface roughness of <1 nm. The thermal drift for load-hold-unload profile measurements was measured to be 0.4–0.8 nm/s. For the load–unload measurements, the maximum penetration depth is h t = 26–30 nm and corresponds to a contact radius of ∼200 nm. For load-hold-unload measurements, the maximum penetration depth is h t = 47–57 nm and corresponds to a contact radius of 225–280 nm. Sample loading curves, each for the load-unload and load-hold-unload, are shown in Figs. 5(a) and 5(b), respectively.
Nanoindentation curves loaded under (a) a load–unload and (b) a load–hold–unload loading functions with a dwell period from point A to point B.

The analyses of the mechanical properties were carried out as described in Section II. For the analysis of “Creep Compliance,” different combination of spring, slider, Kelvin–Voigt bodies, and dashpot were evaluated. When Kelvin–Voigt bodies were included in the analysis, the creep compliance and the time constant were negative, thus unrealistic. The best fit was the combination of a spring, a slider, and a dashpot with R2 > 0.99 (R2 = 1 means perfect fitting) with the equation

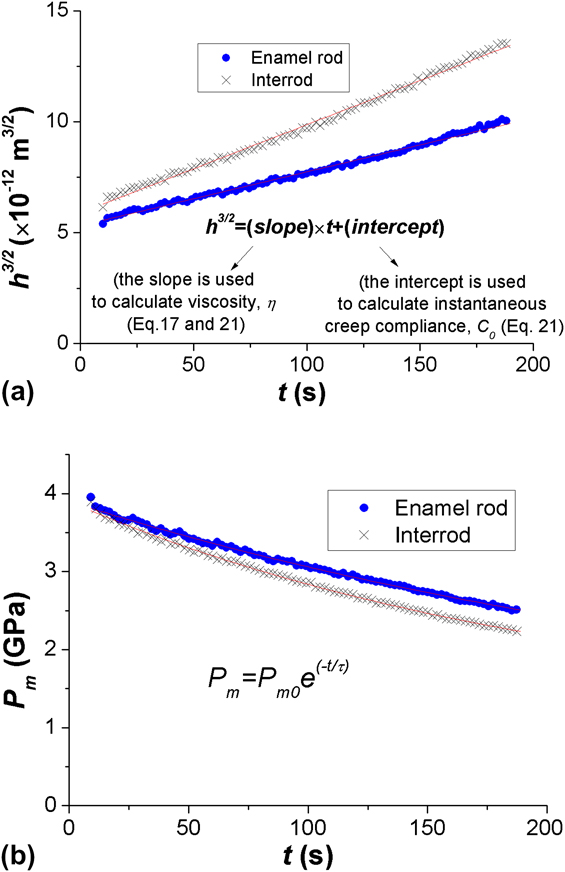
Plotting h 3/2 versus t yields a linear equation, where the slope is first used to calculate viscosity η then intercept can be used to calculate C 0. One example of the curve fitting for Eq. (21) is shown in Fig. 6(a). Note that the same slope was also used to calculate the viscosity of a steady state viscous fluid according to Eq. (17). For the analysis of stress relaxation, DM model [Eq. (20)] is found to yield better fitting than KWW model [Eq. (19)]; the fitting with DM model generates curve with R2 > 0.99, one example is shown in Fig. 6(b).
The data from the dwell period from point A to point B [Fig. 4(b)] are used to plot (a) h t3/2 versus t [to calculate the viscosity, η from the slope, and the instantaneous creep compliance, C 0 according to Eqs. (17) and (21)] and (b) P m versus t [to calculate the effective relaxation time constant according to Debye or Maxwell model in Eq. (20)]. Curve fittings with Eqs. (17), (20), and (21) generate very good fitting of R2 > 0.99 (R2 = 1 means perfect fitting).
The mechanical properties probed at enamel rod and interrod regions from both single load–unload [Fig. 4(a)] and load–hold–unload measurements [Fig. 4(b)] are summarized in Tables I and II. For statistical analysis, p-values are calculated and are listed in the same tables.
For the load–unload measurements, the reduced elastic modulus E r,loading and E r,unloading of the enamel rod regions (86.3 ± 5.9 and 109.4 ± 4.8 GPa) are statistically significantly higher than those in the interrod region (78.2 ± 3.9 and 103.0 ± 3.4 GPa). The hardness in both regions show statistically significant difference too (Hrod = 5.2 ± 0.4 whereas Hinterrod = 4.8 ± 0.2 GPa). The elastic energy recovery of the enamel rod region (U E,rod = 3924 ± 131 × 10−6 nJ) is statistically significantly lower than the interrod region (U E,interrod = 4097 ± 89 × 10−6 nJ). The inelastic energy dissipation and the inelasticity index of both regions do not show statistically significant difference. The inelasticity energy dissipation is 2408 ± 150 × 10−6 nJ in enamel rod region and 2567 ± 345 × 10−6 nJ in interrod region. The inelasticity index of the enamel rod and interrod regions are 38 ± 2 and 38 ± 4%, respectively.
Under the load–hold–unload profile, only the inelastic energy dissipation in both regions shows statistically significant difference; the dissipation in the enamel rod region (9315 ± 1500 × 10−6 nJ) is statistically significantly lower than in the interrod region (12656 ± 1297 × 10−6 nJ). The values of elastic energy recovery, inelasticity index, creep, 1/C 0, viscosity, viscosity at steady state, instantaneous stress P m0, and stress relaxation constant are listed in Table II.
Although load reduction occurred during the constant load holding process [Fig. 5(b)] due to the relaxation of the spring holding the transducer inside the nanoindenter, such a load reduction happened with 486–491 μN at point A and dropped to 461–477 μN at point B, and is deemed insignificant in influencing the results in this study.
V. DISCUSSION
Two values of elastic moduli are reported here, E r,loading and E r,unloading. The loading curve is more appropriate than the unloading curve to calculate E because of the influence of creep during unloading raising the slope of the elastic recovery resulting in an overestimate of the E modulus as observed. As observed in the previous studies,Reference Habelitz, Marshall, Marshall and Balooch10, Reference Ge, Cui, Wang and Feng11E r and H in the enamel rod regions are significantly higher than in the interrod region. The difference could be due to the different crystallite orientation or difference in protein contents. Knowing that the E r and H for a single-crystal HAP change from E = 162 ± 1.9 GPa and H = 14.8 ± 0.1 GPa where the test direction was parallel to its c-axis and E = 127.2 ± 10.4 GPa and H = 9.5 ± 1.5 GPa for the test direction being perpendicular its c-axis (P < 500 μN with a Berkovich indenter),Reference Viswanath, Raghavan, Ramamurty and Ravishankar30 the small difference in Table I might be due to the difference of crystallite orientations between the enamel rod and interrod region, and not necessarily due to the different amounts of protein. The big differences reported by Ge et al.Reference Ge, Cui, Wang and Feng11 (AFM combined with nanoindentation technique) with E and H being less than 50% in the interrod regions compared to enamel rod regions are not observed in our study. The reason might be the larger indentation area in our study thus not resolving the protein sheath as well.
Mechanical properties probed from the load–unload profile [Fig. 4(a)].

Mechanical properties probed from the load–hold–unload profile [Fig. 4(b)].

The load–hold–unload loading function was able to observe significant different energy dissipation behaviors between enamel rod and interrod regions. The inelastic energy dissipation in the interrod region is significantly higher than the enamel rod region. This could be attributed to the higher activities of protein unfolding or even their sliding between the crystallites in the interrod region. Compared to a load–unload profile, the inelastic energy dissipation in the interrod region under load–hold–unload profile increases significantly higher than in the enamel rod region. Dislocation/fracture in crystallites is unlikely to contribute to the inelastic energy dissipation since the elastic/inelastic transition of HAP for such a contact radius (∼200 nm) is 10 GPa,Reference Ang, Bortel, Swain, Klocke and Schneider28 while the highest mean pressure in this study was ∼5 GPa.
If the inelastic energy dissipation is attributed to protein bonds unfolding alone, the question arises how many protein bond openings were involved under the utilized loading function? For a simple calculation, the inelastic energy dissipation of the enamel rod region from the load–unload loading function (2.4 pJ) is used. It has been shown in the previous study that an applied load of 0 to 204 pN is necessary to open a single protein bond by 20 nm.Reference Dougan, Koti, Genchev, Lu and Fernandez31 Therefore, the energy used to open a single protein bond can be approximated as 0.5 × 204 pN × 20 nm = 2 × 10⁻⁶ pJ. The number of the protein bonds unfolded in enamel rod region under load–unload profile is then estimated as 2.4 pJ/2 × 10−6 pJ = 1.2 × 10⁶ protein bonds. Next, we are interested to calculate the number of these protein bonds per volume. The volume displaced by an indenter with R = 889 nm for a penetration depth of 30 nm is V = π × h t2 × (3R − h t)/3 = 2485314 nm3. Assuming the volume fraction of protein to be 0.05, the number of protein bonds unfolded per volume of materials displaced by the indenter is 1.2 × 10⁶/(0.05 × 2485314) = 10 protein bonds unfolding/nm3 of proteins. These numbers might be lower when we consider the volume affected by the applied stress does not only involve the volume calculated above but also the volume in the vicinity. Nevertheless, they give an insight on how many protein unfoldings could happen that contribute to the inelastic energy dissipation.
The inelasticity index (U Inel%) from the constant load holding profile is ∼70% and is found to be similar with the ∼70% reported by He and SwainReference He and Swain20 when a 5-μm spherical indenter was used to load on enamel in 10 s and unload again in 10 s. When a material is stressed beyond its elastic limit, its U Inel% increases with the stress/strain level until it reaches a plateau value. Such relationship has been shown previously on a single tropocollagen.Reference Carlisle, Coulais and Guthold9 Enamel is expected to exhibit the same materials behavior. The 70% in this study is either the maximum U Inel% that could be achieved by enamel with increasing stress–strain level or an intermediate value.
The comparison of U Inel utilized every data points in Fig. 5(b) and has observed statistically significant difference between interrod and enamel rod region. For the calculation of creep, viscosities, and time constants for relaxation behaviors, only the data from the dwell region from point A to point B are involved in the calculation and have not observed statistically significant difference between the two investigated regions. For creep, damage that can be attributed to microcracks and/or voidsReference Zhang, Michalenko, Kuhl and Ovaert32 is unlikely to be a significant contribution to the measured creep. In a previous study, burnt and dry enamel specimens exhibited lower creep compared to sound enamel when held under a constant load of 250 mN for 900 s with a Berkovich indenter.Reference He and Swain33 If the increased penetration depth in that study was significantly caused by damage, burnt and dried samples should have exhibited higher creep compared to sound enamel which however was not the case.
The viscosities calculated when the creep responses were considered as a spring, a slider, and dashpot in series (η rod = 6.4 ± 2.2 × 10¹² Pa·s; η interrod = 4.5 ± 1.4 × 10¹² Pa·s) are found to be very similar when the creep responses were considered as behaviors of viscoelastic fluid in a steady state regime (η rod = 8.6 ± 3.0 × 10¹² Pa·s; η interrod = 6.0 ± 2.0 × 10¹² Pa·s). The viscosities determined in this study are lower than the values recorded by Mencik et al.,Reference Mencik, He and Swain13 whose studies involved a contact area of several enamel rods, probably because different values of viscosities prevail at different length scales. Under the contact conditions of our experiment (a length scale of ∼400 nm and a contact pressure of ∼5 GPa), viscoplastic process prevails, whereas viscoelastic and viscoplastic processes prevail at a bigger length scale and load level in the case investigated by Mencik et al.Reference Mencik, He and Swain13 The viscoelastic values in this study were also found to be higher than the values 1.1 × 10¹⁵ Pa·s by Schneider et al.,Reference Schneider, He and Swain34 whose value was calculated based on a pure viscosity model.
VI. CONCLUSIONS
This study used spherical indentation of ∼1-μm tip radius to compare the mechanical properties of enamel rod and interrod regions of enamel. When the applied stress was held for a longer period, the inelastic energy dissipation in the interrod region is statistically significantly higher than the enamel rod region. The increase in inelastic energy dissipation over time is significantly higher in the interrod region than in the enamel rod region too. The total displacements under constant load (creep), the viscosities, and the time constants for stress relaxation of enamel rod and interrod regions are statistically similar. Similar to previous studies, the elastic modulus and hardness in the enamel rod regions are statistically significantly higher in the interrod region.
ACKNOWLEDGMENTS
The authors express gratitude to German Research Foundation for financial support. We also appreciate teeth samples collection from Dr. Carmen Gottstein and Mr. Peter Stutz from University of Hamburg.