Introduction
Whiteflies, being highly polyphagous, feed on phloem sap as both adults and nymphs, causing extensive damage to a wide range of host plants, including fruits, vegetables, ornamentals, field crops, and weeds (Abubakar et al., Reference Abubakar, Koul, Chandrashekar, Raut and Yadav2022). They also secrete honeydew, which causes a sooty mould growth that interferes with photosynthesis, reducing the yield and quality of fruit and fibre (Gangwar and Charu, Reference Gangwar and Charu2018). In agriculture, whiteflies have a significant impact on the transmission of viruses (Gilbertson et al., Reference Gilbertson, Batuman, Webster and Adkins2015; Kanakala and Ghanim, Reference Kanakala and Ghanim2019). Over 300 plant viruses can be transmitted by Bemisia tabaci, including those from the genera Begomovirus, Carlavirus, Crinivirus, Ipomovirus, Torradovirus, and Polerovirus (Costa et al., Reference Costa, Inoue-Nagata, Vidal, Ribeiro and Nagata2020; Ghosh et al., Reference Ghosh, Kanakala, Lebedev, Kontsedalov, Silverman, Alon, Mor, Sela, Luria, Dombrovsky, Mawassi, Haviv, Czosnek and Ghanim2019; Gilbertson et al., Reference Gilbertson, Batuman, Webster and Adkins2015; Prasannakumar and Maruthi, Reference Prasannakumar and Maruthi2021). The most commonly transmitted virus is Begomovirus. The outbreak of B. tabaci is typically linked to begomovirus epidemics, which have led to significant economic losses in tropical and subtropical locales (Qureshi et al., Reference Qureshi, Lal, Nawaz-Ul-Rehman, Vo, Sanjaya, Ho, Nattanong, Kil, Jahan, Lee and Tsai2022). Tomato Leaf Curl Bangalore Virus (ToLCBV) is one of the important viruses that is mainly vectored by B. tabaci, causing devastating losses of up to 100% in the yield of tomatoes. A complex interaction exists between the virus and B. tabaci (Naveed et al., Reference Naveed, Islam, Jafir, Andoh, Chen and Chen2023). Once B. tabaci is infected with the virus, it will undergo several cellular changes to protect itself from xenobiotics (in this case, viruses). Viral infection could trigger Programmed Cell Death, encompassing both apoptosis and autophagy, which are inherently linked to the host’s immune response and defence mechanisms against pathogen infections (Verburg et al., Reference Verburg, Lelievre, Westerveld, Inkol, Sun and Workenhe2022). Autophagy, an essential cellular response, typically plays a considerable role in the virus acquisition (Wang et al., Reference Wang, Guo, Salzman, Ge and Sun2022; Wu et al., Reference Wu, Luo and Ren2022).
Although there is limited information on virus infections caused by autophagy in insect vectors, understanding their mechanisms can help in preventing virus spread. Insects have naturally developed RNA interference (RNAi) as their primary defence against viral pathogens. (Christiaens et al., Reference Christiaens, Niu and Taning2020). RNAi can be employed to protect beneficial insects against viral infections or other pathogens by aiding their natural immune system. Identification of potential target genes is necessary for efficient pest management using RNAi (Chandra et al., Reference Chandra, Asokan, Manamohana, Kumar and Sita2014). Thus, it necessitates the precise quantification of target gene expression. Quantitative reverse transcription polymerase chain reaction Quantitative Real-Time Polymerase Chain Reaction (qRT-PCR) is a commonly employed technique for assessing transcript levels of target genes across various organisms, which is being used due to its simplicity, sensitivity, accuracy, and minimal sample requirement (Dong et al., Reference Dong, Zhan and Li2022). The selection of appropriate reference genes for normalisation is crucial for achieving reliable gene expression measurements (Ahmed et al., Reference Ahmed, Xie, Shi and Zheng2022). The accuracy of results largely depends on variations in sample quality and quantity used during analysis (Chandra et al., Reference Chandra, Asokan, Manamohana, Kumar and Sita2014). Internal reference genes help mitigate these variations, enabling precise estimation of gene expression. However, there is no information available regarding the selection of suitable reference genes for quantifying virus-induced autophagy gene expression in B. tabaci.
Traditionally, housekeeping genes such as actin (ACT), elongation factor 1 alpha (EF-1α), and glyceraldehyde-3-phosphate dehydrogenase (GAPDH), which are involved in primary metabolism and other essential cellular processes, are considered to be stably expressed (Liu and Li, Reference Liu and Li2019). As a result, these genes are often used for normalising qPCR data without further validation. In non-model insects, reference genes are typically identified by searching for orthologous sequences of common housekeeping genes that have been reported in model insect species due to limited genetic and sequence data (Gazara et al., Reference Gazara, Cardoso, Bellieny-Rabelo, Ferreira, Terra and Venancio2017). However, several studies have shown that the expression levels of traditional housekeeping genes can vary significantly across different biological samples and experimental conditions (Shakeel et al., Reference Shakeel, Rodriguez, Tahir and Jin2018). Therefore, using unvalidated traditional housekeeping genes for normalisation in relative gene expression quantification may lead to biased results and incorrect conclusions. To overcome this hurdle, the present study focused on evaluating five internal reference genes, viz., α-tubulin, β-tubulin, elongation factor, actin, and sucrose synthase, mined from the transcriptome data of Tomato Leaf Curl Virus (ToLCV) acquired B. tabaci to identify a stable reference gene that could be used to quantify autophagic gene expression in B. tabaci induced by ToLCBV.
Materials and methods
Whitefly colony and viral plant source
B. tabaci (Asia-I), genetic group culture was maintained on brinjal (Solanum melongena cv. Arka Keshav) seedlings (healthy plants without any other insect damage) maintained at 27 ± 2°C temperature, 65 ± 5% relative humidity, and 16:8 h of daylight and darkness in the Division of Basic Sciences, ICAR-Indian Institute of Horticultural Research (IIHR), Bengaluru. ToLCBV-infected plants were maintained at the Virology Lab, Division of Crop Protection, ICAR-IIHR.
RNA isolation and cDNA synthesis
The ISOLATE II RNA Mini Kit (Bioline, USA) was used to extract the complete RNA from B. tabaci adults as per the manufacturer’s instructions. Nanodrop was used to determine the purity of the RNA, and its integrity was confirmed by denaturation on agarose gel electrophoresis. The First Strand cDNA Synthesis Kit (Thermo Fisher Scientific, USA) was utilised to create cDNA with 1 µg total RNA abide by the manufacturer’s protocol. Until further use, the cDNA was stored at −20°C.
ToLCBV confirmation
The healthy whiteflies were inoculated on the ToLCBV plant for acquisition up to 48 h. After acquisition, B. tabaci individuals were collected and tested for virus acquisition with the specific primers (Forward 5ʹ GTCAGCAATCTGCCAACGAC; Reverse 3ʹ GTGTTGGATTGCCAGTCCCT) of 1200 bp size PCR amplification, according to Prasannakumar and Maruthi (Reference Prasannakumar and Maruthi2021). After ToLCBV was confirmed, the virus-acquired whiteflies were used for further studies.
Reference gene selection and primer design
Five candidate reference genes such as α-tubulin (G1), β-tubulin (G2), elongation factor (G3), actin (G4), and sucrose synthase (G5) were selected based on the transcriptome profile of gene expression in ToLCV-infected B. tabaci across different viral acquisition access periods (Accession number PRJNA562795). Gene-specific primers were used to amplify these genes. PCR was conducted in a thermal cycler (ABI Veriti, USA) under the following conditions: an initial denaturation at 95°C for 3 min, followed by 35 cycles of denaturation at 98°C for 10 s, annealing at 57°C for 30 s, extension at 68°C for 1 min and 30 s, and a final extension at 72°C for 10 min. The 25 μL reaction mixture included 10X LA PCR Buffer ll (Mg2 + free), 0.2 µM of each primer, 50 ng of B. tabaci cDNA, 0.25 U of LA Taq DNA Polymerase (TAKARA BIO INC, USA), 0.25 mM of each dNTP, and 1.5 mM MgCl2. PCR products were cloned and confirmed through Sanger sequencing. The resulting sequences were validated using NCBI BLAST. qRT-PCR primers were then designed using the Primer Quest tool (https://www.idtdna.com/PrimerQuest) (table 1).
Information of genes, primer sequences, and amplicon characteristics

qRT-PCR experiment
The study employed a quantitative real-time PCR (qRT-PCR) methodology to investigate the mRNA expression of B. tabaci. A total of 30ng cDNA template, 10 μL of 2X TB Green Premix Ex Taq II (Tli RNase H Plus), 0.2 μM of each primer (0.4 μL), and 6 μL of nuclease-free water were combined to create a total reaction volume of 20 μL. Melting analysis was performed in one cycle, at 95°C for 5 s (Ramp rate: 4.4°C/s), 60°C for 1 min (Ramp rate: 2.2°C/s), and 95°C (Ramp rate: 0.11 °C/s, Acquisition Mode: Continuous, Acquisitions: 5°C/cycle). The qRT-PCR was performed with pre-incubation at 95°C for 1 min (Ramp rate: 4.4°C/s). Five technical duplicates of each gene were run.
Expression stability of candidate reference genes
The analysis of qRT-PCR data was done using the Roche Light Cycler 480 II System. In this investigation, four statistical algorithms, viz., GeNorm (Vandesompele et al., Reference Vandesompele, De Preter, Pattyn, Poppe, Van Roy, De Paepe and Speleman2002), BestKeeper (Pfaffl et al., Reference Pfaffl, Tichopad, Prgomet and Neuvians2004), NormFinder (Andersen et al., Reference Andersen, Jensen and Ørntoft2004), and the comparative delta Ct algorithm (Livak and Schmittgen, Reference Livak and Schmittgen2001), were applied to calculate and rank the expression stability of every candidate gene. Based on the ‘M’ value, the GeNorm algorithm evaluated the putative reference gene’s stability. The genes with the greatest steady expression were those with the lowest ‘M’ value. Additionally, GeNorm established the ideal reference gene count. GeNorm’s calculation of the pairwise variation value (Vn/Vn + 1) was less than 0.15, indicating that no extra reference genes were needed for normalisation. The stability value (SV) of potential reference genes was determined using NormFinder. Standard deviations (SDs) of the Ct values, which indicated the reference genes stability, were assessed using the BestKeeper tool. The mean and SD of Ct values for potential reference genes were calculated. The comparative ΔCt technique was able to estimate stability based on ΔCt values. Candidate reference genes exhibiting greater variability in ΔCt values were regarded as less stable. Lastly, a thorough comparison and the possible reference genes were ranked using a web-based tool (RefFinder), which can combine the four computational programs (GeNorm, BestKeeper, NormFinder, and the ΔCt techniques). Each gene was assigned a specific weight, and the final ranking was determined by calculating the geometric mean of the weights.
Reference genes validation
Our validation process involved selecting an autophagy gene (atg3) that is widely present in both viruliferous and non-viruliferous B. tabaci. The transcription levels of the target gene were estimated in both viruliferous and non-viruliferous whiteflies. qRT-PCR amplification of atg3 (Accession number: PP234627) was performed with target gene-specific primers (table 1).
Statistical analysis
The relative expression levels of autophagy-related genes and atg3 in viruliferous and non-viruliferous B. tabaci with different housekeeping genes were assessed using the 2−ΔCt and 2−ΔΔCt methods, respectively (Livak and Schmittgen, Reference Livak and Schmittgen2001). Statistical analyses and visualisations were carried out using GraphPad Prism (Version 8.0.2) with a 5% level of significance (p < 0.05).
Results
RNA quality
Denatured agarose gel electrophoresis (1.2%) was used to assess the quality and quantity of RNA and was measured using a spectrophotometer, SpectraMax® Model No. M2 (Molecular Devices, CA, USA). PCR using G1 primers confirmed that there was no genomic DNA contamination after 40 cycles.
ToLCBV and autophagy confirmation
The PCR amplification of the ToLCBV was confirmed in both plants and B. tabaci with an amplicon size of 1200 bp (Fig. S1). In addition, the B. tabaci tested for the autophagy gene (atg3) with end-point PCR confirmed its presence in the gel with an amplicon size of 1240 bp.
Primer specificity and efficiency
The results of agarose gel electrophoresis (1.5%) and melt curve analysis in qRT-PCR indicated the specificity of each putative reference gene. The efficiency of PCR amplification was calculated before expression stability analysis and observed amplification efficiencies ranging from 94.8% to 98.8% for all tested reference genes. The highest PCR efficiency (98.8%) was observed for G3 followed by 97.62%, 96.06%, 95.35%, and 94.8% for G1, G2, G4, and G5, respectively (table 1). The melt curve analysis of the amplicon revealed the presence of a single melt peak corresponding to a single symmetrical amplicon. In addition, the sequence obtained from the cloned qPCR product showed a 100% match with the target gene.
Expression pattern of autophagy genes in B. tabaci
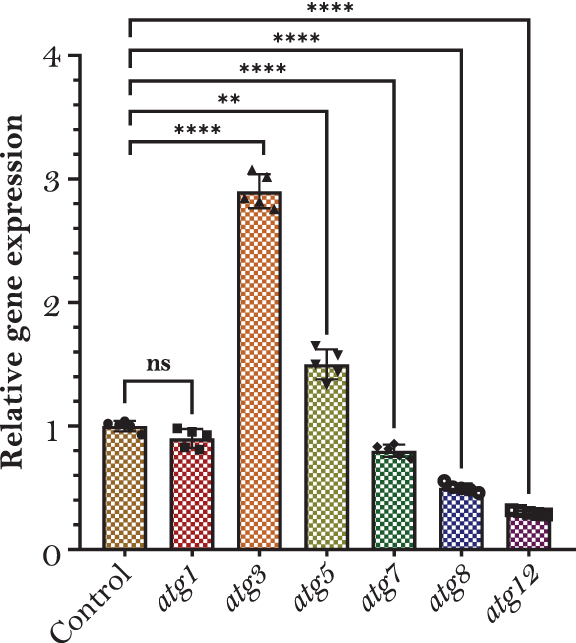
The expression levels of various atg genes (atg1, atg3, atg5, atg7, atg8, and atg12) in B. tabaci were analysed in comparison to a control group. Among these, atg3 exhibited the highest expression, significantly surpassing all other genes and the control. The atg5 showed a moderate expression level, higher than the control and other genes, though considerably lower than atg3. In contrast, atg7, atg8, and atg12 displayed much lower expression levels compared to atg3 and atg5 but were still distinguishable from the control. No significant expression was detected for atg1 (fig. 1). These findings identify atg3 as the most upregulated gene, indicating its key role under virus-acquired conditions.
Expression levels of different autophagy-related genes in the viruliferous whiteflies after 48 h of the acquisition period. The asterisks indicate varying degrees of statistical significance (*p < 0.05, **p < 0.01, ***p < 0.001, ***p < 0.0001), emphasising the differences between gene expressions.

Expression level comparison of selected reference genes
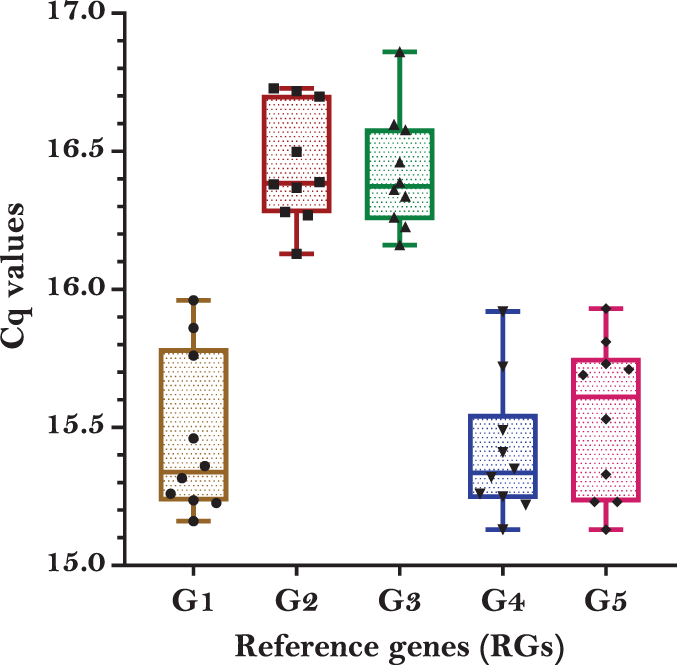
Expression levels of reference genes exhibited wide variations, ranging from 8 to 20 quantification cycles (Cq). Among the five potential reference genes, Cq was least in G1 (14.46) with an SD of 0.59. The highest mean Cq value of 16.45 in G2 with an SD of 0.27. The order of expression levels was G2 > G3 > G4 > G5 > G1 (fig. 2).
Box and whisker plots showing the Critical Point (CP) data of housekeeping genes by BestKeeper expression stability. The median is represented by the horizontal line within each box. The top and bottom edges of the interquartile range correspond to the 75th and 25th percentiles, respectively. The whiskers of each box indicate the minimum and maximum Cq values, while outliers are depicted as dots. Standard errors are displayed on either side of the box plot.

Analysis of expression stability of reference genes
The analysis of gene expression stability of five candidate reference genes was studied using comparative BestKeeper, ΔCt method, NormFinder, and GeNorm expression SVs by employing the integrated RefFinder tool (https://www.ciidirsinaloa.com.mx/RefFinder-master/).
BestKeeper
BestKeeper analysis determined the expression stability of five reference genes based on the SDs of the Cq values. According to the BestKeeper index (based on the geometric mean of the Cq values of various genes), G3 (0.058) was found highly stable with the least BestKeeper index, followed by G4 (0.247) and G2 (0.271) (fig. 3a).
Expression stability of five candidate reference genes in B. tabaci using BestKeeper, normFinder, Genorm, ΔCt method, and comprehensive analysis.

NormFinder
The SV (the lesser the SV, the higher the stable expression of the genes) of all the reference genes was determined using the NormFinder. According to NormFinder G2 was highly stable (0.141) followed by G1 (0.206) and G3 (1.245) and G5 (16.702) found less stable (fig. 3b).
GeNorm
In GeNorm, the stability of the genes depends on ‘M’ value (‘M’ is the expression stability index). The genes G2, G3, and G4 were found more stable in GeNorm with the ‘M’ value of G2, G3 (0.282) followed by G4 (0.458) and G5 (7.028) recorded as the least stable (fig. 3c).
ΔCt method
The ΔCt technique was able to estimate the stability based on calculating the mean SD of Ct values for potential reference genes. The candidate reference genes that had the most variability in ΔCt were given the least consideration. In ΔCt analysis, G2 was found to be more stable with Ct values of 4.485, followed by G3 at 4.557 (fig. 3d).
Comprehensive analysis
A comprehensive analysis of all the genes was conducted using the RefFinder tool, which integrates four computational programs (GeNorm, BestKeeper, NormFinder, and ΔCt techniques). According to Comprehensive analysis, the gene G2 (1.316) was more stable followed by G3 (1.565). A comprehensive analysis of all the genes using the RefFinder tool revealed that G2 suitable reference gene for expression studies (fig. 3e).
Impact of reference gene selection to estimation the target gene expression
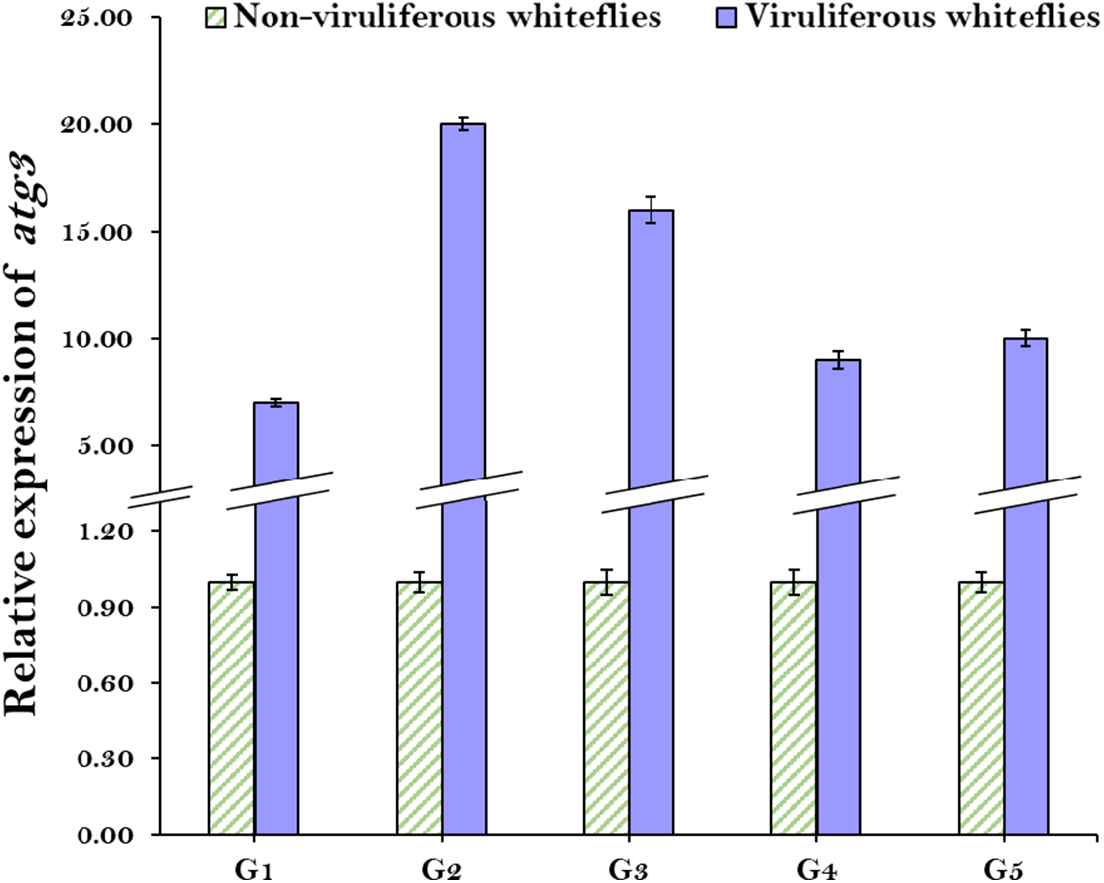
Five candidate reference genes with varying degrees of stability were used to normalise the expression of the atg3 target gene to assess the impact of autophagy after virus acquisition. This approach revealed remarkable variability, resulting in considerable fluctuations in the observed magnitude of the outcomes. No up- or down-regulations were noticed in non-viruliferous B. tabaci when normalised with all five candidate reference genes, as no autophagy reactions took place on viruliferous B. tabaci. Expression analysis of atg3in viruliferous B. tabaci, when normalised with the best-ranked reference gene, G2 showed higher expression followed by G3. Interestingly, the expression levels of G4 and G5 were on par even though their stability differs. These results revealed that the selection of inappropriate reference genes may lead to an erroneous interpretation of data. In addition, the least expression was recorded on the least stable reference gene G1 (fig. 4).
Relative expression levels of atg3 under viruliferous and non-viruliferous B. tabaci using different housekeeping genes.

Discussion
Real-time PCR is one of the very important methods of obtaining high-throughput gene expression analysis. However, to get accurate results from real-time PCR analysis, gene expression must be normalised precisely against a control gene (Kozera and Rapacz, Reference Kozera and Rapacz2013). The control gene expression should be similar irrespective of the experimental conditions, cell types, and developmental stages (Chandra et al., Reference Chandra, Asokan, Manamohana, Kumar and Sita2014). However, stable expression is not achievable for any single gene in all experimental conditions (Aithal and Rajeswari, Reference Aithal and Rajeswari2015). The expression of housekeeping genes is prone to instability, as indicated by many studies (Irie et al., Reference Irie, Warita, Tashiro, Zhou, Ishikawa, Oltvai and Warita2023; Turabelidze et al., Reference Turabelidze, Guo, Luisa and DiPietro2010). Thus, ensuring gene expression results are normalised regardless of experimental conditions with a single control can potentially bias the results (Kozera and Rapacz, Reference Kozera and Rapacz2013). Validating the expression stability of a control gene under specific experimental conditions is necessary before using it for normalisation (Kozera and Rapacz, Reference Kozera and Rapacz2013). Though many reference genes were reported in different gene expression studies in B. tabaci, reference genes for autophagy gene expression have not been carried out so far. In the present study, five reference gene expressions (G1, G2, G3, G4, and G5), were studied in viruliferous and non-viruliferous B. tabaci. Further, the present study investigated the expression consistency of reference genes with several analysis programs, viz., GeNorm, NormFinder, and BestKeeper. However, under the same experimental settings, the aforementioned programs ranked the reference genes differently, and the reference genes’ stability rankings varied throughout the conditions. While this study utilised whole-body samples of B. tabaci, future investigations focusing on tissue-specific expression, particularly in virus-interacting organs like the midgut and salivary glands, could refine the selection of reference genes under targeted physiological conditions. The variations in the ranking of reference genes may be due to the use of different programs assessing the expression consistency of genes (Chandra et al. Reference Chandra, Asokan, Manamohana, Kumar and Sita2014).
The Ct values acted as the foundation for the BestKeeper analysis, which involved calculating their geometric mean, arithmetic mean, minimum and maximum value, SD and coefficient of variation. BestKeeper analysis revealed that the G3 was highly stable with the least BestKeeper index, 0.058. However, even though it evaluates reference genes, the program cannot estimate the minimum number of genes required for normalisation (Kozera and Rapacz, Reference Kozera and Rapacz2013). Similarly, the NormFinder analysis gives variations based on the SV, which can also determine the stability for each gene was calculated independently. The results from NormFinder analysis found the G2 was highly stable, but hypothetically, this model is less sensitive to the co-regulation of candidate reference genes (Ponton et al., Reference Ponton, Chapuis, Pernice, Sword and Simpson2011; Chandra et al. Reference Chandra, Asokan, Manamohana, Kumar and Sita2014).
The ‘M’ value is computed by the GeNorm algorithm with the average pairwise variation among reference genes. The genes G2, G3, and G4 exhibited the lowest expression variation results in the lowest ‘M’ value (more stable), whereas G5 showed greater reference gene expression variability with a higher ‘M’ value (least stable). However, the biggest weakness is sensitivity to co-regulation genes with the most similar expression profiles. This resulted in a poor selection of RG (Kozera and Rapacz, Reference Kozera and Rapacz2013). Similarly, in ΔCt analysis, G2 was found to be more stable with Ct values of 4.485.
The results obtained from all four software programs showed some differences in the ranking of reference genes. Therefore, a comprehensive analysis is required to get the appropriate results (Kohsler et al., Reference Kohsler, Leitsch, Müller and Walochnik2020). The RefFinder tool is capable of conducting a comprehensive analysis of all genes, which can incorporate the four computational programs (GeNorm, BestKeeper, Normfinder, and ΔCt techniques). According to the comprehensive analysis, the gene G2 was more stable.
Meanwhile, analysis of the impact of reference genes on the estimation of target gene expression showed that inappropriate selection of reference genes had a major impact on data normalisation and interpretation. In the present study, the effect of autophagy after virus acquisition, the atg3 (target gene) expression was normalised with the five candidate reference genes exhibiting a range of stability from high to low, with significant variation. No up-/down-regulations were noticed in non-viruliferous adults when normalised with all five candidate reference genes, indicating autophagy expression in non-viruliferous B. tabaci adults. The expression analysis of atg3 genes in viruliferous adults, when normalised with the top-ranked reference gene, β-tubulin, showed higher expression.
Research on the expression of endogenous control genes, particularly in insects, has revealed that commonly used housekeeping genes exhibit variable expression across different experimental conditions, making them unsuitable for normalisation (Shakeel et al., Reference Shakeel, Rodriguez, Tahir and Jin2018; Yang et al., Reference Yang, Li, Cao, Zhang, Zhang, Wu, Zhang and Liu2014; Zhang et al., Reference Zhang, An, Li, Wu, Yang, Liu, Cao, Zhang, Zhang and Liu2015). Novel reference genes, such as ribosomal genes, have shown high stability under a range of abiotic and biotic conditions in insects, suggesting that genes encoding ribosomal proteins could serve as reliable reference genes (Moin et al., Reference Moin, Saha, Bakshi, Divya, Madhav and Kirti2021; Pinheiro and Siegfried, Reference Pinheiro and Siegfried2020). However, these genes may also display varying expression levels under different conditions, particularly when tested in different tissues.
Conclusion
The present study assessed the expression stability of candidate autophagy gene expression in viruliferous adults using different statistical algorithms. β-Tubulin was found to be highly stable, and this can be used as an internal reference gene in qRT-PCR studies to know the variation/quantification of gene expression to be used. In future, this could be used in dsRNA or virus-induced gene silencing assays for functional validations using qRT-PCR. These findings are also critical for future functional genomics studies in B. tabaci, especially under virus stress conditions, where accurate normalisation is essential for gene expression analysis. The present study emphasised the importance of selecting appropriate internal normalisation genes for qRT-PCR, as proper normalisation is essential for accurate mRNA quantification. Reference genes are commonly used for this purpose due to their ease of use and control over qRT-PCR stages. However, their stability can vary across tissues, developmental stages, species, and stress conditions. This study identified β-tubulin as a stable reference gene in a virus-acquired condition, although its stability may differ in other contexts. Therefore, the present study highly recommends validating the stability of reference gene expression before each qRT-PCR experiment and using multiple reference genes to obtain the most accurate results.
Supplementary material
The supplementary material for this article can be found at https://doi.org/10.1017/S0007485325100394.
Acknowledgements
The authors thank the Director, ICAR-IIHR, Bengaluru, for the support and infrastructure.
Author contributions
NRP made the conception or design of the work. NRP and KA conducted research experiments, analyzed and interpreted data, drafted the work, or revised it critically for important intellectual content. NJ assisted in all lab experiments, maintaining insect culture and bioinformatics. VV and RA reviewed the manuscript, and all authors approved the final version of the manuscript.
Competing interests
The authors declare that their work presented in this paper was not influenced by any conflicts of interest or personal relationships.