


Introduction
Lots of interest has been devoted to wireless power transfer (WPT), which can avoid the burden of connections and allows to overcome barriers, in order to transfer power to vehicles [Reference Wang, Stielau and Covic1], industrial movers or even implants. Inductive resonant WPT has been proved to be able to transfer power with high efficiency and to a considerable distance, which can be in the order of few times the size of the coils [Reference Sample, Meyer and Smith2–Reference Imura and Hori4]. The optimum conditions, such as the optimum load which allows to achieve the maximum link efficiency (or transferred power) have been studied [Reference Pinuela, Yates, Lucyszyn and Mitcheson5–Reference Florian, Mastri, Paganelli, Masotti and Costanzo7]. Indeed, the optimum load is strongly influenced by the coupling coefficient, which means that a certain load is optimal only for a particular distance. Furthermore, if the coupling coefficient is above a certain critical value, a resonant frequency bifurcation occurs and the optimum conditions move to a different frequency, thus a performance degradation is observed at the main resonant frequency [Reference Sample, Meyer and Smith2,Reference Wang, Covic and Stielau8,Reference Mastri, Costanzo and Mongiardo9].
Related works
The constant WPT to moving objects is still an open issue, due to the inherent variation of the shared magnetic flux between the transmitter and the receiver, which directly affects the coupling coefficient. Significant research activity is dedicated to avoid performance degradation of the link when unavoidable changes of the distance or of the alignment occur [Reference Zhang and Chau10–Reference Elliott, Raabe, Covic and Boys14]. A typical application is, for instance, the wireless charging of moving vehicles, where the Tx coils are placed underneath the pavement and a vehicle runs over them [Reference Chopra and Bauer15,Reference Russer, Dionigi, Mongiardo and Russer16]. Generally, in these systems, in order to increase efficiency, only a Tx coil at a time is activated. In this case, each time the receiver moves from a Tx coil to the next one, it is subject to a brief power drop-out, which, however, has a negligible effect on the system performance.
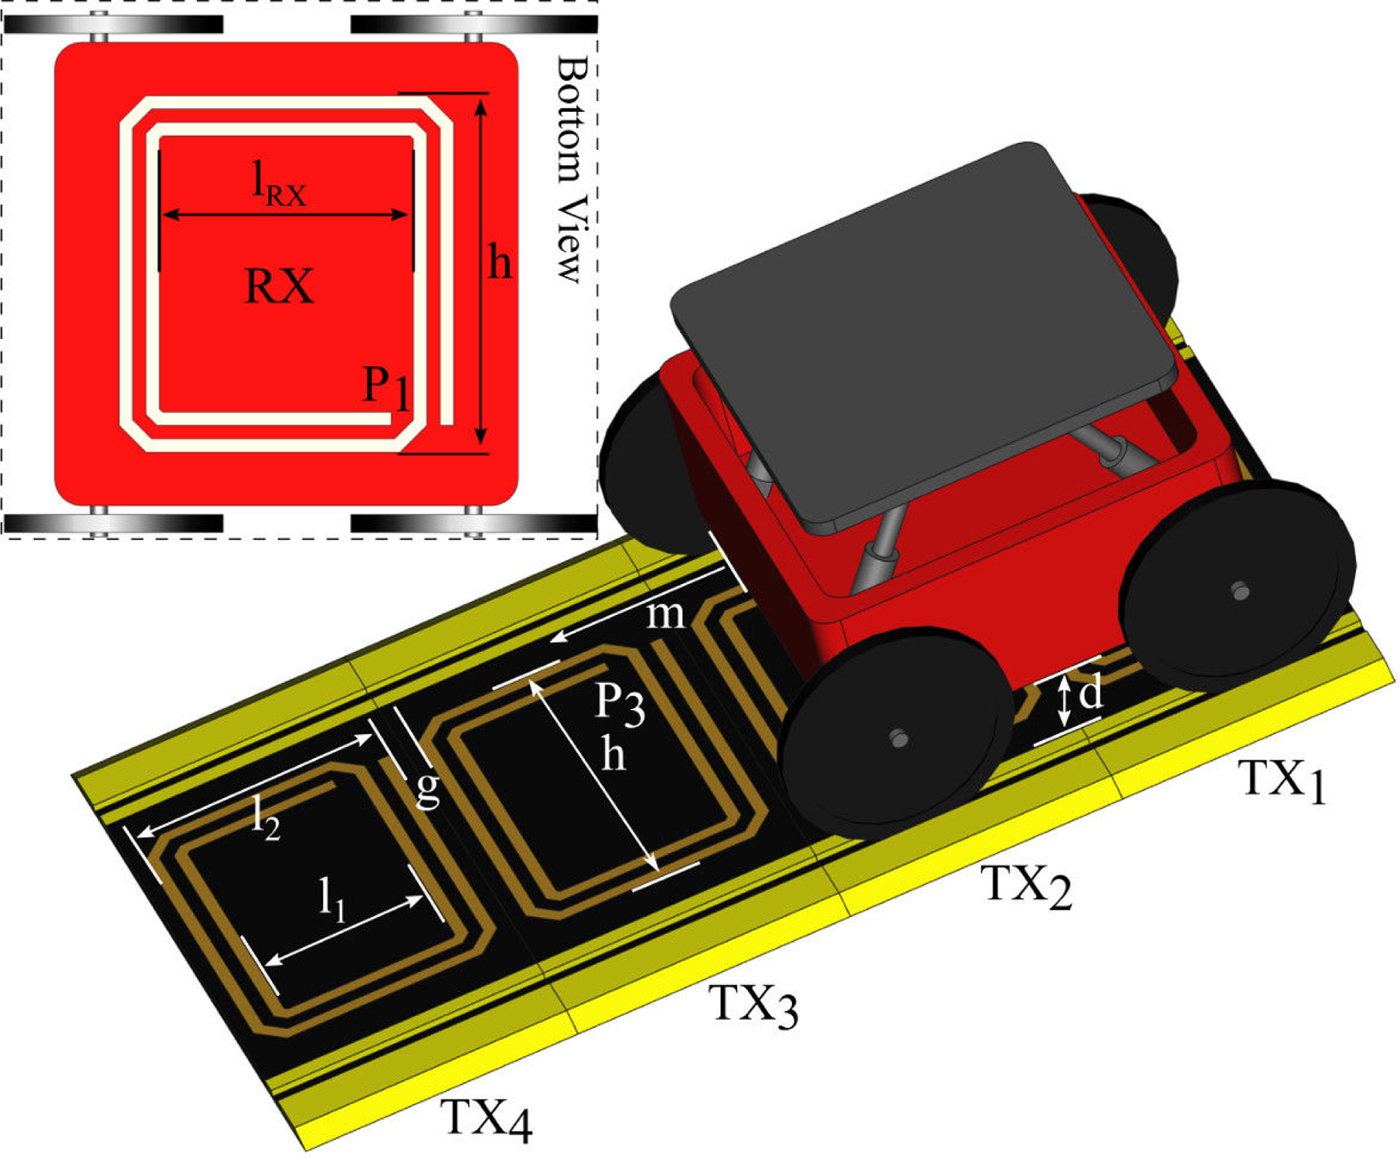
Another case of great interest is represented by industrial applications [Reference Chen, Boys and Covic17,Reference van der Pijl, Castilla and Bauer18] where the sliding elements, that can be called ‘movers’, behave as autonomous convoys to be included into some industrial equipments, such as a production line or an automatic machine. These movers, which can be remotely controlled or completely autonomous, are designed to transport the payload and to perform some simple tasks, while being powered by the wireless system, as in Fig. 1. A solution particularly suited for this case has been introduced in [Reference Pacini, Mastri, Trevisan, Costanzo and Masotti19,Reference Pacini, Mastri, Trevisan, Masotti and Costanzo20], where it is shown that, by simultaneously activating two series connected Tx coils, and by properly optimizing the layout geometry of the coils, it is possible to stabilize the coupling coefficient when moving in a linear direction, and thus to provide an almost position-independent voltage at the receiver output. In this case, the mover can stop at any position along the path and perform operations, without the need of being equipped with batteries, and the receiver design is simplified since there is no need for voltage regulators. In [Reference Pacini, Mastri, Trevisan, Masotti and Costanzo20], this result has been applied to a resonant link, operating at 6.78 MHz, obtaining a flat power efficiency while sliding. The first draft of a network able to extend the two-coil scheme to a virtually unbounded length system is presented. However, the proposed network is affected by over-currents when the active coils change.
Sketch of a wireless powered mover, with a sequence of transmitters and one receiver; only two transmitters are active at a time. P 1, P 2 (on TX 2, covered by the RX), P 3 are the WPT-link ports; d is the Tx-to-Rx distance; h, l 1, and l 2 are the Tx-coil geometrical parameters; g is the distance between the Tx-coils; l RX is the Rx coil length; m is the Rx-to-Tx displacement. Dimensions of the designed and measured prototype (mm): l 1 = 20, l 2 = 30, h = 40, d = 10, l RX = 28.5, g = 3.5.
Proposed implementation
In this paper, the issues of implementing this kind of moving system, powered by a unique AC source, are studied. The series-connected arrangement of two Tx coils at each time is adopted to retain a constant coupling coefficient with the sliding Rx side [Reference Pacini, Mastri, Trevisan, Costanzo and Masotti19,Reference Pacini, Mastri, Trevisan, Masotti and Costanzo20]. The possible Rx positions, corresponding to different electrical operating states of the system, are schematically depicted in Fig. 2(a), where the active Tx coils are highlighted while the position of the Rx coil continuously changes from the configuration of Fig. 2(a) (I), where it is coaxial with the first Tx coil, to the configuration of Fig. 2(a) (III), where it is coaxial with the second Tx coil. Figure 2(a) (II) represents the position where the switch to the next coil is required. The sequence of states for the coil switch is then repeated all over the powering Tx path. It is noteworthy that the proposed layout is suitable for powering multiple receivers by selectively enabling the proper coils.
(a) Outline of the movement, (b) equivalent 2-port of the moving link with two Tx coils in series.
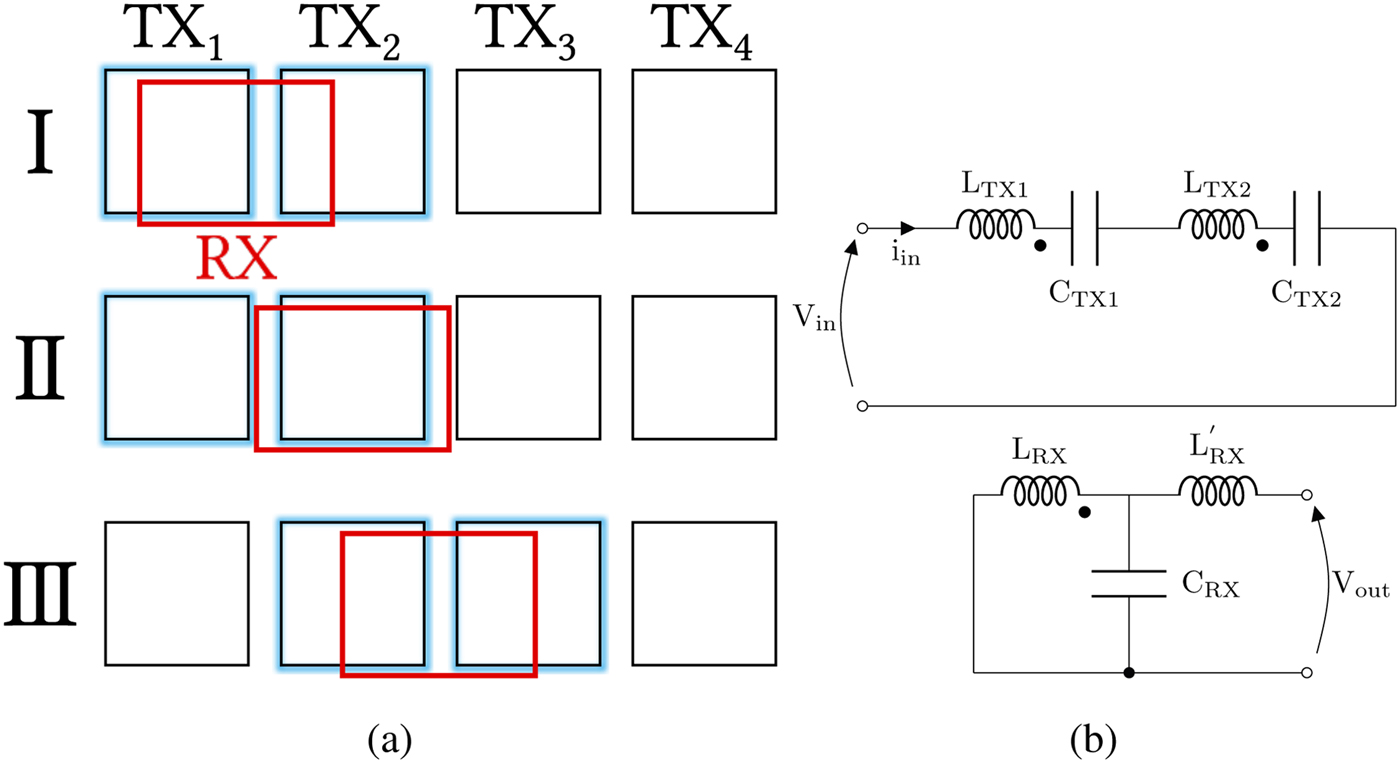
In the following, the design of a suitable network, whose role is to ensure the series connection between two subsequent coils, is presented. For each intermediate state which occurs while the active coils are changed, the main issue is to keep under control voltage spikes and over-currents, which is accomplished by a proper choice of the compensating circuit elements of the Tx chain. Specifically, the actual dynamic behavior of the switches, including the unavoidable asynchronous switching times, must be considered in the design to avoid current discontinuities through the coils. The aim is to complete a framework that ensures quasi-constant transfer efficiency and output voltage at the sliding receiver output terminals, de-facto obtaining a circuit equivalent to the non-moving two-port link in Fig. 2(b), but avoiding the issues arising in the implementation of [Reference Pacini, Mastri, Trevisan, Masotti and Costanzo20].
The design and experimental verifications are carried out at 6.78 MHz, chosen to verify the proposed design approach under severe parasitic effects, with the secondary advantage of a small setup and coils of few centimeters. The experimental validation demonstrates that the link is able to maintain a quasi-constant coupling while removing the over-currents in the intermediate states. Obviously, the best performances are reached at lower operating frequencies due to the reduced impact of the parasitic effects on the system performance. The natural application of such a system is for scenarios where the use of multiple inverters along the path [Reference Pacini, Costanzo, Aldhaher and Mitcheson21,Reference Pacini, Costanzo, Aldhaher and Mitcheson22] is not convenient. Indeed, this system is powered by a single AC source.
The proposed implementation has a voltage-fed source and a T-immittance inverter (see Fig. 2(b)) at the receiver side [Reference Costanzo, Dionigi, Mastri, Mongiardo, Russer and Russer23], which uses the inductance of the Tx coils to reduce the number of components and an uncoupled Rx coil to obtain  $L_{Rx}^{\prime}$. In combination with the inverting behavior of a resonant inductive link, the whole system acts as a voltage transformer (double T-immittance inverter): if the input voltage amplitude is constant, the output voltage amplitude is also constant. Being out of the scope of this work, the voltage source (as could be an inverter) is not developed.
The paper is organized as follows. In the section ‘System operation’, the dynamic switching network to selectively power the sole coils which effectively transfer the power to the receiver is introduced. The network topology and its behavior for all the possible states are analytically studied. In the section ‘Analysis of the intermediate states’, the adopted solutions for the switching network are first investigated in the absence of the receiver, both theoretically and by numerical simulations. It is shown that the choice of unequal compensating capacitances, for each couple of series-connected Tx coils, allows to minimize the current peaks when the WPT link switches among its possible intermediate states. In the section experimental validation these configurations are analyzed in the presence of the receiver. This last step cannot be analytically described, due to the complexity of the system, and the WPT system operation is predicted by numerical simulations and validated by measurements.
System operation
Ideal dynamical conditions
Figure 3 shows the active section of a slice of the WPT system composed by the moving Rx and two Tx coils, two capacitors and six switches. The entire Tx side is composed of a periodic connection of identical modules of this kind.
Equivalent circuit of the modular WPT link: two subsequent couples of the Tx coil are shown with the Rx located between the first two Tx coils, see Fig. 2(a) (I). The current path is outlined.

Let the moving receiver be located between the first and the second Tx coils. In such conditions these two coils are powered and the switches SW U1, SW S1, SW S2, SW D3 are closed (Fig. 3). This configuration is the normal situation and is maintained while the receiver is moving continuously until it is in front of the second Tx and their axes are aligned.
When the receiver moves beyond the center of the second Tx coil, the first one must be disconnected and the third one is powered, as shown in Fig. 4.
Circuit representation of the modular WPT link when the Rx coil is located between the second and the third Tx coils: the associated current path is outlined.

Since a direct transition from the state of Fig. 3 to that of Fig. 4 would cause current discontinuities, the switches SW U2, SW S3, SW D4 must be closed before SW U1, SW S1, SW D3 are opened. In this way, the intermediate and temporary state, represented in Fig. 5 is introduced. This state will be referred to as ‘State A’. The system is not meant to transfer power in these temporary states, but they are necessary to allow a seamless change between the active coils. It can be observed that, in this configuration, the first resonator is short-circuited by the switches SW U1, SW U2 and, similarly, the third resonator is short circuited by the switches SW D3, SW D4. In such conditions, a current is induced in the loop formed by the shorted resonators (see Fig. 3), which can reach excessively high values and compromise the switches. To avoid this critical condition, two different values, C Tx,o and C Tx,e, are adopted for the capacitances connected in series to the odd and to the even coils, respectively. The capacitances are chosen in such a way that the resonance condition is achieved when a couple of Tx coils are connected in series, but the impedance of the short-circuited LC branches in Fig. 5 (TX1 and TX3), at the operating frequency, is large enough to inhibit over-current. It can be observed that in state A the system is no longer resonant, and this causes a reduction of the transmitted power. However, since the system remains in this state only for the brief time required for the transition from the configuration of Fig. 3 to that of Fig. 4, the effect on the overall performance is negligible.
Intermediate state required to maintain current continuity (‘State A’). The switches SW U2, SW S3, SW D4 are closed, before SW U1, SW S1, SW D3 are opened. Two potentially critical closed loops are created.

Real dynamical system
In real scenarios, the switch commutations cannot be assumed perfectly synchronous. To effectively analyze the system behavior during switches commutations, additional intermediate states can be experienced, besides the one depicted in Fig. 5. They are represented in Figs 6 and 7 and can be referred as ‘State B’ and ‘State C’. Two other states, obtained interchanging the first and the third resonators, are possible, but are not considered explicitly, since the results derived for states B and C also apply in those cases.
Temporary states due to the non-synchronous commutation of the switches, the switch SW U2 gets closed before SW S3 or SW D4 (‘State B’).

Temporary states due to the non-synchronous commutation of the switches, the switch SW D3 gets open before SW U1 and SW S1 (‘State C’).

As in state A, in states B and C, the over-current in the shorted loop can be avoided by a suitable choice of the capacitance values, as it will be shown in the next sections.
Analysis of the intermediate states
The proposed solution in order to avoid the over-currents, resort to different values for the even and odd capacitances (C Tx,o, C Tx,e). The decision about their values is made by means of analyses carried out in states A, B, and C, aimed at establishing the dependence of the currents in the coils on the capacitance ratio α:
 $$\alpha = {C_{Tx,o} \over C_{Tx,e}}.$$
Since the series connection of two consecutive LC branches must resonate at the operating angular frequency, ω, the capacitances must also satisfy the condition
 $${C_{Tx,o}C_{Tx,e} \over C_{Tx,e} + C_{Tx,e}} ={1 \over \omega^2 L_{Tx}} \;.$$
In the last equation L Tx is the inductance of the transmitter, i.e.: L Tx = L Tx1 + L Tx2 + 2M Tx, where M Tx is the mutual inductance between two Tx coils. To reduce complexity and theoretically analyze the system in the intermediate states, the receiving coil is removed, thus representing a worst-case scenario. Indeed, without a receiver (and hence a load), the active Tx resonators exhibit the minimum impedance and, as a consequence, the current amplitudes are the highest, whereas a load would introduce an additional resistance. It should be obvious that, without a receiver, there is no coupling to be kept constant. This analysis is meant to remove the criticality at the Tx side, also avoided when the Rx is reintroduced.
Loop currents in intermediate state A
For State A, the currents in the loops for the first (I1) and the third (I3) Tx coil can be derived by circuit analysis as follows:
 $$\eqalign{&\left(R + j\omega L_{Tx} - {\,j \over \omega C_{Tx,o}} \right){\bf I}_1 + j\omega M_{Tx} {\bf I}_2 = 0 \cr &j\omega M_{Tx} \left( {\bf I}_1 + {\bf I}_3 \right)+ \left(R + j\omega L_{Tx} - {\,j \over \omega C_{Tx,e}}\right){\bf I}_2 = {\bf V}_{in} \cr & j\omega M_{Tx} {\bf I}_2 + \left(R + j\omega L_{Tx} - {\,j \over \omega C_{Tx,o}}\right){\bf I}_3 = 0,}$$
where boldface letters represent the current and voltage phasors. It is convenient to define the normalized current amplitudes through the Tx coils as:
 $$i_i = {\omega L_{Tx} \over \vert {\bf V}_{in}\vert} \vert {\bf I}_i\vert,$$
with i = 1, 2, and hence to introduce the coil quality factor QTx and the coupling coefficient kTx between the two adjacent Tx coils,
 $$Q_{Tx} = {\omega L_{Tx} \over R}\comma \quad k_{Tx} = {M_{Tx} \over L_{Tx}}.$$
From (3), it is then possible to obtain the following expressions of the normalized current amplitudes as a functions of the capacitance ratio α:
 $$\eqalign{i_{1} &= i_{3} = {\left \vert k_{Tx}\right \vert \left({\alpha} + 1\right)^{2} Q_{Tx}^{2} \over \sqrt{\gamma^{2} + 4 k_{Tx}^{2} \left({\alpha} + 1\right)^{4} Q_{Tx}^{2}}} \cr & i_{2} = {\left({\alpha} + 1\right) Q_{Tx} \sqrt{\left({\alpha} - 2 k_{Tx} - 1\right)^{2} Q_{Tx}^{2} + \left({\alpha} + 1\right)^{2}} \over \sqrt{\gamma^{2} + 4 k_{Tx}^{2} \left({\alpha} + 1\right)^{4} Q_{Tx}^{2}}},}$$
where
 $$\eqalign{\gamma=& \,\left({\alpha} + 1\right)^{2} + \cr & \left[\left(2 k_{Tx} + 1\right) \left({\alpha} - 1\right)^{2} + 2 k_{Tx}^{2} \left({\alpha}^{2} + 1\right)\right] Q_{Tx}^{2}.}$$
Loop currents in intermediate state B
For state B, the currents in the loops can be determined by solving the equations
 $$\eqalign{&\left[R + j\left(\omega L_{Tx} - {1 \over \omega C_{Tx,o}}\right)\right]{\bf I}_1 + j\omega M_{Tx} {\bf I}_2 = 0 \cr & j\omega M_{Tx} {\bf I}_1 + \left[R + j\left(\omega L_{Tx} - {1 \over \omega C_{Tx,e}}\right)\right]{\bf I}_2 = {\bf V}_{in}.}$$
In this case, using the definitions introduced in the previous sections, the normalized current magnitudes are expressed as
 $$\eqalign{&i_{1} = {\left \vert k_{Tx}\right \vert \left({\alpha} + 1\right)^{2} \over \sqrt{\left[\left(k_{Tx} + 1\right)^{2} \left({\alpha} - 1\right)^{2} + {\left({\alpha} + 1\right)^{2} \over Q_{Tx}^{2}}\right]^{2} + {4 k_{Tx}^{2} \left({\alpha} + 1\right)^{4} \over Q_{Tx}^{2}}}} \cr & i_{2} = {Q_{Tx}^{-1} \left({\alpha} + 1\right) \sqrt{\left({\alpha} - 2 k_{Tx} - 1\right)^{2} Q_{Tx}^{2} + \left({\alpha} + 1\right)^{2}} \over \sqrt{\left[\left(k_{Tx} + 1\right)^{2} \left({\alpha} - 1\right)^{2} + {\left({\alpha} + 1\right)^{2} \over Q_{Tx}^{2}}\right]^{2} + {4 k_{Tx}^{2} \left({\alpha} + 1\right)^{4} \over Q_{Tx}^{2}}}}.}$$
Loop currents in intermediate state C
In state C the loop currents are obtained by solving the equations
 $$\eqalign{&\left[R + j\left(\omega L_{Tx} - {1 \over \omega C_{Tx,o}}\right)\right]{\bf I}_1 + j\omega M_{Tx} {\bf I}_2 = 0 \cr & j\omega M_{Tx} {\bf I}_1 + \cr &\left(2R + 2 j \omega L_{Tx} - {\,j \over \omega C_{Tx,e}}- {\,j \over \omega C_{Tx,o}}\right){\bf I}_2 = {\bf V}_{in},}$$
which provide
 $$\eqalign{&i_{1} = {\left \vert k_{Tx}\right \vert \left({\alpha} + 1\right) \over \sqrt{\left({\alpha} + 1\right)^{2} \left(2 + k_{Tx}^{2} Q_{Tx}^{2}\right)^{2} + 4 \left({\alpha} - 2 k_{Tx} - 1\right)^{2}}} \cr & i_{2} = {Q_{Tx} \sqrt{\left({\alpha} - 2 k_{Tx} - 1\right)^{2} Q_{Tx}^{2} + \left({\alpha} + 1\right)^{2}} \over \sqrt{\left({\alpha} + 1\right)^{2} \left(2 + k_{Tx}^{2} Q_{Tx}^{2}\right)^{2} + 4 \left({\alpha} - 2 k_{Tx} - 1\right)^{2}}}.}$$
Optimum odd and even capacitances
The current magnitudes with respect to the capacitance ratio, α, are shown in Fig. 8. They are computed from the equations derived in the previous sections, assuming Q Tx = 20 and k Tx = −0.0595, which are the values derived for the realized prototype described in the next section. The same currents are also computed by circuital simulations, which are practically identical to the theoretical ones and are perfectly superimposed in Fig. 8.
Magnitude of I 1 and I 2 when the system is in states A, B, and C. In state A the magnitude of I 3 is equal to the magnitude of I 1.
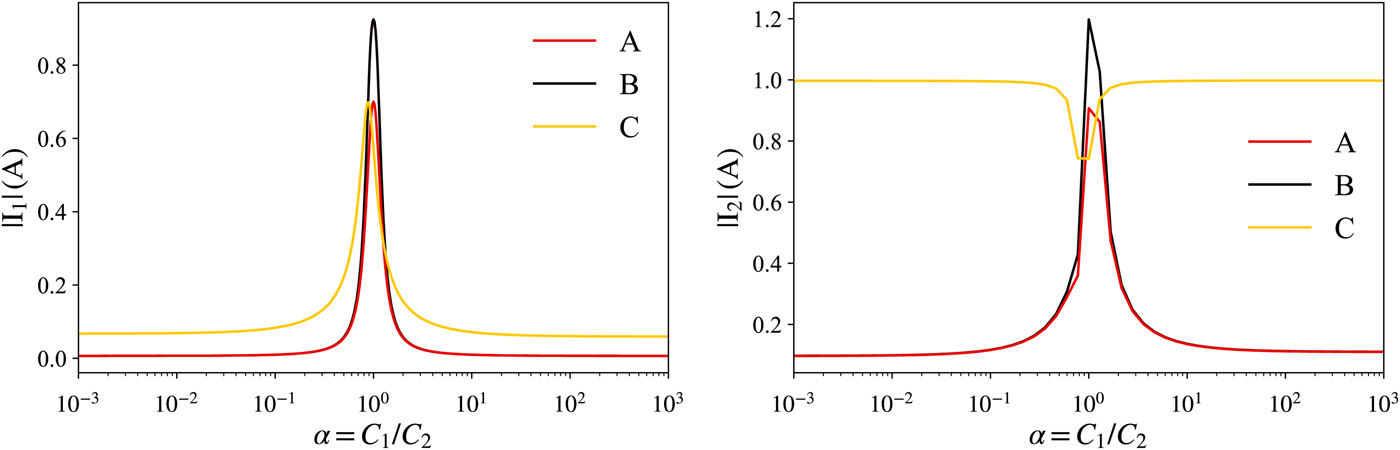
The maximum current amplitude of the shorted LC branches in states A and B, I 1, occurs for α = 1, which corresponds to equal compensating capacitances, while it rapidly decreases and becomes practically negligible as α tends to zero or to infinity.
In state A the amplitude of I 3 has exactly the same behavior as the amplitude of I 1.
Similarly, the amplitude of I 2 has a peak for α = 1, when the active LC branch resonates, and tends to a lower constant value for lower or higher values of α, when the branch impedance is dominated by a capacitive or by an inductive contribute.
State C exhibits a different behavior. In this case, two LC branches are simultaneously activated, and their series connection resonates for all values of α. When α is far from 1, this results in a higher amplitude of I 2. However, in these conditions, the shorted LC loop exhibits a high impedance, and consequently, the amplitude of the induced current I 1 is low. Furthermore, when the receiver is loaded, the current I 2 is limited by the load itself and therefore it is a safe condition. When α approaches 1, the shorted LC branch tends to resonate, and the amplitude of I 1 increases. This also causes an increase of the reflected impedance seen by the active resonators, and, consequently, a reduction of the amplitude of I 2, which, in turn, tends to limit the increase of I 1. Due to this interaction between the coupled Tx coils, the maximum of I 1 and the minimum of I 2 do not occur for α = 1, but for α = 1 + 2k Tx, which, in the present case, corresponds to about 0.88.
It can be noted that, in all cases, the current amplitude of the shorted loops is small, and practically independent from the capacitance ratio, for α ≪ 0.1 or α ≫ 10. As a consequence, a convenient choice can be to set α = 0, which simply corresponds to replace the even capacitors (C Tx,e) with shorts and to keep the odd ones, whose value must be C Tx,o = 1/(ω 2 L Tx) to preserve the nominal resonance frequency. Equivalently, it is possible to set α = ∞, which corresponds to keep only the even capacitors.
Experimental validation
To validate the theoretical results, the prototype shown in Fig. 9(a) is realized. The system consists of six Tx resonators and a movable Rx, placed on a sliding guide. The geometrical dimensions of the coils are reported in Fig. 1 and correspond to an inductance of 240 nH for the Tx coils and 277 nH for the Rx coil. The switches between the Tx coils are realized with the Vishay type VO14642AT Solid State Relays, which have an on-resistance of 0.1Ω and an off-capacitance of 200 pF. These are low-cost components, chosen for the realization of the first prototype in order to demonstrate the validity of the theoretical approach. They are not intended as a final solution, where the choice must be carefully done based on the required power and selected frequency. Indeed, the quality factors of the resonators with the switches included are quite low (Q TOT < Q Tx = 20), justifying the low efficiency which will be obtained in the results. Bigger coils increase the quality factor and therefore the efficiency, but the efficiency is not the goal of this paper.
System to be measured: (a), a top view of the system and (b), the complete set-up to be measured.
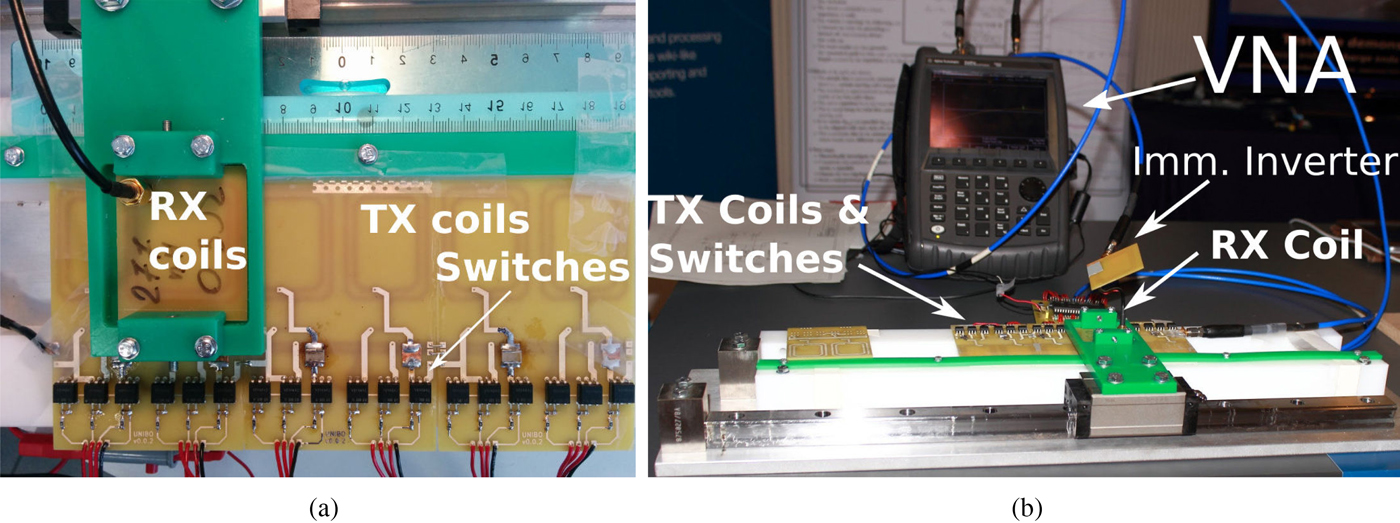
The link has been measured from the AC Tx input port to the AC Rx output port (Fig. 9(b)) using a Agilent FieldFox N9923A Vector Network Analyzer. 130 different positions of the receiver have been considered with 1 mm step, starting from the configuration where the Rx coil is aligned to the first Tx coil and ending with the Rx coil aligned with the fifth Tx coil. The last Tx coil is not powered during the measurements, but it is used because its switches are needed to complete the experiment.
Real coupling coefficient
A first set of measurements investigates the effects of parasitic capacitances in the switches on the coupled inductances. For this purpose, only the coupled coils with the switches are measured; therefore all compensating capacitors are short circuited and the Rx impedance inverter is removed. The impedance matrix (ZS) of the two-port network formed by two series connected Tx coils, by the Rx coil, and by the switches is measured. Figure 10 reports the imaginary parts of its elements Z S11, Z S12( = Z S21), and Z S22, where ports 1 and 2 correspond to the Tx and Rx port, respectively. Each line corresponds to a different Rx position (130 position in total are considered, corresponding to a 13 cm displacement). These plots show a linear frequency dependence, thus a purely inductive behavior, only up to about 6–6.5 MHz. At higher frequencies, the effect of the parasitic capacitances becomes evident. In particular, a resonance at about 8 MHz can be observed.
(a), (b), (b), elements of the measured impedance matrix of the coupled inductors, indexes 1 and 2 correspond to the Tx and Rx port, respectively, (d) generalized coupling coefficient (11), (e) efficiency (12) and (f) output voltage (with V in = 1V). Each line, partly transparent to express a density, corresponds to a different Rx position: 130 positions with 1 mm step are considered, from the Rx aligned with the first Tx, to the Rx aligned with the fifth Tx. In (a)–(d) the compensating capacitors have been shorted.

Starting from these results, the quantity
 $$ \chi_{12S}={{\rm Im}(Z_{12}) \over \sqrt{\vert {\rm Im}(Z_{11}){\rm Im}(Z_{22})\vert}},$$
which will be referred as the generalized coupling coefficient is calculated. It can be noted that at the lower frequencies, when the system behaves as two coupled inductances, χ 12S corresponds to the ordinary coupling coefficient. On the other hand, the non idealities in the actual setup, such as the C SW and L L, cause negative values of equivalent inductance near the resonance and in these conditions the usual coupling coefficient can no longer be defined.
The dependence of χ 12S on frequency is shown in Fig. 10(d). These results show that the impact of the switches parasitics is not negligible at the frequency of 6.78 MHz. Nevertheless, the parasitics capacitances do not practically affect its dependence on the Rx position. The curves corresponding to different Rx positions remain well superimposed (each curve is a different position), even for frequencies close to the resonance, proving how effective and the rugged is the proposed approach under severe parasitic effects.
Output voltage and AC–AC efficiency
The second set of measurements characterizes the whole AC–AC link, for a wide range of loading resistances, in terms of output voltage (V out) and efficiency (η):
 $$ \eta = {P_{out} \over P_{in}}.$$
For this set-up the compensating capacitors (C Tx,o) and the Rx impedance inverter are included. Figure 10 shows these measurements, in the same 130 Rx positions considered before. According to the previous discussion, only the capacitors C Tx,o (α = 0) are connected in series with the Tx resonators, whereas the capacitors C Tx,e are replaced with short circuits. The measured efficiency at 6.78 MHz is reported in Fig. 10(e) as a function of the load resistance, which varies from 100Ω to 1 kΩ and where each curve corresponds to a different Rx position.
Since the goal is not a state-of-the-art efficiency, but a proof of work of the proposed framework which avoids the over-currents, a peak efficiency of 65% is an acceptable result. As outlined before, the switch losses reduce significantly the quality factor of such small coils, leading to low efficiencies. Furthermore, the switch off capacitances C SW and line inductances L L increase the output voltage variations [Reference Pacini, Mastri, Trevisan, Masotti and Costanzo20]. Bigger coils and proper switches would easily increase the efficiency and reduce the variations, but without any added value to the goal of this work.
Characterization of the intermediate states
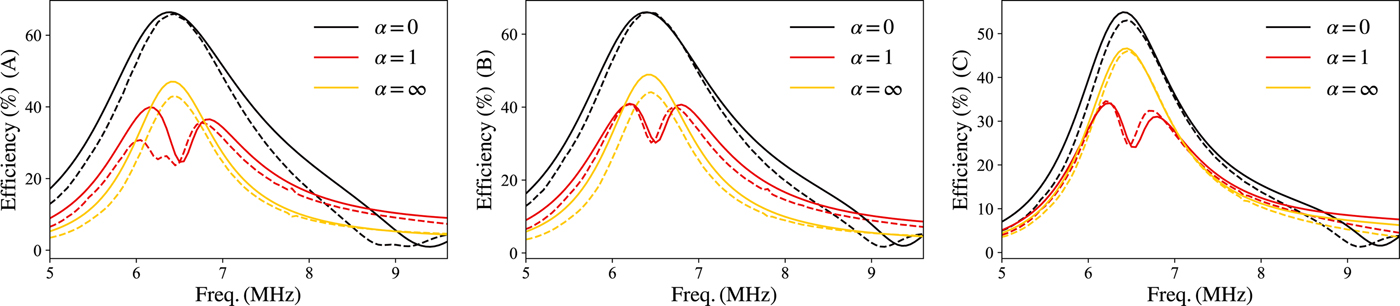
A last set of measurements verify the currents in the critical loops, formed in the states A, B, and C when α is varied. For this purpose, let the receiver be aligned to the subsequent Tx coil (case II in Fig. 2(a)), hence where the active coils need to change. The efficiency shows the over-currents in the critical closed loops: an efficiency reduction at the operating frequency indicates the presence of an over-current in the shorted resonators.
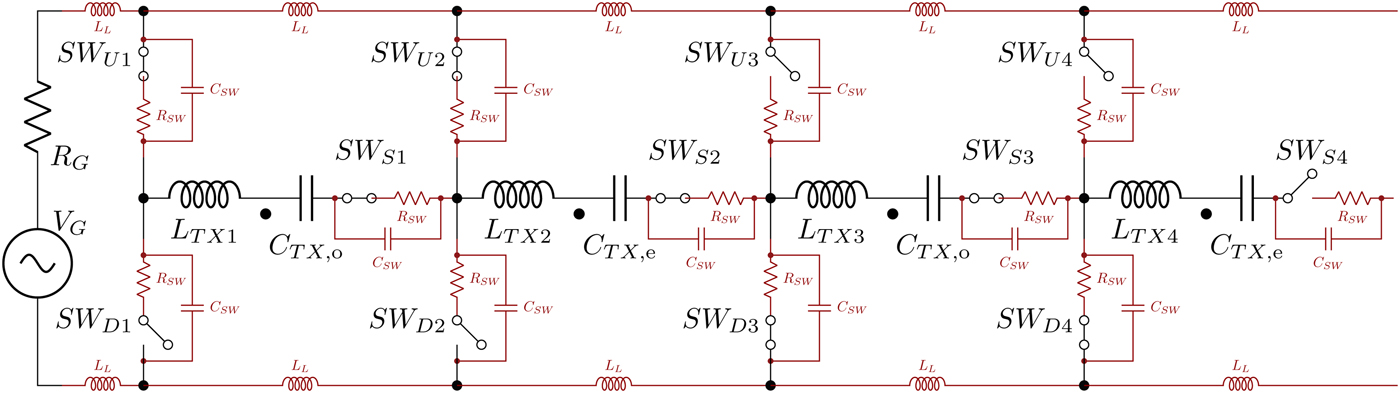
For each state, the measurement is repeated with three different configurations of the Tx capacitors, and consequently of α. For α = 1 the capacitors C Tx,o and C Tx,e are equal, for α = 0 only the capacitors C Tx,o are used, while the capacitors C Tx,e are replaced by short circuits, for α = ∞ only the capacitors C Tx,e are used. The layout in Fig. 11, which accounts for the stray capacitances of the open switches, the loss resistance of the closed switches and the inductances of the feeding lines, is numerically simulated (AC analysis [24]) and compared with measurements in Fig. 12. As expected, for α = 1, all the curves have a notch in correspondence of the operating frequency and therefore over-currents in the closed loops. This problem is avoided when α = 0 or α = ∞.
Simulated layout of State A (equivalent to Fig. 4) with line stray inductances (L L = 20 nH), switch stray capacitances (C SW = 200 pF) and loss resistances (R SW = 100 m Ω). The R x is not shown but is included in the simulation as ideal. The other intermediate states are obtained by the proper selection of the switches.
Measured (solid lines) and simulated (AC analysis, dashed lines) efficiency with the system in state A, B, and C.
Conclusions
A complete framework for AC–AC WPT link, able to achieve almost constant coupling coefficient in moving resonant WPT systems, is proposed. The transmitting side consists of identical Tx coils disposed along the path which are series-connected in pairs and simultaneously activated, depending on the position of the receiving mover. Each time the Rx coil aligns with one of the Tx coils, the preceding Tx coil is deactivated and the following one is activated. The system behaves as a periodic structure with quasi-constant coupling coefficient.
The system is first analytically analyzed to minimize the over-currents which appear in the shorted loops for the intermediate states. This first analysis is performed in a worst case scenario, without the receiver. Second, the system is simulated with the receiver and the parasitics included. The presence of an over-current determines a notch in the efficiency and the effect of uneven capacitors is the same as analytically predicted. Lastly, a prototype is measured and this validates, with good agreement, the previous analysis.
The work proves that a simple solution, such as unbalancing the capacitors at the Tx coils and ensuring the resonant operation of the pair of series connected coils rather than the single one, is the successful choice to minimize the over-currents during the coil change.
 Alex Pacini received the Master Degree in Electrical and Telecommunication Engineering (summa cum laude) at the University of Bologna in 2015. He is currently a PhD student at the same university.
 Franco Mastri received the Laurea degree (with honors) in Electronic Engineering from the University of Bologna, Bologna, Italy, in 1985. In 1990, he became a Research Associate with the Istituto di Elettrotecnica, University of Bologna, and since 2005 he has been an Associate Professor of Electrotechnics with the Department of Electrical, Electronic, and Information Engineering ‘Guglielmo Marconi’, University of Bologna. His research interests include nonlinear-circuit simulation and design techniques, nonlinear RF device modeling, stability and noise analysis of nonlinear circuits, nonlinear/electromagnetic co-simulation of RF systems, and systems for wireless power transmission. He authored four book chapters and over 120 papers on international journals and conferences.
 Diego Masotti received the Ph.D. degree in electric engineering from the University of Bologna, Italy, in 1997. In 1998 he joined the University of Bologna as a Research Associate of electromagnetic fields. His research interests are in the areas of nonlinear microwave circuit simulation and design, with emphasis on nonlinear/electromagnetic co-design of integrated radiating subsystems/systems for wireless power transfer and energy harvesting applications. Dr. Masotti serves in the Editorial Board of the International Journal of Antennas and Propagation and of the Cambridge Journal of Wireless Power Transfer, and is a member of the Paper Review Board of the main Journals of the microwave sector. He is IEEE Senior Member since 2016.
 Alessandra Costanzo is an associate professor at the University of Bologna, Italy. She is currently involved in research activities dedicated to the wireless power transmission, adopting both far-field and near-field solutions, for several power levels and operating frequencies. She has authored more than 200 scientific publications on peer-reviewed international journals and conferences and several chapter books. She is a co-founder of the EU COST action IC1301 WiPE ‘Wireless power transfer for sustainable electronics’ where she chairs WG1: ‘far-field wireless power transfer’. She is the chair of the MTT-26 committee on wireless energy transfer and conversion and member of the MTT-24 committee on RFID. She serves as associate editor of the IEEE Transaction on MTT, of the Cambridge International Journal of Microwave and Wireless Technologies and of the Cambridge International Journal of WPT. Since 2016 she is steering committee chair of the new IEEE Journal of RFID. She is MTT-S representative and Distinguished Lecturer of the CRFID, where she also serves as MTT-S representative. She is IEEE senior member.



