1. Introduction
Physical phenomena in the real world are governed by fundamental laws. Traditionally, these laws have been derived from first principles through deductive reasoning and formulated as mathematical expressions, i.e. governing equations. However, as systems become increasingly complex, this traditional first-principles approach faces significant challenges. Recent breakthroughs in artificial intelligence (AI) are revolutionizing the natural sciences, driving a paradigm shift from first-principles modelling to data-driven approaches. In particular, symbolic regression has gained increasing attention for its ability to identify analytical expressions of governing equations directly from data (Brunton, Noack & Koumoutsakos Reference Brunton, Noack and Koumoutsakos2020; Wang et al. Reference Wang2023).
Long before the explosive development of AI, the concept of symbolic regression had already been embodied in evolutionary algorithms. For instance, genetic programming (GP) constructs symbolic expression trees (ETs) to fit data by simulating biological evolution (Koza Reference Koza1994). Bongard & Lipson (Reference Bongard and Lipson2007), as well as Schmidt & Lipson (Reference Schmidt and Lipson2009), pioneered the application of GP concepts to data-driven equation discovery, successfully constructing governing equations for low-dimensional systems from experimental data. Subsequent advances in GP-based methodologies have yielded notable equation discovery frameworks, including evolutionary partial differential equations (EPDE) (Maslyaev, Hvatov & Kalyuzhnaya Reference Maslyaev, Hvatov and Kalyuzhnaya2019), symbolic genetic algorithm to discover open form partial differential equations (PDEs) (SGA-PDE) (Chen et al. Reference Chen, Luo, Liu, Xu and Zhang2022) and PySR (Cranmer Reference Cranmer2023). Another evolutionary algorithm used for symbolic regression is gene expression programming (GEP) (Ferreira Reference Ferreira2001). Unlike GP, GEP employs fixed-length linear strings to control expression complexity and utilizes open reading frames (ORFs) to improve expression diversity. The GEP have been applied to the construction of Reynolds stress models (Weatheritt & Sandberg Reference Weatheritt and Sandberg2016; Zhao et al. Reference Zhao, Akolekar, Weatheritt, Michelassi and Sandberg2020), subgrid-scale models for large eddy simulations (Li et al. Reference Li, Zhao, Wang and Sandberg2021) and non-equilibrium constitutive equations (Ma et al. Reference Ma, Zhang, Feng, Xing and Wen2024b ). In parallel, a distinct class of symbolic regression approaches based on sparse regression has emerged. A landmark contribution is the sparse identification of nonlinear dynamics (SINDy) method developed by Brunton, Proctor & Kutz (Reference Brunton, Proctor and Kutz2016). The SINDy method transforms the discovery of ordinary differential equations into a sparse regression problem by identifying dominant terms from a library of nonlinear functions. Subsequent developments in this direction include the use of constrained Galerkin projection (Loiseau & Brunton Reference Loiseau and Brunton2018), the application of sparse regression to macroscopic hydrodynamic systems (Zhang & Ma Reference Zhang and Ma2020), the incorporation of weak-form formulations to expand candidate libraries (Gurevich et al. Reference Gurevich, Golden, Reinbold and Grigoriev2024) and the inference of hidden stochastic dynamics from high-dimensional data (Lu et al. Reference Lu, Zeng, Jiang, Zhu and Hu2024).
While data-driven equation discovery has made significant strides, studies have pointed out that purely data-driven methods are highly sensitive to data quality and quantity (Chen, Liu & Sun Reference Chen, Liu and Sun2021; Reinbold et al. Reference Reinbold, Kageorge, Schatz and Grigoriev2021; Cohen, Beykal & Bollas Reference Cohen, Beykal and Bollas2024). Such methods often suffer from overfitting and yield expressions that lack physical interpretability. To address these issues, researchers have incorporated physical constraints and prior knowledge into symbolic regression. For instance, Udrescu & Tegmark (Reference Udrescu and Tegmark2020) guided the search using physical inductive biases; Bakarji et al. (Reference Bakarji, Callaham, Brunton and Kutz2022) and Fukami, Goto & Taira (Reference Fukami, Goto and Taira2024) both leverage the Buckingham Pi theorem to guide data-driven discovery of physical laws; Chen et al. (Reference Chen, Liu and Sun2021) combined physics-informed neural networks with sparse regression technique; Wang et al. (Reference Wang, Ji, Huang, Zhou and Xie2025) combined physics-informed neural networks with unit constraints for robust PDE discovery.
Despite these advances, most existing methods focus on discovering scalar equations. As system dimension increases, the candidate function space in scalar regression methods grows exponentially. For instance, consider a time-invariant system in Cartesian coordinates. If only positions, velocities and their first-order spatial derivatives are considered, the number of independent variables jumps from three in one dimension to 15 in three dimensions. This exponential growth of the search space greatly diminishes the efficiency of equation identification.
A natural solution is to extend symbolic regression from discovering scalar equations to identifying tensor equations. Tensors inherently capture directional dependencies and exhibit transformation invariance (e.g. under translations, rotations and reflections), enabling more compact and physically meaningful representations of high-dimensional systems. In many physical domains, such as fluid mechanics, most physical quantities are intrinsically tensors. Therefore, the identification of tensor equations offers not only greater expressive power but also a more physically appropriate modelling framework.
At present, general-purpose methods for symbolic tensor equation discovery are still lacking. One representative method, the multidimensional GEP (M-GEP), requires prior construction of tensor and scalar bases via the Cayley–Hamilton theorem – a process that introduces case-specific bias and demands additional manual effort (Weatheritt & Sandberg Reference Weatheritt and Sandberg2016). Another method, the Cartesian tensor-based sparse regression, effectively identifies equations through regression techniques but shares certain limitations common to sparse regression approaches – such as constrained expressive capability and sensitivity to noise (Zhang et al. Reference Zhang, Lei, Sun, Ding and Guo2025). Besides, both methods identify non-dimensional governing equations without explicitly incorporating physical constraints during training. In addition, other methods such as rheological universal differential equations (Lennon, McKinley & Swan Reference Lennon, McKinley and Swan2023) and sparse physics-informed discovery of empirical relations (Golden et al. Reference Golden, Grigoriev, Nambisan and Fernandez-Nieves2023; Gurevich et al. Reference Gurevich, Golden, Reinbold and Grigoriev2024), incorporate translational invariance and symmetry into their frameworks.
In this work, we propose a general data-driven framework for identifying tensor equations, termed symbolic identification of tensor equations (SITE). The SITE offers a broadly applicable approach for identifying tensor governing equations across diverse domains. Inspired by M-GEP, SITE encodes tensor expressions using a host–plasmid architecture but adopts a different evolutionary strategy to enhance robustness. To address the challenges of large, redundant search spaces and the generation of physically meaningless expressions, SITE incorporates dimensional homogeneity check (DHC) during evolutionary process. Additionally, a tensor linear regression (TLR) technique is introduced to replace the conventional linear scaling step (Keijzer Reference Keijzer2003) used in scalar symbolic regression, significantly accelerating convergence and improving numerical accuracy.
The remainder of this paper is organized as follows. Section 2 introduces the SITE methodology in detail. Section 3 presents numerical experiments on two benchmark problems to validate the robustness and accuracy of SITE. Section 4 explores the discovery of constitutive relations from molecular simulation data, and § 5 summarizes our key conclusions.
2. Methodology
This section presents the methodological design of SITE. As illustrated in figure 1, the process of symbolic identification using SITE begins with data preparation and preprocessing. A terminal library for both tensors and scalars is then constructed based on these physical quantities. Using this library and a predefined set of symbolic operators, SITE generates candidate equations by composing various symbolic structures, which are iteratively optimized through an evolutionary workflow.
We elaborate on the three core components of SITE that enable the identification of tensor equations with both physical interpretability and quantitative accuracy. The evolutionary process serves as the foundation for identifying tensor equation structures. In parallel, DHC and TLR ensure the physical interpretability and quantitative accuracy of the identified results, respectively.
Overview of the SITE framework. (a) Data preprocessing, including the calculation of the gradients of macroscopic quantities and construction of the terminal library. (b) Schematic diagram of tensor (host individual) and scalar (plasmid individual). (c) Flowchart of the evolutionary workflow.

2.1. Evolutionary process of SITE
2.1.1. Conventional GEP
The SITE implements the evolutionary process based on the conventional GEP and extends it to handle tensor equations through a nested host–plasmid architecture. To provide the necessary context, we begin with a brief overview of the conventional GEP algorithm.
In conventional GEP, an initial population of individuals – each representing a mathematical expression – is constructed. Each individual, or chromosome, is composed of one or more linear sequences called genes. These genes are formed by combining elements from a terminal library (containing variables and constants) and a function library (containing mathematical operators). Each gene consists of a head of fixed length
 $h$
, which may include functions and terminals, and a tail of length
 $t = h \times ({a_{\textit{max}}}) + 1$
, restricted to terminals only. Here,
 $a_{\textit{max}}$
means the max arity (the number of arguments a mathematical function takes) of the functions in the candidate function library. Each gene can be parsed into an ET using a deterministic decoding scheme, and the final expression represented by a chromosome is obtained by linking the outputs of multiple ETs using a predefined linking function (e.g. addition). Having multiple genes within a single chromosome enhances the representational power and exploratory capabilities.
After the initial population is generated, the fitness of each individual in the population is evaluated. The mean relative error is a common loss function used for evaluation, which is defined as
 \begin{equation} \mathcal{L}(Y,\hat Y) = \frac {1}{N}\sum \limits _{k = 1}^N {\left | {\frac {{{{\hat Y}_k} - {Y_k}}}{{{Y_k}}}} \right |} , \end{equation}
where
 $\hat Y_k$
is the
 $k$
th predicted value of all the
 $N$
data points and
 $Y_k$
is the ground truth.
Selection then proceeds using a hybrid strategy combining elitism and tournament selection, as designed in Ferreira (Reference Ferreira2001). Elites are retained directly, while others undergo genetic operations like mutation, transposition and crossover. For a detailed description of the genetic operators, refer to Appendix A. The evolutionary cycle repeats until either the loss of an expression falls below a predefined threshold or the maximum number of evolution generations is reached.
2.1.2. Extension to tensor equations based on M-GEP
We now extend the conventional GEP to handle tensor equations, focusing on second-order Cartesian tensors. The nested host–plasmid architecture used in SITE is adapted from M-GEP. The SITE enhances the evolutionary strategy and generalizes the framework to support a broader application in tensor equation identification.
Assume the general form of the tensor equation to be identified is
 \begin{equation} T_{\textit{ij}} = F(\{\boldsymbol{a}_{\textit{ij}}\},\{\boldsymbol{x}\}) , \end{equation}
where
 $T_{\textit{ij}}$
is the target second-order tensor, while
 $\boldsymbol{a}_{\textit{ij}}$
and
 $\boldsymbol{x}$
represent a group of second-order tensors and scalars, respectively. Our goal is to identify the underlying symbolic form
 $F(\boldsymbol{\cdot })$
from data.
To handle mixed-order tensor operations and incorporate scalars into tensor expressions, we adopt a host–plasmid architecture in SITE. Specifically, host individuals are used to represent second-order tensor expressions, while plasmid individuals, which exist in dependency on their host individuals, are used to embed scalars into the tensor expressions.
As shown in figure 1(b), the host gene uses a special ‘p’ operator to invoke a corresponding plasmid, enabling scalar-tensor coupling. In both the terminal library and the function library, we need to prepare two parts, corresponding, respectively, to the hosts (the blue part in the diagram) and the plasmids (the red part in the diagram). The host terminal library includes candidate second-order tensors, while its function library contains tensor operators with equal input and output tensor orders, such as tensor addition, tensor multiplication and inner product, as well as the ‘p’ operator used to invoke embedded scalar expressions. In contrast, the plasmid terminal library contains candidate scalars, and its function library includes basic scalar operators.
When a ‘p’ operator appears in a host gene, it triggers a scalar multiplication between the tensor below the ‘p’ in the ET and the scalar expression generated by the corresponding plasmid. For example, the last gene of the host individual in figure 1(b) has a head of length 5 and a tail of length 6. Here, the ORF determines which elements of a gene are used to construct the ET. Starting from the head of the gene, the ORF sequentially reads elements (functions or terminals) from left to right until it naturally terminates due to the gene’s structural constraints (such as the end of the tail or grammatical rules), ensuring that the generated ET is complete. The ORF and the tensor expression of this gene (
 $X_{\textit{ij}}^{n}$
) are
 \begin{equation} \begin{array}{l} \big [ {\begin{array}{*{20}{c}} + &{{{\text{p}}_2}}&{{\delta _{\textit{ij}}}}&{{A_{\textit{ij}}}} \end{array}} \big ],\quad X_{\textit{ij}}^n = {{\text{p}}_2}({A_{\textit{ij}}}) + {\delta _{\textit{ij}}}, \end{array} \end{equation}
respectively, where ‘
 $\text{p}_2$
’ will evoke the plasmid individual 2. The scalar expression represented by plasmid individual 2 is
 \begin{equation} \mu + (\mu \times p), \end{equation}
and the corresponding complete expression should be
 \begin{equation} X_{\textit{ij}}^n = (\mu + \mu \times p){A_{\textit{ij}}} + {\delta _{\textit{ij}}}. \end{equation}
In the specific implementation of SITE, the plasmid population construction is dynamic. The number of ‘p’ operators in a host chromosome determines how many plasmid individuals are attached to it. As illustrated in figure 2, for each ‘p’ operator, a plasmid individual is randomly generated at initialization, and all the plasmid individuals constitute the plasmid population. Essentially, the core evolutionary process is carried out by the host population with a fixed number of individuals, while the plasmid population is merely an appendage to the host population. The number of individuals in the plasmid population fluctuates in accordance with changes in the host population. Note that SITE retains unexpressed plasmids temporarily suppressed by genetic operations rather than destroying them. This strategy enhances robustness by retaining genetic diversity and preventing the premature loss of potentially useful subexpressions.
Schematic diagram of generating plasmid populations based on host population.

The evolutionary process of SITE (see figure 1 c) is similar to that of conventional GEP. In each generation, the host population is evaluated and selected based on fitness, guiding the progression of the evolutionary process. In contrast, the plasmid population does not undergo direct evaluation or selection. Instead, these plasmid individuals serve to assist in the evaluation of the host population, indirectly contributing to the evolutionary process. After selection, the host offspring will execute both modification and crossover operations, while the plasmid population evolves solely through modification. This design retains the linkage integrity between plasmids and their hosts, thereby avoiding disruptive recombination. The SITE adopts the same stopping criterion as conventional GEP, meaning that the evolutionary process ends when the loss value falls below a prescribed threshold or the maximum number of generations has been reached.
Since the target variable changes from a scalar to a tensor, we also need to design a loss function suitable for tensor symbolic regression. In SITE, the loss function used for evaluation is defined as
 \begin{equation} \mathcal{L}({y_{\textit{ij}}},{\hat y_{\textit{ij}}}) = \sum \limits _{i = 1}^{{n_{\textit{dim}}}} {\sum \limits _{j = 1}^{{n_{\textit{dim}}}} {\frac {{\| {{{\hat y}_{\textit{ij}}} - {y_{\textit{ij}}}} \|_2^2}}{{\| {{y_{\textit{ij}}}} \|_2^2}}} } , \end{equation}
where
 ${y_{\textit{ij}}} \in {\mathbb{R}^{{n_{{\textit{data}}}}}}$
and
 ${\hat y_{\textit{ij}}} \in {\mathbb{R}^{{n_{{\textit{data}}}}}}$
denote the value sequences across all data points for the
 $(i,j)$
th component of the target tensor
 $\boldsymbol{Y}$
and the predicted tensor
 $\boldsymbol{\hat Y}$
, respectively. Here
 $\| {{{\hat y}_{\textit{ij}}} - {y_{\textit{ij}}}} \|_2^2$
represents the squared
 $ L^2$
norm of the residual corresponding to the tensor component in a specific direction, while
 $\| {{y_{\textit{ij}}}} \|_2^2$
represents the squared
 $ L^2$
norm of the target tensor component. This loss function measures the average relative error across all tensor components. After several generations of evolution, the optimal tensor expression is identified.
2.2. DHC and seed injection strategy
In SITE, we introduce a fundamental physical constraint – dimensional homogeneity – into the equation discovery by performing DHC. We select the seven base physical quantities of the SI-unit system (i.e. mass (
 $M$
), length (
 $L$
), time (
 $T$
), electric current (
 $I$
), thermodynamic temperature (
 $\varTheta$
), amount of substance (
 $N$
) and luminous intensity (
 $J$
)) as the basic dimension. All known physical quantities’ dimensions can be derived by combining the above base dimensions.
Figure 3(a) presents the dimension vectors (DVs) used for dimensional analysis, where the specific numbers represent the exponents of the corresponding dimensions. In SITE, every element in the candidate terminal library is assigned a unique DV, which serves as an intrinsic attribute of the terminal. We determine the DV at each node, as well as the resulting DV of the entire expression, by traversing the ET from the bottom up. If the expression itself involves operations that violate the dimensional homogeneity constraint as shown in figure 3(b), a summation occurs between two nodes with different DVs, the individual is immediately classified as dimensionally inhomogeneous. If the expression is dimensional homogeneous, its resulting DV is then compared with that of the target variable; if the two DVs are identical, the individual is considered to satisfy the dimensional homogeneity constraint.
Schematic diagram of DVs and DHC.

In the SITE framework, the DHC is performed not only for scalar quantities but also extended to two additional cases involving tensors. First, for operations between tensors, since all components within a tensor share the same dimension, addition and inner products follow the same rules as in the scalar case. Second, for operations between tensors and scalars, SITE only involves scalar multiplication between a tensor and a scalar, following the scalar multiplication rules. Details of DHC for scalar expressions using DVs refer to Reissmann et al. (Reference Reissmann, Fang, Ooi and Sandberg2025).
In the evaluation step of the evolutionary workflow, for individuals that fail the DHC, the loss function is not applied to compute their loss value. Instead, they are assigned a sufficiently large loss, thus gradually eliminating expressions without physical meaning in the evolutionary process. The DHC acts as a strict physical constraint, which guarantees that all surviving equations satisfy dimensional homogeneity and effectively guides the evolutionary process towards physically meaningful solutions.
Schematic diagram of the seed injection strategy.

Note that increasing the number and length of host and plasmid genes to represent complex tensor expressions can sharply reduce the proportion of dimensionally consistent individuals, making it difficult for the population to generate valid expressions even after many generations. To mitigate this, we propose a seed injection strategy, inspired by population diversity enhancement mechanisms in evolutionary computation (Goldberg & Richardson Reference Goldberg and Richardson1987). Specifically, at fixed intervals during evolution, several host genes that individually satisfy the dimensional homogeneity constraint are manually generated and concatenated to form a single seed individual. Multiple copies of this individual are then injected into the host population. A schematic of this seed injection strategy is shown in figure 4. This strategy facilitates the emergence of dimensionally homogeneous expressions in early generations. Additionally, it helps the population escape local optima, analogous to how invasive species reshape ecological systems.
2.3. Tensor linear regression technique
Note that conventional GEP excels at exploring the functional form of equations but struggles with determining accurate numerical coefficients. This limitation arises because coefficient optimization in conventional GEP relies solely on the mutation of random numerical constants (RNC), a highly stochastic process that results in low efficiency in optimizing coefficients. To address this issue, the linear scaling technique (Keijzer Reference Keijzer2003) has been introduced into conventional GEP. This approach adjusts the output of candidate expressions through a global scaling factor, allowing for a better fit to the target data. This method proves effective in scalar contexts, as each individual adjusts all numerical values with a single scaling factor.
In tensor symbolic regression, using a single global scaling factor cannot effectively fit all components of a predicted tensor expression. To address this, we introduce a TLR technique, which assigns an independent coefficient to each gene and fits the predicted tensor expression to the target through a linear combination of tensor features. This approach enhances coefficient optimization efficiency and enables implicit feature selection by assigning different importance to different genes.
The TLR task in SITE is formulated as follows: for a given target tensor
 $Y_{\textit{ij}}$
and a set of tensor features
 $ (\!\!{\begin{array}{*{20}{c}} {{{ ( {{X_{\textit{ij}}}} )}_1}}& {\cdots} &{{{ ( {{X_{\textit{ij}}}} )}_{{n_{{\textit{gene}}}}}}} \end{array}}\!\!)$
expressed by host genes, where
 $i,j \in \{ 1,2, {\cdots} ,{n_{{\textit{dim}}}}\}$
are tensor indices corresponding to the physical spatial dimensions and
 $n_{\textit{gene}}$
denotes the number of host genes, we need to prepare their values at all
 $n_{{\textit{data}}}$
points. Given the values of all tensors at each data point, we can define the target tensor as
 \begin{equation} {y_{\textit{ij}}} = \left ( {\begin{array}{*{20}{c}} {{{( {{Y_{\textit{ij}}}} )}_1}}\\ \vdots \\ {{{({{Y_{\textit{ij}}}} )}_{{n_{{\textit{data}}}}}}} \end{array}} \right ) \end{equation}
and the set of tensor features as
 \begin{equation} {\varTheta _{\textit{ij}}} = \left ( {\begin{array}{*{20}{c}} {{{({{X_{\textit{ij}}}} )}_{11}}}& \ldots &{{{({{X_{\textit{ij}}}} )}_{1{n_{{\textit{gene}}}}}}}\\ \vdots & \ddots & \vdots \\ {{{({{X_{\textit{ij}}}})}_{{n_{{\textit{data}}}}1}}}& {\cdots} &{{{({{X_{\textit{ij}}}})}_{{n_{{\textit{data}}}}{n_{{\textit{gene}}}}}}} \end{array}} \right )\!. \end{equation}
Our objective is to seek a coefficient vector
 $\boldsymbol{w}$
such that the predicted
 $\hat {y}_{\textit{ij}}$
fits the target
 $y_{\textit{ij}}$
and minimizes the loss function. The loss function using in evaluation has been defined as (2.6). Here, the complete loss function in TLR is
 \begin{equation} \mathcal{L}({y_{\textit{ij}}},{\hat y_{\textit{ij}}}) = \sum \limits _{i = 1}^{{n_{\textit{dim}}}} {\sum \limits _{j = 1}^{{n_{\textit{dim}}}} {\frac {{{{({{\hat y}_{\textit{ij}}} - {y_{\textit{ij}}})}^T}({{\hat y}_{\textit{ij}}} - {y_{\textit{ij}}})}}{{{y_{\textit{ij}}}^T{y_{\textit{ij}}}}}} } . \end{equation}
The summation in (2.9) means that every component of a tensor is taken into account. The predicted
 $\hat {y}_{\textit{ij}}$
is obtained by a weighted linear combination of
 $n_{\textit{gene}}$
features:
 \begin{equation} \hat {y}_{\textit{ij}} = \left ( {\begin{array}{*{20}{c}} {{{({{{\hat Y}_{\textit{ij}}}})}_1}}\\ \vdots \\ {{{({{{\hat Y}_{\textit{ij}}}})}_{{n_{{\textit{data}}}}}}} \end{array}} \right ) = {\varTheta _{\textit{ij}}}{\boldsymbol{w}} = \left ( {\begin{array}{*{20}{c}} {{{({{X_{\textit{ij}}}})}_{11}}}& \ldots &{{{({{X_{\textit{ij}}}})}_{1{n_{{\textit{gene}}}}}}}\\ \vdots & \ddots & \vdots \\ {{{({{X_{\textit{ij}}}})}_{{n_{{\textit{data}}}}1}}}& {\cdots} &{{{({{X_{\textit{ij}}}})}_{{n_{{\textit{data}}}}{n_{{\textit{gene}}}}}}} \end{array}} \right )\left ( {\begin{array}{*{20}{c}} {{w_1}}\\ \vdots \\ {{w_{{n_{{\textit{gene}}}}}}} \end{array}} \right )\!. \end{equation}
The coefficient vector will be determined from
 \begin{equation} \boldsymbol{w} = \arg \min \mathcal{L}({y_{\textit{ij}}},{\hat y_{\textit{ij}}}). \end{equation}
By taking the partial derivative of the loss function and setting it to zero, an analytical solution for the coefficient vector
 $\boldsymbol{w}$
can be obtained as
 \begin{equation} {\boldsymbol{w}} = {\left ( {\sum \limits _{i = 1}^{{n_{\textit{dim}}}} {\sum \limits _{j = 1}^{{n_{\textit{dim}}}} {\frac {{\varTheta _{\textit{ij}}^T{\varTheta _{\textit{ij}}}}}{{y_{\textit{ij}}^T{y_{\textit{ij}}}}}} } } \right )^{ - 1}}\left ( {\sum \limits _{i = 1}^{{n_{\textit{dim}}}} {\sum \limits _{j = 1}^{{n_{\textit{dim}}}} {\frac {{\varTheta _{\textit{ij}}^T{y_{\textit{ij}}}}}{{y_{\textit{ij}}^T{y_{\textit{ij}}}}}} } } \right )\!. \end{equation}
For the analytical form of the coefficient vector to be valid, there is a prerequisite condition that the coefficient matrix must be non-singular. This condition is essentially equivalent to the features in the feature set
 $\varTheta _{\textit{ij}}$
being linearly independent. Therefore, to apply (2.12) for solving the coefficient vector, we need to first perform feature selection on the feature set, selecting all the linearly independent features to construct a reduced feature set
 $\varTheta _{\textit{ij}}^{\prime}$
and ensuring that it is column-linearly independent.
With the coefficient vector
 $\boldsymbol{w}$
, we change the predicted expression from the summation of each feature tensor to (2.10) before evaluation. The entire TLR process takes place after DHC and before evaluating the final loss, serving as the final optimization before an individual is evaluated. The coefficient vector of each individual is independent of its sub-ETs and is computed only before evaluation without participating in any subsequent genetic operations.
3. Validation on benchmark problems
We validate and demonstrate the capabilities of SITE in identifying tensor equations using two benchmark scenarios. These two cases correspond to well-established models in mathematical physics, namely the Maxwell stress tensor and the Reynolds-stress transport equation. Based on these benchmarks, we conduct a series of studies, including ablation experiments on key SITE components (TLR and DHC), comparative evaluations against state-of-the-art method, and tests of the robustness to data noise.
For benchmark problems with a known target equation, correctness can be assessed in an objective manner. Specifically, an identified equation is regarded as correct only if all its terms exactly match those in the target equation (Du et al. Reference Du, Chen, Nie, Lou and Zhang2024). Minor deviations due to numerical fitting errors are acceptable. Based on this criterion, the performance of SITE is quantified by a success rate, defined as the ratio of successful identifications to the total number of independent runs (five in this study). For both benchmark cases, we report the corresponding success rates in the results that follow. If the success rate is 100 %, the coefficients of the final reported equation are obtained by averaging the results of five independent runs. If the success rate is under 100 % (not 0 %), we take the successfully identified equations and perform the same average processing to obtain the reported equation. If the correct equation is not found in the five independent experiments, we report the optimal equation among them (the equation with the lowest loss).
3.1. Maxwell stress tensor
We first consider the Maxwell stress tensor in the context of electromagnetism. The Maxwell stress tensor, typically defined as
 \begin{equation} {T_{\textit{ij}}} = {\varepsilon _0}\left ( {{E_{i}}\kern-1pt{E_{\!j}} - \frac {1}{2}{E_k}{E_k}{\delta _{\textit{ij}}}} \right ) + \frac {1}{{{\mu _0}}}\left ( {{B_i}\kern-1pt{B_{\!j}} - \frac {1}{2}{B_k}{B_k}{\delta _{\textit{ij}}}} \right )\!, \end{equation}
describes the distribution of electromagnetic momentum and forces within a medium. Here,
 $E_i$
and
 $B_i$
are the components of the electric and magnetic fields, respectively,
 $\varepsilon _0$
is the vacuum permittivity and
 $\mu _0$
is the vacuum permeability.
A three-dimensional cube with sinusoidally varying fields is used to evaluate the behaviour governed by (3.1). The electric field is given by
 \begin{equation} E(x,y,z) = [{E_0}\sin (\pi\kern-1pt x),{E_0}\cos (\pi\kern-1pt y),{E_0}\sin (\pi\kern-1pt z)], \end{equation}
and the magnetic field is given by
 \begin{equation} B(x,y,z) = [{B_0}\cos (\pi\kern-1pt x),{B_0}\sin (\pi\kern-1pt y),{B_0}\cos (\pi\kern-1pt z)], \end{equation}
where
 ${E_0} = {10^6}{\text{ V m}^{-1}}$
and
 ${B_0} = {10^{ - 3}}{\text{ T}}$
are fixed amplitudes. To construct the dataset, 150 spatial points are randomly sampled within the cube (
 $- 1\leqslant x,y,z\leqslant 1$
), and the corresponding Maxwell stress tensor is computed analytically using (3.1). The schematic diagram of this case is shown in figure 5(a).
(a) Schematic diagram of the electric field, the magnetic field and sampled points. For clarity of illustration, only the vectors along the guiding dashed line are shown. (b) Trend lines of the electromagnetic field magnitude at the points along the guiding line in (a) before and after adding
 $5\,\%$
Gaussian noise. The solid line represents the ideal setting, and the dashed line represents the real situation.

In this case, the target variable is defined as
 $T_{\textit{ij}}$
. For tensors, the candidate function library and the candidate terminal library are defined as
 $\{ + , - , \boldsymbol{\cdot },{\text{p}}\}$
and
 $\{ {E_{i}}\kern-1pt{E_{\!j}},{B_i}\kern-1pt{B_{\!j}},{\delta _{\textit{ij}}}\}$
, respectively, while for scalars, the candidate function library and the candidate terminal library are defined as
 $\{ + , - , \times , \div \}$
and
 $\{ E_{i}E_{i},B_{i}B_{i},{\varepsilon _0},{\mu_0}\}$
. The candidate terminal libraries of different tests are exactly the same.
To highlight the contribution of TLR to improving coefficient optimization efficiency, we conduct comparative experiments under three configurations: (i) using only RNC, (ii) using only TLR and (iii) combining TLR with RNC. When TLR is not employed, RNC must be introduced into the scalar candidate terminal library to form numerical constants in expressions. These RNC are randomly sampled floating-point numbers within the range
 $[-10,10]$
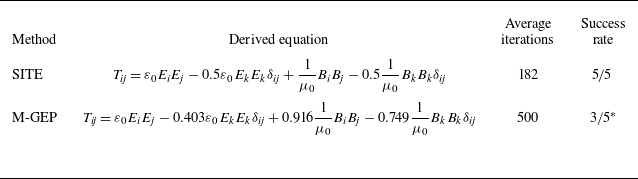
. The hyperparameter settings for the comparative experiments are basically the same, except that additional genetic operations need to be performed on RNC when they are introduced (see Appendix A). Detailed parameter settings for the SITE algorithm, such as the maximum number of evolutionary generations and the number of host individuals, are provided in Appendix B. The derived equations for this test, along with the number of iterations and the central processing unit (CPU) runtime (measured on a system equipped with a 13th Gen Intel Core i9-13900K CPU at 3.00 GHz, 32 GB RAM and running a 64-bit operating system), are summarized in table 1.
Performance comparison of SITE using different coefficient optimization configurations.

Performance comparison between SITE and M-GEP.

*Note that one of the three success runs does not explicitly include
 $\varepsilon _0$
and
 $\mu _0$
, but the approximate coefficients were numerically consistent with their values. Considering that M-GEP uses non-dimensionalization to preprocess the data instead of using DHCs to constrain the evolutionary process, we think this equation with low discrepancy can also be regarded as successfully identifying the target equation.
It can be seen from table 1 that regardless of whether TLR is used, SITE is capable of discovering complex tensor equations from the data. However, the success rate shows a clear difference across configurations. Without TLR, the framework fails to identify a completely correct equation in all five runs, yielding a success rate of 0
 $/$
5 even after the maximum number of evolutionary generations. Specifically, the coefficients of the discovered terms are incorrect and the combination of
 ${B_k}{B_k}{\delta _{\textit{ij}}}$
and
 $({1}/{{{\mu _0}}})$
is not identified. This is because optimization based on RNC relies only on completely random mutations to alter the numerical coefficients in the expression. In contrast, when TLR is used, SITE consistently identifies the exact target equation in all five runs, achieving a success rate of
 $5\kern-0.5pt/\kern-0.5pt5$
and substantially reducing the number of iterations required. It is evident that TLR substantially improves the efficiency and accuracy of tensor equation identification. Moreover, we tested a third configuration where RNC are removed and only TLR is used. The SITE achieves the same accuracy within 182 iterations on average, demonstrating that TLR alone is sufficient to achieve both high accuracy without relying on RNC. Since the mingling of RNC with symbolic terminals sometimes may hinder the generation of concise expressions, all cases in this article use only TLR to optimize coefficients unless otherwise specified.
To further benchmark SITE against the state-of-the-art method, we compare it with the latest EVE-3 implementation of M-GEP using the same dataset as above. As shown in table 2, M-GEP achieves a success rate of
 $3\kern-0.5pt/\kern-0.5pt5$
with an average of 500 iterations. In one of these successful runs, the discovered equation does not explicitly include
 $\varepsilon _0$
and
 $\mu _0$
, yet the approximate coefficients are numerically consistent with their physical values. Since M-GEP relies on non-dimensionalization for preprocessing instead of enforcing dimensional homogeneity as in SITE, such cases are still regarded as successful identifications. In contrast, SITE consistently identifies the exact Maxwell stress tensor equation in all five runs, with an average of only 182 iterations. These results highlight that SITE not only ensures higher reliability (success rate
 $5\kern-0.5pt/\kern-0.5pt5$
versus
 $3\kern-0.5pt/\kern-0.5pt5$
for M-GEP), but also achieves better efficiency.
To evaluate the robustness of SITE to Gaussian noise, we test its performance under three noise levels:
 $5\,\%$
,
 $10\,\%$
and
 $20\,\%$
. Specifically, as illustrated as figure 5(b), Gaussian noise is first added to the electric and magnetic field strengths to generate perturbed physical quantities. Then, Maxwell stress tensors are computed from these noisy fields and further perturbed by Gaussian noise of the same level. These noisy data are used for the subsequent tests. Here, we use both RNC and TLR here to get results quickly.
The derived equations with different levels of noise are listed in table 3. The error in the table is defined as the average relative error of the identified non-zero coefficients with respect to the ground truth. When Gaussian noise is added, the coefficients in the equation identified by SITE deviate increasingly from the ground truth as the noise level increases, and the error grows almost linearly with the noise level. Even with up to
 $20\,\%$
Gaussian noise, SITE still successfully identifies the complete structure of the expression, although there are some deviations in the coefficients. This proves that the framework has great robustness against artificial noise.
Equations identified by SITE under different levels of Gaussian noise (
 $5\,\%$
,
 $10\,\%$
and
 $20\,\%$
).

3.2. Reynolds-stress transport equation
In many physical systems, the evolution of tensors is governed by time-dependent differential equations. To evaluate the capability of SITE to identify such dynamic tensor equations, we consider the following general form of a time-dependent tensor evolution equation:
 \begin{equation} \frac {{{\rm d}{T_{\textit{ij}}}}}{{{\rm d}t}} = F(\{\boldsymbol{a}_{\textit{ij}}\},\{\boldsymbol{x}\}) \end{equation}
where
 $T_{\textit{ij}}$
is a second-order tensor, while
 $\boldsymbol{a}_{\textit{ij}}$
and
 $\boldsymbol{x}$
represent a group of second-order tensors and scalars, respectively. Note that when spatial derivatives of the tensor
 $T_{\textit{ij}}$
appear on the right-hand side of the equation, it becomes a PDE.
To generate data for the discovery of this kind of tensor equation, simulations are performed for three-dimensional compressible decaying homogeneous isotropic turbulence. The simulation employs a uniform grid of
 $32\times 32\times 32$
cells, a backward Euler time advancement scheme with a time step of
 ${1 \times {10}^{-7}}\,\textrm {s}$
, and a total simulation time of
 ${4 \times {10}^{-6}}\,\textrm {s}$
. Argon gas is used as the working fluid, with initial conditions of
 ${273.15}\,\textrm {K}$
temperature, 100 000 Pa pressure and zero mean velocity. The initial turbulent kinetic energy is set to
 ${4265.9}\,{{\textrm {m}}^2\, {\textrm {s}}^{-2}}$
, corresponding to an initial turbulent Mach number of 0.3. The flow is initialized following the procedure of Ma et al. (Reference Ma, Yang, Chen, Feng, Cui and Zhang2024a
), and computed using the open-source solver OpenFOAM with periodic boundary conditions (Jasak, Jemcov & Tukovic Reference Jasak, Jemcov and Tukovic2007) In our simulation, a modelled Reynolds stress transport equation is solved in OpenFOAM using the Launder–Reece–Rodi model (Launder, Reece & Rodi Reference Launder, Reece and Rodi1975). Therefore, the target governing equation takes the form
 \begin{equation} \frac {{\rm D}(\rho\kern-1pt R_{\textit{ij}})}{{\rm D}t} = \rho\kern-1pt P_{\textit{ij}} - 1.8\frac {\varepsilon }{k}\rho\kern-1pt R_{\textit{ij}}^* - 0.6\rho\kern-1pt P_{\textit{ij}}^* - \frac {2}{3}\rho \varepsilon \delta _{\textit{ij}} + D_{\textit{ij}}, \end{equation}
where the Reynolds stress is defined as
 $R_{\textit{ij}}=\overline {u_i' u_{\!j}'}$
,
 $\rho$
is the density,
 $k$
the turbulent kinetic energy and
 $\varepsilon$
the dissipation rate. Here,
 $(\boldsymbol{\cdot })^*$
denotes the trace-free part of a tensor and
 ${\rm D}(\boldsymbol{\cdot })/{\rm D}t$
the material derivative. In this formulation, the production term
 $P_{\textit{ij}}$
is computed explicitly from the resolved mean flow, while the remaining terms are modelled slow and rapid pressure-strain correlations, dissipation and diffusion terms, respectively. All tensors and scalars in (3.5) are directly computed and output by the solver.
In the previous case, we have evaluated the robustness of the framework under Gaussian noise. In this case, we further conduct more challenging noise robustness tests – all the physical quantities used are derived from the computational fluid dynamics simulation results. Specifically, two representative datasets are constructed: (i) a clean dataset, where the target material derivative is assembled directly from the right-hand side of (3.5); and (ii) a noisy dataset, where the target tensor is taken from solver outputs and thus contains discretization errors. Both datasets consist of 200 randomly sampled spatiotemporal points, and remain fixed across independent SITE runs.
The target variable is defined as
 $({{\rm D}(\rho R_{\textit{ij}})}/{{\rm D}t})$
. For tensors, the candidate function library and the candidate terminal library are defined as
 $\{ + , - , \boldsymbol{\cdot },(\boldsymbol{\cdot })^*,{\text{p}}\}$
and
 $\{P_{\textit{ij}}, R_{\textit{ij}}, D_{\textit{ij}}, \delta _{\textit{ij}} \}$
, respectively, while for scalars, the candidate function library and the candidate terminal library are defined as
 $\{ + , - , \times , \div \}$
and
 $\{\rho , k, \varepsilon \}$
.
As shown in table 4, SITE consistently recovers the correct equation from the clean dataset in all five independent runs, without any coefficient errors. For the noisy dataset, four out of five runs yield the correct equation structure with comparable accuracy. In the unsuccessful run, an additional traceless diffusion term
 $D_{\textit{ij}}^*$
appears with a small coefficient of
 $0.03$
, which is one order of magnitude lower than those of the dominant terms. This spurious term is attributed to data noise rather than physical relevance, indicating that while noise may occasionally induce weak redundant terms, the main physical effects are still robustly captured.
Equations identified by SITE from clean dataset and noisy dataset.

Beyond the above baseline results, we further challenge SITE on the clean dataset to test its expressive capability. Methodologically, SITE’s candidate tensor function library is designed to be both expressive and flexible, having the ability to contain operators such as trace-free and transpose. To intensify the test, we replace the turbulent production term
 $P_{\textit{ij}}$
with the raw velocity gradient tensor
 $\partial u_i/\partial x_{\!j}$
, where
 \begin{equation} P_{\textit{ij}} = - R_{\textit{ij}}\frac {\partial u_{\!j}}{\partial x_k} - R_{jk}\frac {\partial u_i}{\partial x_k}. \end{equation}
In this setting, SITE is required not only to recover all terms in the complete Reynolds-stress transport equation, but also to reconstruct
 $P_{\textit{ij}}$
from its lower-level components. Remarkably, the exact target equation was successfully identified within 1000 generations, highlighting the strong expressive capability of SITE.
For this problem, a direct comparison with M-GEP is not feasible. The reason is that M-GEP requires all necessary tensors to be explicitly prespecified in advance – for example, the trace-free tensors must be provided beforehand – whereas in our setting we allow the trace-free operator itself to be included as a candidate symbol in the function library, letting SITE autonomously select and construct the appropriate symbolic structures.
Additionally, we conduct an ablation study on the role of DHC using the clean dataset here. Table 5 summarizes the results for SITE with and without DHC. With DHC enabled, SITE consistently identifies the correct target equation in all five independent runs. In contrast, under our strict success criterion, the version without DHC produces the exact target equation only once out of five runs; although in the remaining runs it still achieves very low loss values by leveraging TLR, the resulting equations include spurious terms such as
 $\delta _{\textit{ij}}$
and
 $((({{\rho {\varepsilon ^2}}})/{{2k\varepsilon + k^2}})R_{\textit{ij}})$
, which are physically uninterpretable. In terms of efficiency, introducing DHC significantly reduces the number of non-physical candidate combinations that require evaluation, leading to fewer iterations per run and a markedly lower CPU runtime. These results confirm that DHC not only enhances the physical interpretability of the identified equations but also reduces the effective search space, thereby improving computational efficiency.
Performance comparison of SITE with or without DHC on the clean dataset.

4. Equation identification based on molecular simulation
We now apply SITE to high-fidelity data generated via direct simulation Monte Carlo (DSMC). Unlike the data of benchmark cases in § 3, the DSMC datasets are generated directly from microscopic particle interactions, without embedding any macroscopic governing equations such as the Navier–Stokes equations or predefined constitutive relations. Our goal is to demonstrate that SITE can discover the macroscopic tensor constitutive relation from molecular simulation data generated without imposing any macroscopic constitutive assumptions. Additionally, we evaluate SITE’s ability to identify the corresponding macroscopic forms under two distinct flow conditions and assess its robustness in capturing small-magnitude terms.
4.1. Data generation and preprocessing
In this section, we employ the DSMC method (Bird Reference Bird1994) to generate flow field data, following the approach in Zhang & Ma (Reference Zhang and Ma2020) and Ma et al. (Reference Ma, Zhang, Feng, Xing and Wen2024b
). Since the aim of this section is to discover tensor macroscopic governing equations of fluid dynamics, it is crucial that the data be independent of macroscopic modelling assumptions. The DSMC method fulfils this requirement by simulating particle dynamics without reliance on predefined continuum-level equations such as the Navier–Stokes equations. In DSMC, each simulation molecule statistically represents a large number of real molecules. From these molecular-level dynamics, macroscopic physical quantities are obtained via statistical averaging. For instance, the velocity field (
 $v_i$
) and the pressure tensor field (
 $p_{\textit{ij}}$
) are computed as
 \begin{equation} {v_i} = \frac {1}{{{N_{\textit{p}}}}}\sum \limits _{{\textit{cell}}} {{c_i}} ,\quad {p_{\textit{ij}}} = \frac {{mF}}{{{V_{{\textit{cell}}}}}}\left ( {\sum \limits _{{\textit{cell}}} {{c_i}}\kern-1pt{c_{\!j}} - {N_{\textit{p}}}{v_i}\kern-1pt{v_{\!j}}} \right )\!, \end{equation}
where
 $N_{\!p}$
is the number of simulation molecules in the sampling cell,
 $c_i$
is the velocity of the
 $i$
th particle,
 $m$
is the molecular mass and
 $F$
is the simulation ratio in DSMC. With the data generated from DSMC, we can construct a mapping from spatial coordinates to various macroscopic variables. As illustrated in figure 1(a), at each given data point
 $(x,y)$
, we associate corresponding physical quantities such as density
 $\rho (x,y)$
, horizontal velocity
 $u(x,y)$
and vertical velocity
 $v(x,y)$
.
In our study, two primary sources of noise affect the accuracy of equation discovery. One is the numerical noise arising from the computation of spatial gradients, and the other is the statistical noise inherent in particle-based methods such as DSMC. To mitigate the first type of noise, we apply the neural-network-based automatic differentiation technique to calculate gradients of physical variables. Specifically, an artificial neural network is trained to map spatial coordinates to macroscopic variables, and gradients of arbitrary order are obtained by backpropagating through the network. This allows accurate evaluation of spatial derivatives at any point in the domain. As for the statistical noise introduced by particle simulation, we can quantitatively estimate how the statistical error changes with the number of statistical samples (Hadjiconstantinou et al. Reference Hadjiconstantinou, Garcia, Bazant and He2003) with
 \begin{equation} {E_{\!Q}} = \frac {1}{{\sqrt {{N_0}M} }}\frac {{\sqrt {\left \langle {{Q^2}} \right \rangle } }}{{\left | {\left \langle Q \right \rangle } \right |}}, \end{equation}
where
 $E_{\!Q}$
represents the statistical error of quantity
 $Q$
,
 $\left \langle {{\boldsymbol{\cdot }}} \right \rangle$
means the statistical mean value,
 $N_0$
is the number of particles in a statistical cell and
 $M$
is the number of independent samples. In our study, we set the
 ${N_0}M$
of our simulation to
 $4 \times {10^9}$
, which means the statistical error of
 $p_{\textit{ij}}$
is around
 $10^{ - 5}$
. An error of this magnitude is acceptable for our experiments.
We simulate lid-driven cavity flows using the DSMC method described above. The simulated domain is a square cavity with a side length of
 $L = {1}\,\textrm {m}$
, filled with argon gas. All four walls maintain at a constant temperature of 273.15 K. The bottom, left- and right-hand walls are stationary, while the top wall (lid) moves horizontally at a constant speed. The number of grids is set to
 $400 \times 400$
. Each grid cell provides DSMC statistical outputs of the horizontal and vertical velocities, the four components of pressure tensor, the temperature and the static pressure. Two flow conditions are considered by setting the lid velocity to different values. In the first case, the lid speed is set to 50 m s–1, corresponding to a low-speed, nearly incompressible flow. In the second case, the lid velocity is increased to 337 m s–1, resulting in a transonic, compressible flow. The DSMC simulations employ the variable hard sphere model, in which the dynamic viscosity varies with temperature according to
 \begin{equation} \mu = {\mu _{{\textit{ref}}}}{\left ( {\frac {T}{{{T_{{\textit{ref}}}}}}} \right )^\omega } \end{equation}
where
 ${\mu _{{\textit{ref}}}}\,=\,{2.117\times {10}^{-5}}{{\textrm {kg}}(\textrm {m} \boldsymbol{\, }\textrm {s})^{-1}}$
denotes the reference viscosity coefficient,
 ${T_{{\textit{ref}}}} = {273.15}\,\textrm {K}$
denotes the reference temperature, and
 $\omega = 0.81$
denotes the viscosity exponent. The global Knudsen number in both cases is fixed at
 $K{\kern-1pt}n = 0.005$
.
To enable the computation of velocity gradients, we trained neural networks to learn the mapping from spatial coordinates to the two velocity components within the flow field. Specifically, we used all
 $400\times 400$
data points from the computational domain as the training set. The mapping was modelled using a fully connected feedforward neural network comprising eight hidden layers, each with 60 neurons and tanh activation functions. The training process was carried out in two stages. First, we used the Adam optimizer (Kingma & Ba Reference Kingma and Ba2017) for
 $20\,000$
iterations to achieve a reasonable initial solution. Then, the optimization was refined using the L-BFGS-B (Byrd et al. Reference Byrd, Lu, Nocedal and Zhu1995) optimization until convergence. This hybrid optimization strategy ensures both stability and precision in capturing smooth and differentiable velocity fields suitable for gradient extraction via automatic differentiation.
4.2. Constitutive equation discovery under different flow conditions
With the DSMC datasets described in § 4.1, we now apply SITE to identify the constitutive equations under both flow conditions.
In constructing the candidate function library, we introduced a set of basic tensor and scalar operators. As for the candidate terminal library, special consideration was given to the physical relevance of constitutive modelling. Since constitutive relation of pressure tensor reflects the transport of momentum in the flow field – and such transport is primarily driven by velocity gradients – we included physical quantities related to the velocity gradient tensor. The velocity gradient tensor
 ${D_{\textit{ij}}} = \partial {u_i}/\partial {x_{\!j}}$
can be decomposed into a symmetric and an antisymmetric part, given as
 \begin{equation} {D_{\textit{ij}}} = {S_{\textit{ij}}} + {\varOmega _{\textit{ij}}}, \end{equation}
where
 ${S_{\textit{ij}}} = ({1}/{2}) ( {{D_{\textit{ij}}} + {D_{ji}}} )$
is the symmetric strain-rate tensor, and
 ${\varOmega _{\textit{ij}}} = ({1}/{2}) ( {{D_{\textit{ij}}} - {D_{ji}}} )$
is the antisymmetric rotation-rate tensor. In both cases, the target variable is defined as
 $p_{\textit{ij}}$
. For tensors, the candidate function library is defined as
 $\{ + , - , \boldsymbol{\cdot },{\text{p}}\}$
and
 $\{ {S_{\textit{ij}}},{\delta _{\textit{ij}}}\}$
, respectively, while for scalars, the candidate function library and the candidate terminal library are defined as
 $\{ + , - , \times , \div \}$
and
 $\{ {D_{\textit{ii}}},p,\mu \}$
. For a detailed description of the construction of the candidate term library used in this study, please refer to Appendix C.
The last step before applying SITE is subsampling the dataset. To mitigate the influence of numerical noise when computing gradients near the boundaries, we restricted the sampling region to the central portion of the domain – specifically, the
 $20\,\%$
to
 $80\,\%$
range along both spatial directions. From this subregion, 200 data points were randomly selected and used for symbolic regression and equation discovery. Figure 6 illustrates the distribution of velocity magnitude (defined as
 $\sqrt {{u^2} + {v^2}}$
) across the domain in the compressible cavity flow case, along with a schematic representation of the sampled data points used for training. This selection strategy ensures that the discovered equations are based on high-quality gradient information. We exclude regions where boundary effects or numerical errors may distort the constitutive relation, while still retaining a sufficiently large and diverse dataset. It has been verified that the dominant terms identified by SITE are insensitive to the precise cutoff as long as noisy near-wall data are excluded. This strategy is a practical guideline. For other problems, a similar strategy can be adopted by first assessing the reliability of gradient information and then subsampling a central region large enough to capture the dominant physical effects.
For reference, the complete Newtonian constitutive relation is given by
 \begin{equation} {p_{\textit{ij}}} = - 2\mu {S_{\textit{ij}}} + \frac {2}{3}\mu {D_{\textit{kk}}}{\delta _{\textit{ij}}} + p{\delta _{\textit{ij}}}. \end{equation}
This form can be derived under the continuum hypothesis. The first term is the shear stress term, which arises from the internal friction caused by the relative sliding (shear deformation) between fluid layers, corresponding to the anisotropic behaviour of shear stress. The second term is the compressible term, accounting for the viscous resistance generated during volumetric changes. This term is typically negligible in incompressible flows where the velocity divergence is close to zero. The third term is the static pressure term, representing the isotropic compressive stress imposed by the thermodynamic pressure, which is independent of the flow state. In our DSMC simulations, the macroscopic constitutive relation is not imposed a priori. Since the global Knudsen number is small in this case, it is reasonable to expect that the effective constitutive relation should be close to Newtonian, but this does not imply that the ‘ground truth’ is (4.5). This is fundamentally different from a benchmark case. In this section, the success of equation identification is not judged by comparison with the Newtonian constitutive form, but rather by the objective metric of test error (refer to Appendix D for details). The reported identified equations are constructed from the results of five independent runs. Specifically, we only keep the common terms that appear across these runs, and average their coefficients to form the reported equation.
As shown in table 6, we summarize the constitutive equations discovered in the two test cases. The identified constitutive equations vary with the lid velocity, reflecting the features of different flow conditions. At the lower velocity, the discovered relation contains only the shear stress term and the static pressure term, which is consistent with the expectation that compressibility effects are weak when the flow remains nearly incompressible. At the higher velocity, an additional term proportional to
 $\mu D_{\textit{kk}}\delta _{\textit{ij}}$
emerges. This term accounts for the resistance associated with compressibility and indicates that the framework successfully detects flow-dependent physical contributions.
Identified equations of cavity flow.

Distribution of velocity magnitude in the compressible cavity flow case and the spatial locations of sampled data points used for SITE.

It is also noteworthy that the coefficients identified by SITE exhibit slight deviations from those in the classical Newtonian constitutive model. These discrepancies may be attributed to the fact that the simulated flows are not strictly within the continuum regime. Locally, some features of slip flow may appear. Based on the Knudsen number (
 $\textit{Kn}$
), flow regimes can be classified into continuum (
 $\textit{Kn} \lt 0.001$
), slip (
 $0.001 \lt \textit{Kn} \lt 0.1$
), transition (
 $0.1 \lt \textit{Kn} \lt 10$
) and free-molecular (
 $\textit{Kn} \gt 10$
) regimes (Reese, Gallis & Lockerby Reference Reese, Gallis and Lockerby2003). Since molecular simulations are computationally expensive in the fully continuum regime, we selected a global
 $\textit{Kn} = 0.005$
to balance accuracy and efficiency. Consequently, local deviations from continuum assumptions may still exist.
4.3. Discussion on magnitude disparities
A key challenge in data-driven modelling lies in the simultaneous identification of terms with vastly different magnitudes from noisy data. In our compressible cavity flow case, this issue becomes particularly evident. The off-diagonal components,
 $p_{xy}$
and
 $p_{yx}$
, are governed solely by shear deformation and is thus dominated by the symmetric part of the velocity gradient tensor. Consequently, identifying
 $S _{\textit{ij}}$
-related terms in this case is relatively straightforward. In contrast, the diagonal components of the pressure tensor tensor are composed of contributions from shear stress term, compressible term (linked to
 $\nabla \boldsymbol{\cdot} \boldsymbol{u}$
) and static pressure
 $p$
. Among these, the compressible term typically has the smallest magnitude in the current case (see figure 7).
Distributions of the constitutive terms in the xx-direction of the compressible cavity flow case. (a) Pressure tensor component
 ${p _{\textit{xx}}}$
, (b) static pressure
 $p$
; these two quantities have similar magnitudes and are shown with a shared colour scale. (c) Shear viscosity contribution
 $\mu {S_{\textit{xx}}}$
, (d) compressible contribution
 $\mu (\boldsymbol{\nabla} \boldsymbol{\cdot} \boldsymbol{u})$
; these two quantities have similar magnitudes and are shown with a shared colour scale. The average absolute values over the entire domain are indicated in red text within each panel. Quantitatively,
 $\mu (\boldsymbol{\nabla} \boldsymbol{\cdot} \boldsymbol{u})$
is roughly four orders of magnitude smaller than the dominant stress terms, posing a significant challenge for data-driven discovery.

In this case, the problem can be simplified by subtracting the pressure to isolate the trace-free parts
 $\sigma_{\textit{ij}} = p_{\textit{ij}} - p \delta_{\textit{ij}}$
. However, to rigorously evaluate whether SITE can discover small-magnitude terms amid much larger dominant contributions, we deliberately choose to identify the complete constitutive relation of
 $p_{\textit{ij}}$
. The results in § 4.2 have shown that SITE is capable of reliably identifying the compressible term under such challenging conditions. This highlights the framework’s robustness to large disparities in variable magnitudes.
This robustness arises from SITE’s design principles that explicitly address magnitude disparities without distorting physical significance. Compared with sparse regression-based methods which relies on standardized feature spaces and regularization to suppress terms with small numerical contributions, SITE operates directly in the native physical scale and preserves candidate terms through evolutionary mechanisms. Subexpressions such as
 $\mu D_{\textit{ii}}$
are retained and re-evaluated across generations, even if their immediate numerical contribution is minimal.
In addition to the overall magnitude disparity between different terms, another challenge specific to tensor equation identification lies in the magnitude disparity of different components within a single tensor. Unlike scalar regression tasks where each feature corresponds to a single physical quantity, tensor modelling requires treating entire tensor structures as regression targets. However, the magnitudes of different components within a tensor (e.g. the diagonal and off-diagonal terms in
 $p_{\textit{ij}}$
) can vary significantly. This disparity can bias the learning process if not properly addressed. In SITE, this issue is mitigated by the design of optimization objective. The loss function (2.6) incorporates a normalization scheme that rescales each component individually. This ensures that each tensor component contributes equally to the total loss, regardless of its absolute magnitude, thereby improving the robustness of coefficient identification.
5. Conclusion
This study introduces SITE, a symbolic regression framework tailored to discover governing equations involving second-order tensors. The SITE addresses key limitations of conventional evolutionary approaches by enabling the identification of physically interpretable tensor equations with enhanced numerical efficiency.
To implement symbolic regression for tensors, SITE leverages a host–plasmid structure and incorporates a genetic information retention strategy to enhance evolutionary robustness. A DHC is enforced to ensure physical validity, while a seed injection strategy is adopted to overcome dimensional stagnation under strict constraints. In addition, a TLR technique replaces traditional random mutation–based coefficient optimization, enabling high efficiency and stability.
We validate SITE using two benchmark problems – including the Maxwell stress tensor and the Reynolds-stress transport equation – demonstrates its ability to recover ground truth equations from noisy data. Beyond synthetic tests, SITE is applied to DSMC-generated molecular data for lid-driven cavity flows, successfully identifying constitutive relations under both compressible and incompressible conditions. Notably, SITE also proves robustness in identifying small-magnitude terms, highlighting its sensitivity to meaningful physical features.
Despite these encouraging results, SITE still has some limitations that warrant further investigation. First, SITE cannot automatically introduce unknown dimensional physical parameters if they are not provided in the candidate terminal set. In cases studied here, parameters such as permittivity or viscosity are explicitly included, allowing SITE to recover the correct expression structures. However, for problems where the relevant dimensional parameters are unknown a priori, the framework cannot independently infer or create such quantities, which may restrict its applicability. Second, the current SITE framework is restricted to discovering governing equations composed of algebraic and differential tensor functions that are explicitly included in the candidate library. It does not yet support non-local operations involving integration operators, convolution or historically correlated kernels, which are indispensable in certain materials and fluid systems. Finally, the generation of genes follows a random process without directional guidance, which can limit the efficiency of discovering meaningful structures, particularly as the candidate libraries become larger.
In summary, SITE provides a general, flexible and interpretable framework for tensor equation discovery in high-dimensional physical systems. While this work focuses on second-order tensors, future extensions may explore the incorporation of higher-order tensors and more generalized symbolic operators, such as the non-local operators mentioned above. Furthermore, reinforcement learning and large language models could be incorporated into SITE to provide valuable guidance in the generation and evolution of population. Such advancements could significantly broaden the framework’s applicability both in science and engineering.
Acknowledgements
The authors gratefully acknowledge Professor R.D. Sandberg and his team at the University of Melbourne for their kind assistance with running M-GEP tests, which provided valuable reference for the development of this work. The authors thank P. Luan and Q. Ma for their help with data generation using OpenFOAM.
Funding
This work was supported by the National Natural Science Foundation of China (grant nos. 12272028 and 92371102).
Declaration of interests
The authors report no conflict of interest.
Author contributions
T.C., W.M. and J.Z. contributed to the ideation and design of the research; T.C. and H.Y. generated the datasets; T.C. performed the research; T.C., H.Y. and J.Z. wrote the paper.
Data availability statement
The datasets and source codes used in this work are available on GitHub at https://github.com/PistilReaper/SITE.
Appendix A. Genetic operators
Within the evolutionary process of SITE, both the host population and the plasmid population are subjected to genetic operator applications. More specifically, the genetic operations on the host and plasmid populations are decoupled. First, the host population undergoes modifications and crossovers. After completing these operations on the host population, the plasmid population then undergoes modifications. Modification (Algorithm 1) is divided into mutation and transposition, where transposition is further subdivided into gene fragment inversion, insertion sequence transposition, root insertion sequence transposition and whole gene transposition. Crossover (Algorithm 2) is divided into single-point crossover, double-point crossover and whole gene crossover. These genetic operators are applied to the offspring with certain probabilities.
Modification

Crossover

In this work, the probabilities of applying each genetic operator refer to Ferreira (Reference Ferreira2001), listed in table 7. It is important to note that, unlike other operators, the mutation operator’s probability listed in the table is not its probability of being applied to an entire individual. In GEP, the mutation operator is applied to every offspring (i.e. the per-individual application probability is 1). Then, the operator traverses all gene elements in a chromosome, and each gene element is changed with the probability specified in the table (effectively, this is the calling probability for each gene element). As a result, even after the mutation operator is applied, an individual may remain unchanged if none of its gene elements are mutated. Additionally, genetic operators that operate directly on genes only become effective when the number of genes is greater than one.
Probabilities for genetic operators being invoked.

In practical tests, SITE is not sensitive to the application probability of the genetic operators. Therefore, when choosing these probabilities, you can adjust them upward or downward according to whether you want to enhance exploration or achieve faster convergence.
Appendix B. Hyperparameters
There are several key hyperparameters that govern SITE’s evolutionary process. Table 8 summarizes the values used in this study, which were selected based on prior benchmarking.
Values of hyperparameters used in SITE. Case 1, Case 2 and Case 3 represent three different cases in this study (Case 1, Maxwell stress tensor; Case 2, Reynolds stress transport equation; Case 3, molecular simulation-based constitutive relation identification).

The maximum number of generations together with the loss threshold determines when the evolutionary process terminates. These two parameters provide complementary stopping criteria: one sets a hard upper bound on search effort, while the other defines a tolerance for convergence.
The number of host genes specifies the maximum number of independent tensor terms that can appear in the final governing equation, while the number of plasmid genes controls the complexity of embedded scalar expressions. The head lengths of host and plasmid genes regulate the richness of symbolic structures that can be generated, with larger head lengths allowing for more diverse combinations of candidate elements.
The remaining parameters are at the population evolution level. These settings generally do not have a significant impact on SITE’s optimization process. Compared with classical GEP settings, we have moderately increased the tournament size, which can enhance the convergence efficiency.
Among all hyperparameters, the first three parameters are case-dependent. For the benchmark problems (Case 1 and Case 2), these values are adjusted according to the complexity of the task, with more generations and host genes allocated to the Reynolds-stress transport equation than to the Maxwell stress tensor. For the cavity-flow case based on molecular simulation (Case 3), a relatively small number of host genes and generations are sufficient because the flow conditions are not highly complex. However, since this case involves statistical noise and does not have a known ground truth, we avoided imposing a loose loss threshold. Instead, we chose a very small threshold (
 $10^{-6}$
) and allowed the algorithm to evolve up to the maximum generation limit, in order to objectively observe the best equation that SITE can discover.
Appendix C. Construction of the terminal library for constitutive relation identification
In constructing the candidate terminal library for the compressible cavity flow case, our objective was to avoid imposing any strong prior modelling assumptions regarding the form of the constitutive relation. Instead, we aimed to provide a physically comprehensive yet minimally biased set of inputs that could enable the discovery of the constitutive relation purely from data.
We initially included both the symmetric strain-rate tensor
 $S_{\textit{ij}}$
and the antisymmetric rotation-rate tensor
 $\varOmega _{\textit{ij}}$
in the terminal library for tensors. However, preliminary experiments showed that
 $\varOmega _{\textit{ij}}$
was consistently absent in the expressions discovered by SITE. This result aligns with physical analysis:
 $\varOmega _{\textit{ij}}$
represents local rigid-body rotation, which does not contribute to momentum transport in isotropic fluids. As a result, the final terminal library for tensor is set to
 $\{ {S_{\textit{ij}}},{\delta _{\textit{ij}}}\}$
.
For the scalar terminal library, we selected
 $\{ {D_{\textit{ii}}},p,\mu \}$
. Here,
 ${D_{\textit{ii}}} = \boldsymbol{\nabla }\boldsymbol{\cdot }u$
is the divergence of the velocity field and serves as a fundamental scalar invariant of the velocity gradient tensor
 $D_{\textit{ij}}$
. The static pressure
 $p$
and dynamic viscosity
 $\mu$
are intrinsic thermodynamic and transport properties of the flow, respectively. These scalar quantities enable SITE to capture both shear and compressible effects without presuming linear or Newtonian behaviour.
Appendix D. Candidate equations for constitutive relation identification and construction of the reported form
In § 4, the true governing constitutive equation is unknown. Therefore, the evaluation of symbolic regression results cannot rely on an exact comparison with a known target equation. To address this, we conducted five independent discovery runs under each of the two flow conditions (lid velocities of
 $50$
and
 $337 \text{ m s}^{-1}$
). In each run, 200 randomly selected data points (see figure 6) were used as training data, and all 57 600 points in the same region were employed as the test data. This allows for an objective error-based evaluation, even in the absence of ground truth equations. The test loss is calculated by (2.6).
Table 9 and table 10 present the explicit candidate equations obtained from the five independent runs under the
 $50$
and
 $337\,{\rm m\,s}^{-1}$
conditions, respectively, along with their predictive test errors. Although the identified equations are not exactly the same, clear structural similarities are observed. Several terms appear consistently across different runs, indicating that they are statistically robust features of the underlying relationship. By contrast, other terms appear sporadically and contribute marginally to accuracy.
Candidate equations obtained from five independent runs under the
 $50 \text{ m s}^{-1}$
cavity flow condition, together with their predictive errors on the test dataset. The indices
 $i$
,
 $j$
,
 $k$
and
 $m$
denote tensor indices.

Candidate equations obtained from five independent runs under the
 $337 \text{ m s}^{-1}$
cavity flow condition, together with their predictive errors on the test dataset. The indices
 $i$
,
 $j$
,
 $k$
and
 $m$
denote tensor indices.

Specifically, for the nearly incompressible flow condition, all candidate equations consistently contain the shear stress term and the static pressure term. However, the inclusion of the compressible term is unstable, and its coefficients fluctuate significantly across different runs. This behaviour is expected since the velocity divergence is close to, but not exactly, zero in this regime. The appearance of the compressible term is generally attributable to its coupling with other dominant terms within the same symbolic structure, rather than representing a truly independent physical contribution. For the compressible flow condition, all candidate equations robustly include the shear stress term, the compressible term and the static pressure term.
In addition, certain candidate equations contain higher-order terms. These higher-order contributions typically have small coefficients and reduce the test error only marginally. From a theoretical perspective, such terms can be interpreted as artefacts of local non-equilibrium effects. In particular, for high-speed compressible flows, the inclusion of higher-order corrections may capture weak deviations from continuum-level constitutive assumptions, thereby slightly improving predictive accuracy. Nonetheless, their limited impact on the loss function suggests that these effects remain secondary compared with the dominant physical terms.