INTRODUCTION
Oceanic sea turtles are threatened by a number of sources of mortality, with pelagic longline fisheries being recognized as a major global threat (for review, see Lewinson et al., Reference Lewinson, Freeman and Crowder2004; Long & Schroeder, Reference Long and Schroeder2004). Lewinson et al. (Reference Lewinson, Freeman and Crowder2004) estimated that in 2000, the worldwide pelagic longline fisheries caught as many as 200,000 loggerheads (Caretta caretta (Linnaeus, 1758)) and 50,000 leatherback turtles (Dermochelys coriacea (Vandelli, 1761)), with the majority of captures occurring in the Atlantic and Mediterranean.
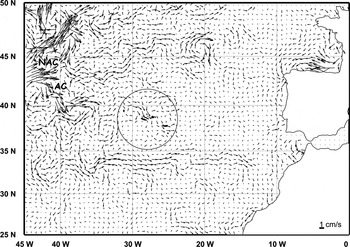
The ocean area around the Azores is an important foraging habitat for oceanic juvenile loggerheads with source rookeries located primarily in the south-eastern USA (Bolten et al., Reference Bolten, Bjorndal, Martins, Dellinger, Biscoito, Encalada and Bowen1998). Although the mean size of turtles in this area is 34.5 cm curved carapace length (CCL) (Bolten et al., Reference Bolten, Martins, Bjorndal and Gordon1993), the mean size of loggerheads caught or entangled in the longline fisheries that target swordfish (Xiphias gladius) is 49.8 cm CCL (Ferreira et al., Reference Ferreira, Martins, Bolten and Silva2001; Martins et al., Reference Martins, Bolten, Ferreira, Ciccione, Ross and Gall2001; Bolten, Reference Bolten, Bolten and Witherington2003). This size-class is the size at which oceanic-juveniles leave the oceanic and begin to recruit to the neritic (Bjorndal et al., Reference Bjorndal, Bolten and Martins2000), and thus they are very important for the survival of the North Atlantic loggerhead population (Crouse et al., Reference Crouse, Crowder and Caswell1987). In the past decade, there has been a decline of approximately 40% in nesting loggerheads in Florida (Witherington et al., Reference Witherington, Kubilis and Brost2009), coinciding with the increase in swordfish longline fishing effort in the North Atlantic since 1978, which reached an historic peak in 1987 (ICCAT, 1997). Given the impact of longline by-catch on large juvenile turtles in key foraging and developing areas, such as those around the Azores, a continued decline in the nesting population in the south-east USA would be expected (Ferreira, Reference Ferreira2005). These concerns prompted a workshop (funded by the National Marine Fisheries Service, USA) held in Horta, Azores, Portugal, in September 1998. The focus was to review the impact of the swordfish longline fishery on sea turtles and to design an experiment to evaluate gear modification on longline by-catch rates of sea turtles (Bolten et al., Reference Bolten, Martins and Bjorndal2000). The experiment was initiated in 2000 and terminated in 2004. The results from Phase 1 and Phase 2 are documented in a NOAA Technical Memorandum (Bolten et al., Reference Bolten, Martins, Isidro, Santos, Ferreira, Bettencourt, Giga, Cruz, Bjorndal, Long and Schroeder2004). The oceanography of the Azorean region is influenced by the North Atlantic Current (NAC) to the north of the islands and by the Azores Current (AC) to the south (Figure 1).
Oceanic currents around Azores: NAC, North Atlantic Current; AC, Azores Current. Mean values of geostrophic currents from 1998–2007 according to Ssalto/Duacs and distributed by AVISO (http://www.aviso.oceanobs.com/duacs/).

Locally, the dynamics of the current system is greatly influenced by the islands and seamounts (Mailly et al., Reference Mailly, Blayo and Verron1997), which creates a complex and dynamic system which changes seasonally (for a complete description see Santos et al., Reference Santos, Hawkins, Monteiro, Alves and Isidro1995). These patterns yield dynamic eddies and convergent zones which are prime habitat of oceanic stage loggerhead sea turtles (Bolten, Reference Bolten, Bolten and Witherington2003). The association of juvenile loggerheads with these oceanographic structures was first hypothesized by Carr (Reference Carr1986). More recently Polovina et al. (Reference Polovina, Kobayashi, Parker, Seki and Balazs2000, Reference Polovina, Balazs, Howell, Parker, Seki and Dutton2004) have provided evidence that describes the habitat of loggerheads in the central North Pacific as being strongly linked to fronts, eddies, and geostrophic currents. These physical features are highly productive and thus represent important habitat for commercial pelagic species (Bakun, Reference Bakun1996 in Polovina et al., Reference Polovina, Howell, Kobayashi and Seki2001), which is what causes the overlap between loggerheads and fishing vessels and makes the turtles vulnerable to by-catch in longline fisheries.
Although the target species of the longline fishery in the Azores is swordfish, the larger class of vessels, i.e. >25 m with freezer capacity (for the fleet description see Simões, Reference Simões1995), alternate the target species between swordfish and blue shark (Prionace glauca) according to their spatial and temporal availability (Ferreira, Reference Ferreira1999). Aires-da-Silva et al. (Reference Aires-da-Silva, Ferreira, Pereira, Pikitch and Camhi2008), reviewing a large sample of fishing logbooks and verified by observer data, identified two asynchronous and seasonal capture peaks between the two species (captures increase from May to October for swordfish and from October to May for blue shark) and consider the swordfish season to be from May to December.
Previous work identified higher sea turtle catch rates in the swordfish season (see Bolten et al., Reference Bolten, Martins and Bjorndal2000) and in fishing sets targeting blue sharks, which also take place during the swordfish season but over deeper waters and with longer daylight hauling times (Ferreira et al., Reference Ferreira, Santos, Martins, Bolten, Isidro, Giga and Bjorndal2003). To investigate the possible reasons for these differences in catch rates, we considered a number of environmental and fishery parameters, since it has been shown that variations in the environment and in the gear selectivity affect the species availability and vulnerability for capture (Bigelow et al., Reference Bigelow, Boggs and He1999).
MATERIALS AND METHODS
The data used in this study were obtained as part of a longline gear modification experiment (Phase 1) conducted in the Azores between 15 July and 15 December 2000, which is the time of year when the catch rates of turtles and swordfish are reported to be highest (Bolten et al., Reference Bolten, Martins and Bjorndal2000). The experiment was part of a larger project that evaluated the effect of gear modification on rates of sea turtle by-catch, in the swordfish longline fishery in the Azores during 2000–2004.
The experiment was conducted on a 25.4 m commercial swordfish longline vessel (FV ‘Mestre Bobicha’). The gear used was the Spanish type, which consisted of a multifilament mainline on which 11 m branchlines are attached successively with hooks at a fixed distance of 45 m (Figure 2). Between the hook and the branchline, a 30 cm steel leader was used to retain the shark captures. At eight hook intervals, a buoy with branchlines between 5.5 and 11 m, depending on sea conditions, is attached for the suspension of the gear at the surface (Figure 2). Three types of buoys are used: large radar buoys (RB); large buoys (B); and small buoys (b). RBs are used to locate the gear in the water and, together with B, provide stability to the rest of the gear. Approximately 20 RB, 19 B and 152 b are deployed in each set with the following configuration: RB, b, b, b, b, B, b, b, b, b, RB…, corresponding to a total of 19 sections with 160 hooks each.
Representation of part of the longline gear used during the present study. Characters represent hook type (see text). In the lower left corner of the figure a segment of the gear is shown between radar buoys that comprise 160 hooks.

Three types of hooks were used: Straight J (Mustad 9/0), Offset J (Mustad 9/0) and Circle (Mustad 16/0), individually alternated along the gear (that is: a, b, c, a, b, c, a, b…), varying the relationship between the hook type and hook position on the gear (Figure 2). There were approximately 1500 hooks per set (fewer on some bad weather days). The bait was squid for all sets and the gear measured approximately 35 nautical miles (64 km).
The study area was inside the exclusive economic zone (EEZ) of the Azores archipelago, and the location of each set was dependent on the Captain's experience and intuition for finding fish. The gear was deployed beginning 1 to 2 hours before sundown and ending approximately 4 hours later. Fishing effort (soaking) continued during the rest of the night. Just before sunrise, gear retrieval began and typically ended by middle afternoon, depending mainly on the weather condition and the number of sharks captured (sharks normally are alive and take longer to haul aboard).
For each RB, geographical location and the Greenwich Mean Time of deployment and retrieval were recorded. Depth in fathoms was also obtained for each RB, but only for deployment since the boat sonar was off during retrieve. At the beginning of the gear retrieval, wind force and sea state (using the Beaufort scale (Marques, Reference Marques2001)), and SST (using a digital thermometer) were recorded. The method of obtaining SST proved to be biased and we decided to use the weekly 9 km resolution data from the ‘AVHRR Oceans Pathfinder’ project, developed by NASA and NOAA and available for download (http://podaac-esip.jpl.nasa.gov, accessed March 2004). Monthly SST images were also downloaded for the same period but not used for the statistical analyses. Also available were the data of the illuminated fraction of the moon (http://aa.usno.navy.mil, accessed May 2004); this corresponded to the beginning of each capture day (00:00 h).
Data were collected for all turtles caught (e.g. species and CCL) during the gear modification experiment and for all the fish species (e.g. species and body size). In the present study we only consider the number of loggerhead sea turtles and target species recorded for each set; additional results can be found in Bolten et al. (Reference Bolten, Martins, Isidro, Santos, Ferreira, Bettencourt, Giga, Cruz, Bjorndal, Long and Schroeder2004). Turtles and undersized fish were tagged with standard flipper tags before release.
For each fishing set or day of capture we calculated the catch rates of loggerhead turtles, blue sharks and swordfish, in number of individuals captured for 1000 hooks deployed (CPUE), and determined the set location, which was calculated as the mean of the RB deployment and retrieval locations. To investigate the cause for the variation in turtle by-catch, we identified environmental and fishery parameters that might affect the species availability and vulnerability for capture. The parameters we evaluated were: mean depth (m), calculated as the mean of the bottom depths recorded for the RBs deployed; minimum depth (m), which corresponds to the minimum recorded bottom depth for the entire set; SST (°C), obtained by matching each set location with the respective SST value of the pixel from the weekly satellite images; wind force (0–12), corresponding to the Beaufort scale; soak area (nm2), calculated from the displacement of the radar buoys between deploy and retrieve locations; soak time (0–1), to facilitate the analyses the time was converted to centesimal, where 0 hour = 0 and 24 hours = 1, and the value obtained for the set corresponds to the mean calculated from the time each section of the gear (between RBs) remained soaking, and moon phase (0–1), corresponds to the illuminated fraction of the moon, for the beginning of the capture day, and varied between 0 (new moon) and 1 (full moon).
To find which of the seven parameters better predict or explain the variations in the observed loggerhead CPUE, we fit a generalized linear model (GLM) using StatSoft (1999). This analysis was also applied to the target species CPUEs, blue shark and swordfish, in order to better understand the association between turtles and target species. Since the CPUE histograms for the three species were not normally distributed due to the presence of zero values, it was assumed that the probability function associated with all the catch rates was a Poisson distribution and the logarithmic link function was used. We added 0.1 individuals per 1000 hooks to the CPUE values, because zero values pose a problem to the link function with Poisson distribution, and the addition of a constant continues to keep the zero values isolated from the smallest values, without affecting the non-zero part of the CPUE distributions (Bigelow et al., Reference Bigelow, Boggs and He1999).
We used an alpha of 0.01 to select the parameters that better predict or explain the variations in the CPUEs. We considered that it is more important to avoid the error of believing that a relationship exists, when there is none (Type I Error), than the error of accepting that there is no relationship, when in fact one exists (Type II Error) and we need more data to detect it (Zar, Reference Zar1996).
RESULTS
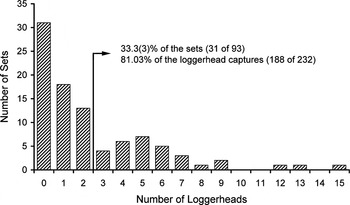
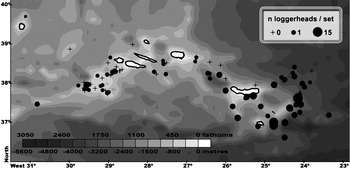
Two hundred and thirty-two loggerhead turtles were captured on 93 longline sets, varying between 0 and 15 turtles caught per set. The number of turtles caught per set showed great variability independent of the geographical location; one-third of the sets caught 81% of the loggerheads, while another third of the sets did not catch any (Figure 3). The results also show a clear east to west gradient in the number of turtles caught during the study period with the area around the eastern group of islands characterized by higher turtle capture rates (Figure 4). During the same period a total of 2008 blue sharks and 953 swordfish were captured.
Frequency distribution of the number of sets by the number of turtles caught.

Longline set locations, loggerhead capture and bathymetry. Dots indicate sets with loggerhead capture where dot diameter represents the number of turtles captured (1 to 15 turtles/set). Crosses indicate sets without loggerhead capture.

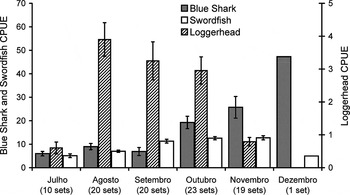
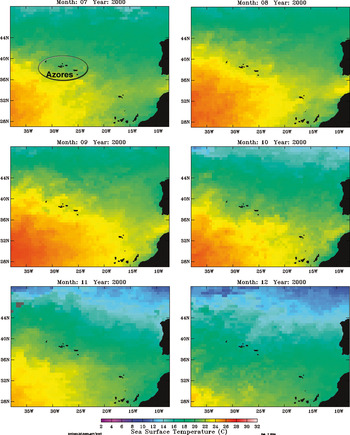
In relation to catch rates the higher loggerhead CPUEs were recorded in August, September and October (Figure 5), and correspond to the period influenced by the thermohaline front with higher SSTs. The dynamics of the water temperature variation in the Azores area can be observed in Figure 6 where monthly SSTs are presented. In contrast to the trend in the loggerhead CPUE, the proportion of sharks in the catch appears to increase when the front starts to leave the Azores in October, and, consequently, the water temperature cools down (Figure 5). Swordfish CPUE increased from July to September and remained stable in October and November. Only one set was performed in December.
Mean CPUEs (n ind/1000 hooks) by month for loggerhead, blue shark and swordfish. Numbers of sets are presented inside the parentheses and the bars represent the standard error.

Changes in sea surface temperature in the study area from July to December 2000 (http://podaac-esip.jpl.nasa.gov).

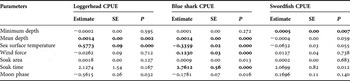
Of the 7 parameters analysed with the GLM (mean depth; minimum depth; SST; wind force; soak area; soak time; moon phase) those that best explain the variations in the loggerhead CPUE, with an alpha of 0.01, are the SST and mean depth (Table 1). For the blue shark CPUE, the significant variables are SST, mean depth, wind force and soak time, while for the swordfish CPUE only the minimum depth was found to be significant (Table 1). All the significant relations, except blue shark CPUE with SST, were positive.
Parameter estimates (estimate), P values (P) and standard error (SE) obtained for the 7 parameters investigated by the global linear model analyses in relation to loggerhead, blue shark and swordfish CPUE (n ind/1000 hooks). The significant parameters (α = 0.01) are in bold.

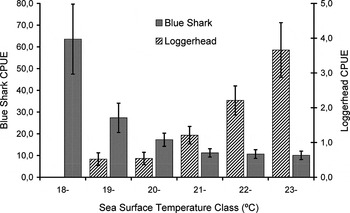
As the temperature (SST) increases, there are an increase in loggerhead CPUE and a decrease in blue shark CPUE (Figure 7). This difference followed the temperature regimes associated with the thermohaline front (see the monthly SST images presented in Figure 6).
Loggerhead and blue shark CPUE (n ind/1000 hooks) by sea surface temperature. Bars represent the standard error.

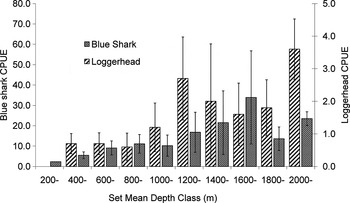
Loggerheads and blue shark CPUEs were both positively related to mean depth (Figure 8). We found an initial increase in the loggerhead capture rates at 1200 m (2.7 ind/1000 hooks) with a peak at 2000 m (3.6 ind/1000 hooks).
Loggerhead and blue shark CPUE (n ind/1000 hooks) by mean depth. Bars represent the standard error.

DISCUSSION
Turtle by-catch events were not uniformly distributed across all sets rather they were clustered within the fishing area (Figures 3 & 4), as previously pointed out by Bolten et al. (Reference Bolten, Martins, Isidro, Santos, Ferreira, Bettencourt, Giga, Cruz, Bjorndal, Long and Schroeder2004). This suggests that the distribution of loggerhead turtles is being affected by some factors and that they must be identified in order to understand loggerhead sea turtle by-catch. The high loggerhead capture rate observed in the eastern group of the Azores islands is likely associated with mesoscale eddies found in that area (37.5°N 23°W), which are reported as normally present and induced by bathymetric features (Mailly et al., Reference Mailly, Blayo and Verron1997). In the Pacific, Polovina et al. (Reference Polovina, Balazs, Howell, Parker, Seki and Dutton2004) reported loggerhead association with local oceanographic anomalies (fronts, eddies and geostrophic currents) and Santos et al. (Reference Santos, Bolten, Martins, Gonçalves and Ferreira2007a, Reference Santos, Bolten, Martins, Riewald, Bjorndal, Pitcher, Morato, Hart, Clark, Haggan and Santos2007b), also working in Azorean waters, found a strong correlation between the loggerhead captures and the sea-bottom slope, which might generate eddies providing prime habitats for sea turtles.
In relation to the loggerhead capture variation by month, previous research found that during the swordfish season (May to December) the turtle capture is higher between July and November, with noticeable peaks in the beginning and end of the summer (Ferreira, Reference Ferreira1999; Serpa, Reference Serpa, Bolten, Martins and Bjorndal2000; Ferreira et al., Reference Ferreira, Martins, Bolten and Silva2001). These two peaks may indicate the passage of the thermohaline front by the Azores archipelago. This was observed during the year of this study (see Figure 6); the front reached the Azores in August, stayed in the area in September and left in October. The relation between the thermohaline front and our loggerhead capture data is clear, the only period of high loggerhead CPUE corresponded to August–October, the months directly influenced by the front (Figure 5). These observations indicate the correlation of the arrival and departure of the turtles with the front, behaviour in accordance to what has been described for this species (Polovina et al., Reference Polovina, Kobayashi, Parker, Seki and Balazs2000, Reference Polovina, Balazs, Howell, Parker, Seki and Dutton2004), but does not exclude other factors that are affecting the loggerhead CPUE at a local scale.
The capture of loggerhead turtles in the months outside of the swordfish season (January to April), in the small study region, are minimal due to the turtles being distributed probably to the south. In other areas, by-catch may be year round. For example, the Equatorial Atlantic region is a hotspot for longline fishing—swordfish, sharks and tuna—where commercial fishing takes place all year and the interactions with sea turtles are very high across all months (Carranza et al., Reference Carranza, Domingo and Estrades2006; longline skipper J. Simões, personal communication).
From the GLM results (Table 1), we see that SST and mean depth are factors that may affect loggerhead distribution and their potential for longline capture. Loggerhead catch rates were higher with higher SST (Figure 7) which, as discussed above, occurred from August to October and corresponded to the presence of the thermohaline front in the area (Figure 6). As reported by others for the central North Pacific Ocean area (Polovina et al., Reference Polovina, Kobayashi, Parker, Seki and Balazs2000, Reference Polovina, Balazs, Howell, Parker, Seki and Dutton2004), we agree that this oceanographic structure plays an important role in the distribution of loggerhead turtles in the Azores region. Fishing in these spatial and temporal zones will increase the availability of turtles to capture. This relation was opposite for sharks; higher capture rates were associated with lower SST. In this case, the vertical distribution pattern of blue sharks in the water column makes surface temperatures less important as a physiological limit but important for functions such as reproduction or prey distribution (Carey & Scharold, Reference Carey and Scharold1990). Thus mean depth becomes much more relevant in explaining the variations in blue shark CPUE.
The variation in the regional and seasonal availability of loggerhead sea turtles becomes more complex when it is observed at a local or sub-regional scale. Here the bathymetry appears to be the most important factor for the distribution of loggerheads and blue sharks within the study area. In our data, increases in loggerhead and blue shark captures were related to increases in set mean depth (Figure 8). In this case, the relation of the loggerhead CPUE with depth can be explained by the oceanic habitat that these juveniles occupy, where the presence of oceanographic structures provide the optimal conditions needed for development.
Considering loggerhead captures by depth-classes (Figure 8), there was a clear pattern where catch rates increased in the 1000 m class and then peaked at the 2000 m class. This observation cannot be easily explained since the 35 nautical miles (64 km) long fishing gear was deployed over different depths within the study area, which presents a highly irregular bathymetric structure packed with seamounts and islands, as seen in Figure 4. A clearer interpretation of these data would require information on additional oceanographic variables, e.g. chlorophyll, altimetry and sea-bottom slope (Santos et al., Reference Santos, Bolten, Martins, Gonçalves and Ferreira2007a, Reference Santos, Bolten, Martins, Riewald, Bjorndal, Pitcher, Morato, Hart, Clark, Haggan and Santos2007b).
The high catch of loggerheads in deep water (2000 m class; Figure 8), was also observed by (Santos et al., 2007b) where they report a peak in capture in the 2500–3000 m depth-class. However, Santos et al. (2007b) also reported a decrease in turtle catches starting at 3500 m with a marked decrease from 4000 m and deeper. These results may be explained by the fact that deeper depths (~4000 m) do not generate eddies or shallow oceanographic features suitable for the aggregation of loggerhead sea turtles.
In a logbook study from the Hawaii-based swordfish longline fishery, Bigelow et al. (Reference Bigelow, Boggs and He1999) found that the bathymetric effect on blue shark CPUE was less pronounced (in relation to the other analysed variables) but showed some increase at bottom depths shallower than 3000 m. In relation to swordfish, Bigelow et al. (Reference Bigelow, Boggs and He1999) found that the capture increased in the vicinity of seamounts, banks, or islands (<2000 m), was lowest over a bottom depth-range of 2000–3000 m, and then increased in deeper water. These observations, together with the results of the present study and of Santos et al. (2007b), indicate that the loggerhead distribution around Azorean waters overlap better with the blue shark distribution than with the swordfish.
The relationship revealed by the GLM analyses between swordfish CPUE and the minimum depth (Table 1) was expected since in the Azores region shallow sets (<750 m) and/or those sets near banks are targeting mainly swordfish, while sets deployed over deeper bottom depths (>750 m) are targeting blue shark (longline skippers J. Simões and M. Codinha personal communications). The positive association found between blue shark captures and the wind force and soak time was also expected. Fishing gear movements induced by wind and waves increases the attraction of blue sharks (longline skipper M. Codinha personal communication), and since this species is an opportunistic day feeder it is normal that the catches increase with soak time.
The parameter moon phase approaches significance and may be important for explaining the variation of both loggerhead (P = 0.032) and blue shark (P = 0.016) CPUEs. There is increased loggerhead and blue shark CPUE during darker nights.
CONCLUSIONS
Juvenile loggerhead sea turtles present an aggregated distribution around specific oceanographic features in Azorean waters. Our results suggest that the relative abundance and distribution of turtles in those areas can be predicted by identifying habitat features, such as thermal fronts and eddies, related to major currents and bathymetric characteristics. These aggregation areas lead to a higher or smaller loggerhead vulnerability to fishing interactions depending on the type of fishery and target species (e.g. blue shark or swordfish). This knowledge can be used to more efficiently prevent by-catch of turtles.
The impact of longline fishing on sea turtles in the Azores could be diminished quickly through the regulation of the blue shark fishery, which already shows signs of over-exploitation (Ferreira, Reference Ferreira1999; Aires-da-Silva et al., Reference Aires-da-Silva, Ferreira, Pereira, Pikitch and Camhi2008), and by increasing awareness of sea turtle conservation, including the importance of careful de-hooking and post-hooking release techniques. By stopping the boat and gently pulling the turtle close, replacing the gaff with a dip net, as done with commercially valuable species, the physical trauma to the turtle and associated mortality would be greatly reduced. For this fishery in the Azores, boats targeting swordfish pose less risk for turtles because the locations where sets were deployed showed less loggerhead by-catch. These sets also finish earlier in the day, which decreases considerably the probability of loggerhead capture (Ferreira et al., Reference Ferreira, Santos, Martins, Bolten, Isidro, Giga and Bjorndal2003; Bolten et al., Reference Bolten, Martins, Isidro, Santos, Ferreira, Bettencourt, Giga, Cruz, Bjorndal, Long and Schroeder2004; Báez et al., Reference Báez, Raimundo Real and Caminas2007). Due to the worldwide decrease in swordfish catches and sizes, we have observed that vessels fishing in the Azores are increasing the use of light-sticks and the number of hooks deployed (to cover large areas), and are shifting target species from swordfish to sharks (even in the swordfish season). In addition, fishing effort is also changing to other ocean areas where shark catch rates are still high but where the interaction with sea turtles also exists (longline skipper J. Simões, personal communication).
A by-catch mitigation policy that: (a) requires vessels to move away from fishing areas after high catch rates of turtles (e.g. sets with 3 or more turtles captures, or 2 or more turtles per 1000 hooks); (b) identifies the key areas and periods of sea turtle aggregation and prohibits longline fishing there (e.g. between July and November inside the Azorean EEZ); or (c) uses dynamic oceanographic monitoring to guide fleet location, would greatly reduce the likelihood of encounter with loggerheads. Because gear modification can also reduce by-catch (Bolten et al., Reference Bolten, Martins, Isidro, Santos, Ferreira, Bettencourt, Giga, Cruz, Bjorndal, Long and Schroeder2004; Watson et al., Reference Watson, Foster, Epperly and Shah2004) the implementation of obligatory gear alterations must be done with caution. For instance, in the Azores circle hooks might increase the fishing effort towards the unregulated blue shark fishery, because fishermen believe that circle hooks are more effective for sharks than for swordfish, which would likely lead to an increase in loggerhead fishing interactions during the months of high turtle abundance.
Special attention should be given to research on catch rates targeting swordfish at greater depths during daylight hours versus the common practice of fishing the upper portion of the water column by night (Beverly & Robinson, Reference Beverly and Robinson2004). Such a strategy may prove to avoid the depth-ranges used by loggerheads while still allowing for the capture of swordfish. Some Spanish longliners in the Mediterranean have applied such an approach (longline skipper Salvador, personal communication), at least during part of the season, and support should be given to such initiatives taken by professionals.
Therefore, it is important that research continues, but only a multidisciplinary and collaborative approach to these complex problems will yield satisfactory results in reducing endangered species fishing mortalities.
ACKNOWLEDGEMENTS
We are grateful to the skipper and crew of the FV ‘Mestre Bobicha’, to the staff of the Department of Oceanography and Fisheries (University of the Azores), to the anonymous referees of the manuscript and to the IEO—Málaga for the opportunity to recently work with the Mediterranean longline fishery. We are indebted to Sandra Sequeira for furnishing the map of the currents. Onboard data collection was funded by the US National Marine Fisheries Service contract to the Archie Carr Center for Sea Turtle Research at the University of Florida (NA96FE0393) and authorized by the Fisheries Board of Azores Regional Government. Satellite and moon phase data were provided, respectively, by NASA/NOAA and USNO. Data analysis was possible by a grant from the Portuguese Foundation for Science and Technology (SSRH/BM/13267/2003).