Introduction
Fragmentation of the Pangea supercontinent with the opening of the Atlantic was accompanied by extensive magmatic activity. This resulted in the formation of a large igneous province at the equator, known as the Central Atlantic Magmatic Province, represented by dykes and sills but also by layered complexes. Among the layered complexes related to this event, the Freetown Complex of Sierra Leone has been intensively studied, especially because it was known to be the source of eluvial and alluvial platinum-group mineral deposits that have been extracted for more than 80 years (Bowles, Reference Bowles1981, Reference Bowles2000a).
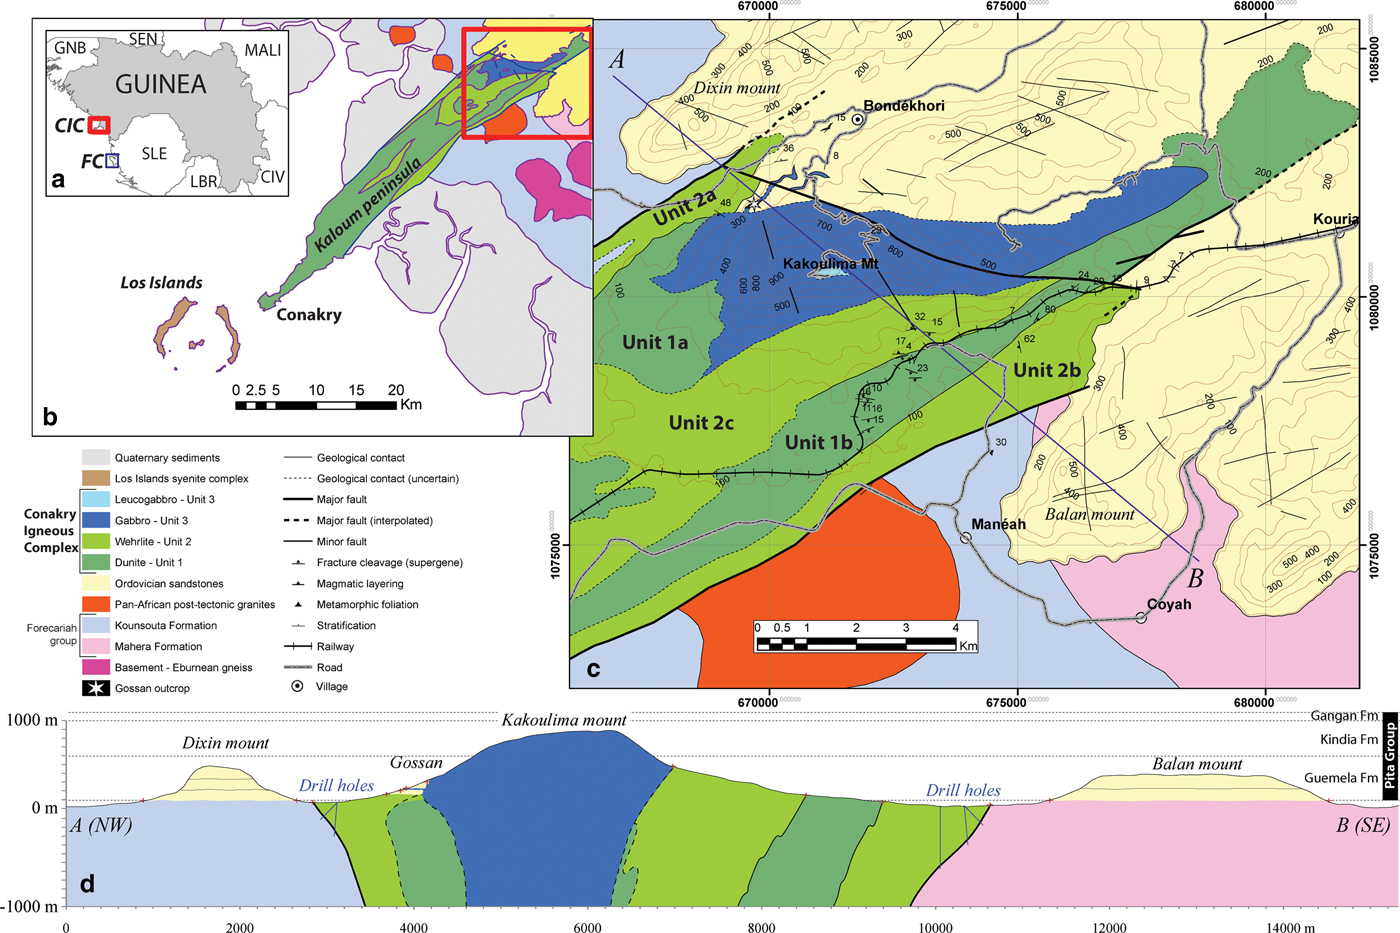
In contrast the Conakry Igneous Complex, located ~135 km N of the Freetown Complex (Fig. 1a), remains little known. This complex was described and mapped for the first time in 1959 (Barrère, Reference Barrère1959). It consists of two different geographical entities: the Kaloum Peninsula and Mount Kakoulima (Fig. 1b). The Kaloum Peninsula on which the city of Conakry is developed is constituted of strongly weathered peridotite (laterite) covered by a thick iron cap. Contrasting with this relatively flat area, Mount Kakoulima (Fig. 1c) reaches an elevation of 1010 m and is mainly composed of gabbroic rocks, believed to overlie peridotite units equivalent to the Kaloum formations (Diallo et al., Reference Diallo, Bertrand, Azambre, Grégoire and Caseiro1992).
Location, simplified geologic map and cross-section of the Conakry Igneous Complex. (a) Location of the Conakry Igneous Complex in the western part of Guinea (red rectangle) and the Freetown Complex in the western part of Sierra Leone (FC, blue rectangle). (b and c) Simplified geological map of the Conakry Igneous Complex from field data. Geological mapping of Forecariah group and basement are taken from Villeneuve et al. (Reference Villeneuve, Bellon, Corsini, Le Metour and Chatelee2015). (d) NW–SE cross-section of the Conakry Igneous Complex with position of drillholes constraining Conakry Igneous Complex contacts with host rocks.

The Kaloum Peninsula has been little studied, owing to the intensive urbanization and the lack of unweathered rocks, whereas Mount Kakoulima, which is well exposed, has been the subject of several publications (Diallo et al., Reference Diallo, Bertrand, Azambre, Grégoire and Caseiro1992; Deckart et al., Reference Deckart, Féraud and Bertrand1997, Reference Deckart, Bertrand and Liégeois2005) and of successive exploration efforts following the discovery of a gossan developed on “submassive” Ni–Cu sulfides. However, recent exploration work (see below) has failed to find any significant mineralized zones on the mountain, the geology of which is still poorly constrained.
Considering the potential interest of the poorly described Conakry Igneous Complex, we decided to reinvestigate this complex, to better understand its geology and mineralization, and to compare the Complex with other intrusions related to the same magmatic event. Our approach has enabled us to propose a new model explaining the geometry and emplacement of the Conakry Igneous Complex, previously described as a layered complex (Barrère, Reference Barrère1959; Diallo et al., Reference Diallo, Bertrand, Azambre, Grégoire and Caseiro1992), and to better constrain the mineralizing processes. Platinum-group minerals (PGM) are also reported for the first time in the Conakry Igneous Complex.
Geological setting
The Conakry Igneous Complex is located on the western border of the West African Precambrian craton, also known as the Leo Rise, e.g. Milési et al., Reference Milési, Ledru, Feybesse, Dommanget and Marcoux1992). This craton has been heterogeneously built and structured by three successive orogenic and depositional cycles (Leonian ~3250–3050 Ma, Liberian ~2950–2800 Ma and Birrimian-Eburnean ~2200–2000 Ma) and is composed of metamorphic units intruded by granitoids and supracrustal greenstone belts (e.g. Bessoles Reference Bessoles1977, Milési et al., Reference Milési, Ledru, Feybesse, Dommanget and Marcoux1992; Thiéblemont et al., Reference Thiéblemont, Goujou, Egal, Cocherie, Delor, Lafon and Fanning2004). The Leo Rise is in part overlapped by the Neoproterozoic–Palaeozoic detrital series of the Taoudeni Basin s.l., and affected by several Pan-African and Variscan orogens (Villeneuve, Reference Villeneuve, Ennih and Liégeois2008; Villeneuve et al., Reference Villeneuve, Bellon, Corsini, Le Metour and Chatelee2015 and references therein). On the west side of the Leo Rise these orogens are: (1) the Bassarides (Pan-African I, 660–650 Ma); (2) the Rokelide (Pan-African II, 550–530 Ma); and (3) the Mauritanides (Hercynian, 330–270 Ma). In Guinea, the southern part of the Taoudeni Basin corresponds to discordant basins or troughs: (1) the Madina-Kouta Basin (~1000–630 Ma); (2) the Komba and Kolenté Troughs (530–510 Ma); and (3) the Bové Basin (~480–360 Ma). The Bové Basin, in the western part of Guinea, corresponds to a flat-lying synform that unconformably overlies older terranes of the Pan-African Rockelides (Villeneuve and da Rocha Araujo, Reference Villeneuve and da Rocha Araujo1984). In the study area (Figs 1c,d), it comprises the Ordovician Guemeta Formation (500 m thick), which consists of alternating heterolithic conglomerates and coarse feldspar-bearing sandstones that lie on pan-African rocks of the Forecariah Group, also including Archean remnants (Villeneuve et al., Reference Villeneuve, Bellon, Corsini, Le Metour and Chatelee2015).
The Central Atlantic Magmatic Province corresponds to a short and widespread magmatic event, dated from 202 to 190 Ma (close to the Triassic/Jurassic boundary, Nomade et al., Reference Nomade, Knight, Beutel, Renne, Verati, Féraud, Marzoli, Youbi and Bertrand2007), affecting a 5000 km long and 2000 km wide zone across Africa, Europe, and both North and South America. This is one of the largest igneous provinces on Earth with abundant continental tholeiites occurring as diabase dykes (Dars, Reference Dars1960) and sills (Bertrand, Reference Bertrand, Kampunzu and R.T.1991), but also as large intrusive bodies such as the Conakry Igneous Complex in Guinea (Diallo et al., Reference Diallo, Bertrand, Azambre, Grégoire and Caseiro1992) and the Freetown Complex in Sierra Leone (Briden et al., Reference Briden, Henthorn and Rex1971). Gabbro from Mount Kakoulima has been radiometrically dated at 201.4 ± 1.5 Ma (40Ar/39Ar on plagioclase, Deckart et al., Reference Deckart, Féraud and Bertrand1997) and 201.5 ± 0.5 Ma (U/Pb on zircon, SEMAFO, 1999) whereas the Freetown Complex radiometric age has been determined at between 232.1 ± 9 and 196.3 ± 3 Ma (40Ar/39Ar on biotite, plagioclase and amphibole, Barrie et al., Reference Barrie, Wijbrans, Andriessen, Beunk, Strasser-King and Fode2010), showing that these complexes were emplaced at an early stage of this large magmatic event. Other NE–SW-trending ultramafic bodies with no outcrops along the west coast of Guinea are inferred from magnetic and gravity data. Among these the Cap Verga and Boffa geophysical anomalies could be compared to those revealed by large dykes or complexes such as the Conakry Igneous Complex and the Freetown Complex (Ponsard, Reference Ponsard1984; Ponsard et al., Reference Ponsard, Roussel, Villeneuve and Lesquer1988).
Previous work
The Conakry Igneous Complex (Figs 1c,d), comprising the Kaloum Peninsula and Mount Kakoulima, is a 50 km long mafic-ultramafic complex (Barrère, Reference Barrère1959; Legoux, Reference Legoux1960; Diallo et al., Reference Diallo, Bertrand, Azambre, Grégoire and Caseiro1992) extending along the SW–NE Conakry-Dalaba lineament (Bertrand and Villeneuve, Reference Bertrand and Villeneuve1989). This complex intrudes an Archean to Pan-African basement composed of granulitic gneiss, migmatites and mica-schists of the Forecariah Group (Boufeev, Reference Boufeev1968; Villeneuve, Reference Villeneuve1984) that are intruded by Pan-African II granites and pegmatites such as the Coyah-Maneah granite, dated at 533 ± 7 Ma (Dallmeyer et al., Reference Dallmeyer, Caen-Vachette and Villeneuve1987). This basement is overlapped by the flat-lying Ordovician sandstones of the Guemeta Formation under which the complex disappears to the NE where contact metamorphism is described (Barrère, Reference Barrère1959). The southwestern part of the complex (Kaloum Peninsula) is bounded by the Los Islands peralkaline nepheline syenite ring complex (Fig. 1b), dated at 104.3 ± 1.7 Ma (Rb/Sr whole-rock isochron, Moreau et al., Reference Moreau, Ohnenstetter, Demaiffe and Robineau1996).
The Conakry Igneous Complex has been described as a layered ultramafic-mafic sill-like complex (Barrère, Reference Barrère1959; Diallo et al., Reference Diallo, Bertrand, Azambre, Grégoire and Caseiro1992) comprising an ultramafic unit at the base (corresponding to the 33 km long Kaloum Peninsula) that evolves progressively into a mafic unit at the top (corresponding to the 17 km long Mount Kakoulima). Barrère (Reference Barrère1959) defined a “transition zone” between the two units consisting of several lithologies such as wehrlite, plagioclase-wehrlite, troctolite and gabbro. This zone is sub-horizontal and dips 15° to the NNE in the southern portion of the complex and 15° to the SSE in the northern portion (Barrère, Reference Barrère1959). The ultramafic unit does not crop out in the Kaloum Peninsula, which is covered by a laterite crust (ferricrete) more than 30 m thick. Descriptions of water-drilling reaching the bedrock mention rare wehrlites characterized by poikilitic texture (Legoux, Reference Legoux1960) and “layered dunite adcumulate” (Diallo et al., Reference Diallo, Bertrand, Azambre, Grégoire and Caseiro1992). Several sills and dykes of gabbro are observed on the northern ultramafic flank of the Kakoulima highlands (Barrère, Reference Barrère1959).
Various exploration surveys have been conducted in the Conakry Igneous Complex (see details in Konaté and Pan, Reference Konaté and Pan2013). Although during the 1950s laterites were exploited for iron in the Conakry Peninsula; in the 1960s, specific attention was paid to the Ni concentrations in the laterite developed on the ultramafic facies on the slopes of Kakoulima. Probably because of their low Ni contents and the need for a complex technology for the beneficiation of Ni in its oxide form, the subject was quickly abandoned.
Between 1979 and 1981 a geophysical exploration survey was conducted in the Conakry Igneous Complex, including airborne and ground magnetics, spectrometry and electromagnetics, leading to the conclusion that the complex was an important target for further mineral exploration. More recently, detailed exploration surveys have been carried out by SEMAFO-AFCAN (1996–1998), Rio Tinto (1999–2001), FNX Mining (2004–2006), Mega Uranium (2004–2007) and Sable Mining (2010–12). These focused on the potential for Ni–Cu–Co–PGE sulfide mineralization, following the discovery of a 0.8 m thick “massive sulfide layer” with a 100 m x 100 m extent by SEMAFO-AFCAN mining companies on the northern flank of Mount Kakoulima (Figs 1c,d). The detailed geometry of the sulfide layer and its environment is poorly described in company reports. This sulfide mineralization is found in sills of various lithologies (plagioclase wehrlite, lherzolite melanogabbro…) intrusive within the host sandstones, close to the “transition zone” of Barrère (Reference Barrère1959). The massive sulfide layer consists of pyrrhotite, pentlandite, chalcopyrite, pyrite and magnetite. Reported average metal contents are 2.78 to 3.60% Ni, 0.86 to 1.10% Cu, 0.15% Co and 2 to 4 g/t PGE (SEMAFO Inc., 2001; Konaté and Pan, Reference Konaté and Pan2013).
According to Konaté and Pan (Reference Konaté and Pan2013), the mining company Mega Uranium Ltd. drilled 23 holes totalling 9303.5 m, 16 holes to test the northern contact zone where the massive sulfide layer was first discovered and seven in the southern part of the complex (Fig. 1d). This company mentioned a total of 14.7 m with 0.35% Ni, 0.39% Cu, 0.17 g/t Pt and 0.79 g/t Pd on the northern contact (Mega Uranium, 2006). All the drill holes in the south flank were negative. None of the mineralized occurrences described in the mining company reports were available for this study.
The model tested by the mining companies was the ‘reef’ model, the complex being interpreted as a stratiform mafic/ultramafic intrusion. Thus, despite numerous drilling and exploration campaigns, there has so far been no discovery of a massive sulfide layer in the Kaloum-Kakoulima Complex.
Field data
The geology of the northeastern part of the Conakry Igneous Complex was revisited in 2012–2013. A detailed study along several cross-sections, including structural observations and a systematic sampling, was supplemented by the reinterpretation of unpublished geophysical and borehole data. After detailed petrographic examination of the various facies collected, a simplified geologic map and a cross-section were produced (Figs 1b,c,d) incorporating these new data on the geology of the Complex.
Weathering profile and related fractures
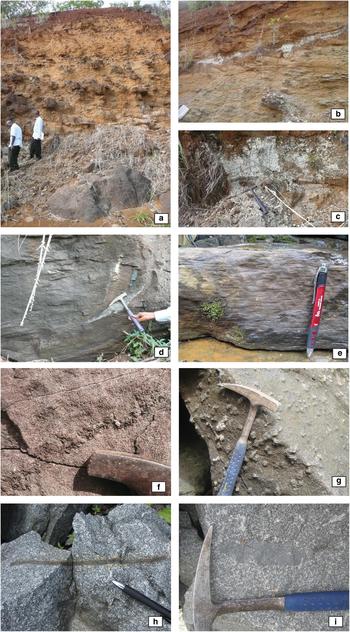
The Kaloum Peninsula is covered by a weathering profile characterized by a thick ferricrust. A weathering profile, strongly truncated by erosion, completely covers Mount Kakoulima. Remnants of this weathering profile are marked by numerous rounded gabbro boulders, ferricrust levels and boulders, locally including gossans. Along the railway line (Figs 1c and 2a) between the 300 and 500 m elevations, all the zones of the Taylor and Eggleton (Reference Taylor and Eggleton2001) classification (soil, duricrust, mottled zone, pallid zone, saprolite and fresh rocks) are exposed. Owing to this weathering, outcrops of fresh rocks on the Kakoulima uplands are observed mainly in streams, railway cuttings and natural cliffs
Photographs of selected outcrops on the Conakry Igneous Complex. (a) weathering profile in the ultramafic unit showing the low-angle fracture cleavage. (b) Gabbro dyke cutting the ultramafic unit in the weathering profile. (c) Pegmatoid leucogabbro. (d) Low-angle fractures within wehrlite. (e) Fracture system in wehrlite, Unit 2. Next page: (f) Clinopyroxenite veinlet in wehrlite from Unit 2. (g) Large clinopyroxene crystals in wehrlite, Unit 2. (h) Fragment of a clinopyroxenite layer in gabbro. (i) Enclave of fine-grained gabbro in coarse-grained gabbro norite (Unit 3).

All the rock types contain a penetrative low-angle fracture-cleavage network, observed on outcrops. This network of thin, dry, unfilled fractures appears progressively better developed towards the topographic surface (Figs 2a,b,d,e). Measurements of these fractures show that, on average, they trend N079°E with a dip of 17° toward the south. Some scarce fracture-cleavage networks locally trend towards the north in the southern part of the complex.
Field relationships
All the facies encountered in the Conakry Igneous Complex are characterized by the presence of varying proportions of chromite, olivine, clinopyroxene, orthopyroxene and plagioclase, and form: (1) peridotite s.l. (dunite, clinopyroxene-bearing dunite, plagioclase-bearing dunite, clinopyroxene-plagioclase-bearing dunite); (2) pyroxene-peridotite (wehrlite, plagioclase-bearing wehrlite, lherzolite, plagioclase-bearing lherzolite); and (3) gabbro (troctolite, gabbro, gabbronorite, olivine-bearing gabbronorite, leucogabbro). Chromite is omnipresent in the ultramafic facies, magnetite and ilmenite in some gabbros. The occurrence of decimetre thick chromite layers and lenses up to 1 m in lateral extension, described by Bering (Reference Bering1998), has not been confirmed. Secondary and alteration minerals include serpentine (alteration of olivine with formation of secondary magnetite and magnesite), amphibole (after pyroxene) and mica.
At the scale of the outcrop, none of these lithologies displays a pronounced magmatic layering, although scarce irregular centimetric pyroxene layers are observed in some gabbronorites (Fig. 2f) also discontinuous centimetric clinopyroxenite horizons within wehrlite. Most of the poorly-defined layering found everywhere on Mount Kakoulima exhibits a low dip to the north, averaging N269°E/20 (Fig. 1c).
The various cross-sections constructed on both flanks of the northeastern portion of the Conakry Igneous Complex enabled us to establish that the complex comprises three main lithological units: dunite and pyroxene-poor peridotite forming the dunite unit s.l., hereafter defined as Unit 1, pyroxene peridotite forming the wehrlite unit (Unit 2) and gabbro s.l. forming the gabbro unit (Unit 3).
Detailed mapping established the distribution of these three lithological units (Figs 1b,c). While the gabbro unit forms a single body, the dunite unit occurs in two separate geographic entities (1a and 1b) whereas the wehrlite unit (Unit 3) forms three branches. The northern and southern edges of the Complex, which also correspond to the lowest elevation (≤ 100 m), consist of two occurrences of the wehrlite Unit 2 (labelled 2a and 2b, respectively in Fig. 1c). They trend N040°E on average and run parallel to the Kaloum Peninsula. Towards the NE, both limbs intrude the sandstones of the Guemeta Formation (Fig. 1c). Rare wehrlite sills derived from Unit 2a intruding sandstones have been observed on the northern contact; no other intrusive contacts are exposed.
Towards Mount Kakoulima, the 2a and 2b wehrlite formations are in contact with two dunite branches (1a and 1b respectively, Fig. 1c) but contacts between dunite and wehrlite units were not observed. The southern dunite (1b) crops out between the 100 and 200 m elevations. The spatial distribution of the dunite branches (Fig. 1c) also suggests a N040°E trend. A third N040°E-trending wehrlite branch (2c) crops out in the centre of the intrusion and along the southern flank of Mount Kakoulima. The gabbro unit (Unit 3) is represented by gabbronorite, which constitutes the uppermost part of Mount Kakoulima. This ~N080°E-trending unit crosscuts the previous units (Figs 2b,c) and crops out from 200 to 1000 m in elevation. There is no clear transition zone between the mafic and ultramafic units. Unit 3 appears heterogeneous with several mafic lithologies (gabbronorite ± ol ± qz or gabbro s.s.), but also a local occurrence of leucogabbro on the top of Mount Kakoulima (Fig. 1c). Rounded enclaves of various types of gabbro enclosed in gabbronorite were observed throughout the unit (Fig. 2i) and more locally decimetre-sized enclaves of sulfide-bearing clinopyroxenite (Fig. 2h). Around this gabbronorite Unit 3, we found scarce decametric dykes of gabbronorite crosscutting dunite (Unit 1) and wehrlite (Unit 2; Figs 2b,c). The transverse trend of the gabbronorite unit, and the occurrence of gabbronorite dykes and ultramafic enclaves indicate that the gabbronorite unit postdates the previous units. The steep westerly dip of 50 to 85° recorded for these enclaves suggests a vertical magmatic flow.
All units of the complex are crosscut by a major transverse fault trending ca. N110°E. The geological mapping (Fig. 1c) suggests a NE-trending steeply dipping normal fault. On the northeastern side of this transverse fault the intrusive contact of the gabbronorite unit within sandstone is generally ~300 m in elevation. In this area, both the composition of the intrusion, i.e. quartz-bearing gabbro-norite (possible sandstone assimilation, as suggested locally by the presence of sandstone enclaves), presence of numerous pegmatoid dykes and pods (late melt accumulation) and of pluricentimetric patches of sulfides (possible sulfur contamination) argue for a present-day erosion level close to the roof of the complex (Fig. 2). Conversely, on the southwestern side of the transverse fault, the gabbronorite unit crosscuts the host sandstones and extends up to the 1000 m elevation (Section Fig. 1d).
Petrography, mineralogy and textures
Weathering and secondary minerals
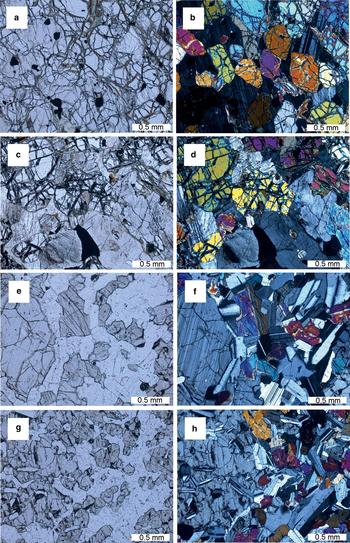
Thin sections were prepared for rocks exhibiting low-angle fractures at macroscopic scale. Under the microscope, within olivine crystals, a preferred orientation of serpentine is observed (Figs 3a–d), underlined by the development of mm-sized carbonate. No correlation has been observed between the shape and distribution of primary magmatic minerals, e.g. olivine, pyroxene, amphibole, and these low-angle fractures filled by secondary minerals. Moreover, the amount of secondary minerals seems to be correlated with the amount of low-angle fracturing observed at macroscopic scale. Secondary and alteration minerals include serpentine (alteration of olivine with formation of secondary magnetite and magnesite), amphibole (after pyroxene) and mica.
Photomicrographs of various rock types of the Conakry Igneous Complex (left: plane-polarized light, right: cross-polarized light). (a, b) Dunite, typical fracturing with local development of carbonate veinlets. Sample KK67, Unit 1. (c, d) Clinopyroxene dunite, showing euhedral olivine and chromite and interstitial clinopyroxenes. Sample KK7, Unit 1. (e, f) Plagioclase wehrlite showing euhedral olivine and clinopyroxene and interstitial plagioclase. Sample KK58, Unit 2. (g, h) Plagioclase wehrlite displaying a complex texture, with tiny euhedral olivine partly included in large clinopyroxene. Sample KK4, Unit 2.

Unweathered facies
Dunite (Unit 1) displays an adcumulate texture. Everywhere it contains small, disseminated euhedral chromite crystals, generally included in olivine. No chromite schlieren were found. A minor proportion of clinopyroxene and/or plagioclase in many cases appears interstitial with respect to euhedral olivine crystals (Figs 3c,d). Where the proportion of clinopyroxene is higher (Unit 2, wehrlite and pyroxene peridotites), olivine remains euhedral, generally as large (cm-size) cumulus minerals together with clinopyroxene; where present, plagioclase tends to be interstitial (Figs 3e,f and 4a,b).
Some samples of Unit 2 exhibit a poikilitic texture with large (cm-size) euhedral oikocrysts of clinopyroxene (or orthopyroxene) containing abundant small euhedral olivine and chromite crystals (Figs 3g,h). This characteristic facies is easily recognizable in the field, where large clinopyroxenes appear as ‘nodules’ dispersed in dunite (Fig. 2g). In other wehrlite and lherzolite facies, olivine crystallization precedes pyroxene crystallization and plagioclase is always interstitial (orthocumulate texture). Olivine tends to be equant and orthopyroxene/clinopyroxene tends to occur as laths (up to 5 mm long) locally exhibiting a poorly-defined, possibly magmatic flow orientation (Figs 4c,d). Where the proportion of plagioclase is higher (Unit 3, gabbro) plagioclase appears as a cumulus phase, either as large equant euhedral crystals (Fig. 4e,f) or as more or less well-oriented laths (Figs 4g,h). This latter facies has a diabasic affinity, and when present, olivine and both pyroxenes appear as cumulus and euhedral whereas plagioclase seems post-cumulus. Some gabbros also exhibit a poikilitic (or ophitic) texture, where small laths of plagioclase are included in pyroxene oikocrysts.
Photomicrographs of various rock types of the Conakry Igneous Complex (left: plane-polarized light, right: cross-polarized light). (a, b) Plagioclase wehrlite, showing euhedral olivine, pyroxenes and chromite and interstitial plagioclase. Sample KK22, Unit 2. (c, d) BMS-bearing plagioclase wehrlite, showing an orthopyroxene lath and a sulfide droplet. Sample KK95-2, Unit 2. (e, f) Coarse-grained gabbro norite. Sample KK46, Unit 3. (g, h) Fine-grained gabbro showing plagioclase laths. Sample KK88, Unit 3.

Chromite is generally small (<100 µm), euhedral and commonly included in olivine, and has been found in all rock types, including gabbro. In some cases, chromite forms irregular symplectites in olivine. It should also be mentioned that some olivines are particularly rich in magmatic inclusions (glass plus a small opaque mineral) trapped along crystal growth planes. Euhedral titanomagnetite and magnetite are restricted to gabbros from Unit 3, whereas interstitial mica is found sporadically in all rock types. Some samples contain mm-sized droplets of sulfides (Figs 4c,d).
Analytical techniques
Silicates and oxides
Silicates and oxides were analysed by electron probe microanalysis (EPMA) with the CAMECA SXFive operated by the ‘Plateforme analytique régionale’ (BRGM – Université d'Orléans – CNRS Orléans) equipped with five wavelength dispersive spectrometers under the following conditions: acceleration voltage of 15 keV, beam current of 12 nA, counting time of 10 s. Natural in-house minerals were used as standards. Kα lines were used for all the elements.
Platinum-group minerals
Platinum-group minerals were analysed by EPMA using the CAMECA SXFive equipped with five wavelength dispersive spectrometers. Analytical details are provided in Augé et al. (Reference Augé, Morin, Bailly and Serafimovsky2017). All the values given in the Tables are above the detection limit. Twenty-two elements were determined.
Whole-rock analyses
Whole rock analyses were performed by ALS Geochemistry, Ireland. Major elements were determined by inductively coupled plasma atomic emission spectroscopy (ICP-AES) after lithium borate fusion and acid dissolution. Trace elements were analysed by inductively coupled plasma mass spectrometry (ICP-MS) and ICP-AES after four-acid digestion, and rare-earth elements (REE) by ICP-MS after lithium borate fusion and acid dissolution. Au, Pt and Pd were determined by lead fire assay with ICP-MS finish.
Mineral chemistry
One hundred and five samples were collected from six principal sections and a large gabbro quarry located on the NE flank of Mount Kakoulima. All were studied in polished thin section and 46 representative samples were selected for electron probe microanalyses. Selected mineral compositions are given as Supplementary Tables (Tables S1 to S5, see below). All the values given below are above the detection limit. In each polished section, five points on a given mineral species were usually analysed to test potential zoning and compositional variability. As expected in such a setting, no significant differences were observed and average compositions were calculated and used in the figures. To facilitate interpretation of the mineral chemistry, the three units have been distinguished on the mineral composition diagrams.
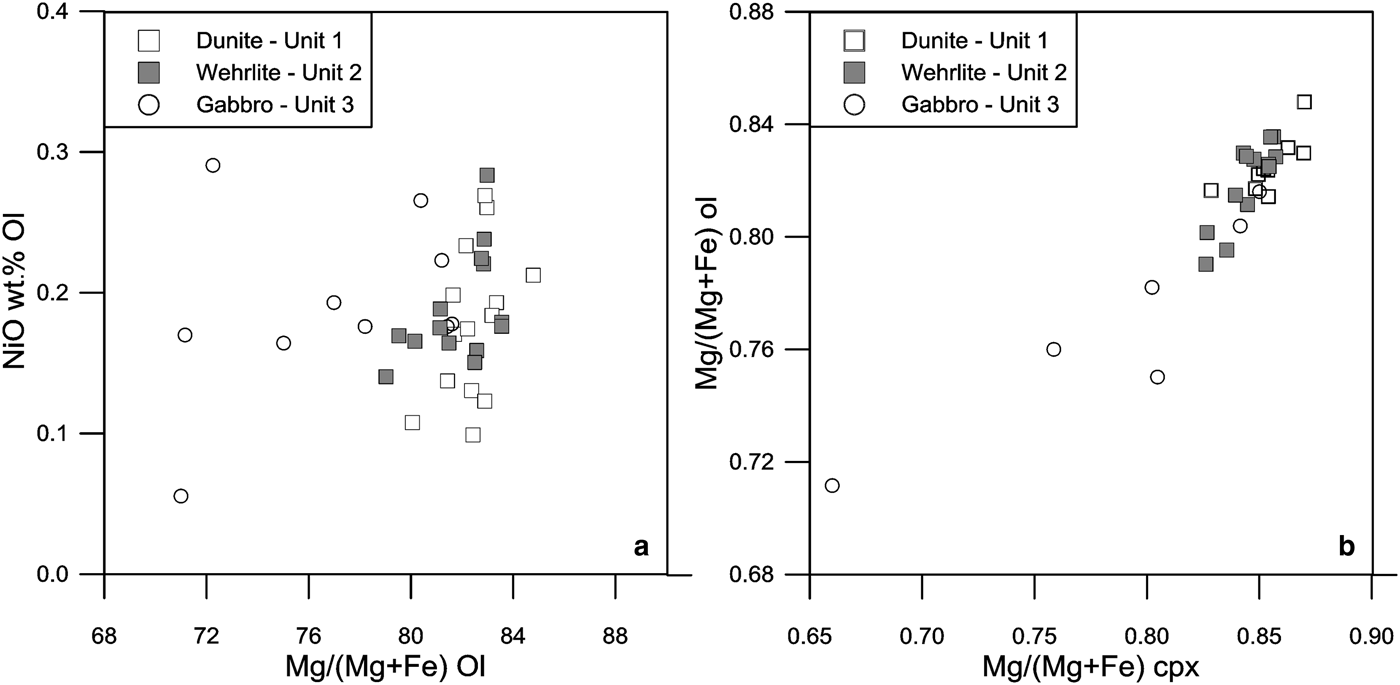
Olivine composition (Supplementary Table S1) in dunite (Unit 1) ranges between Fo 84.8 and Fo 80.0. Its NiO content ranges between 0.1 and 0.3 (Fig. 5a). In wehrlite and related facies (Unit 2) olivine composition ranges between 83.6 and 79.0, and there is an almost total overlap between the two units. In the gabbro unit, olivine composition ranges between Fo 81.6 and 71.0, with a partial overlap between the mafic and ultramafic units.
Plot of (a) NiO in wt. percent vs. Mg/(Mg + Fe) in molar percent in olivine and (b) distribution of Mg/(Mg + Fe) in molar percent between olivine and clinopyroxene from the three units of the Conakry Igneous Complex.

The variation of olivine composition plotted along the various sections appears erratic and cannot be interpreted in terms of differentiation with an apparent ‘stratigraphy’. Similarly, the lack of layering in the gabbro unit did not allow us to establish a pseudo-stratigraphy or to interpret the variations in the mineral composition.
Taken as a whole, a clear and steady evolution of olivine composition from Fo 84.8 to Fo 71.0 is observed from the dunite unit to the gabbro unit, the largest variation being observed in the latter. Note the relatively high degree of differentiation recorded by the olivine in the dunite unit.
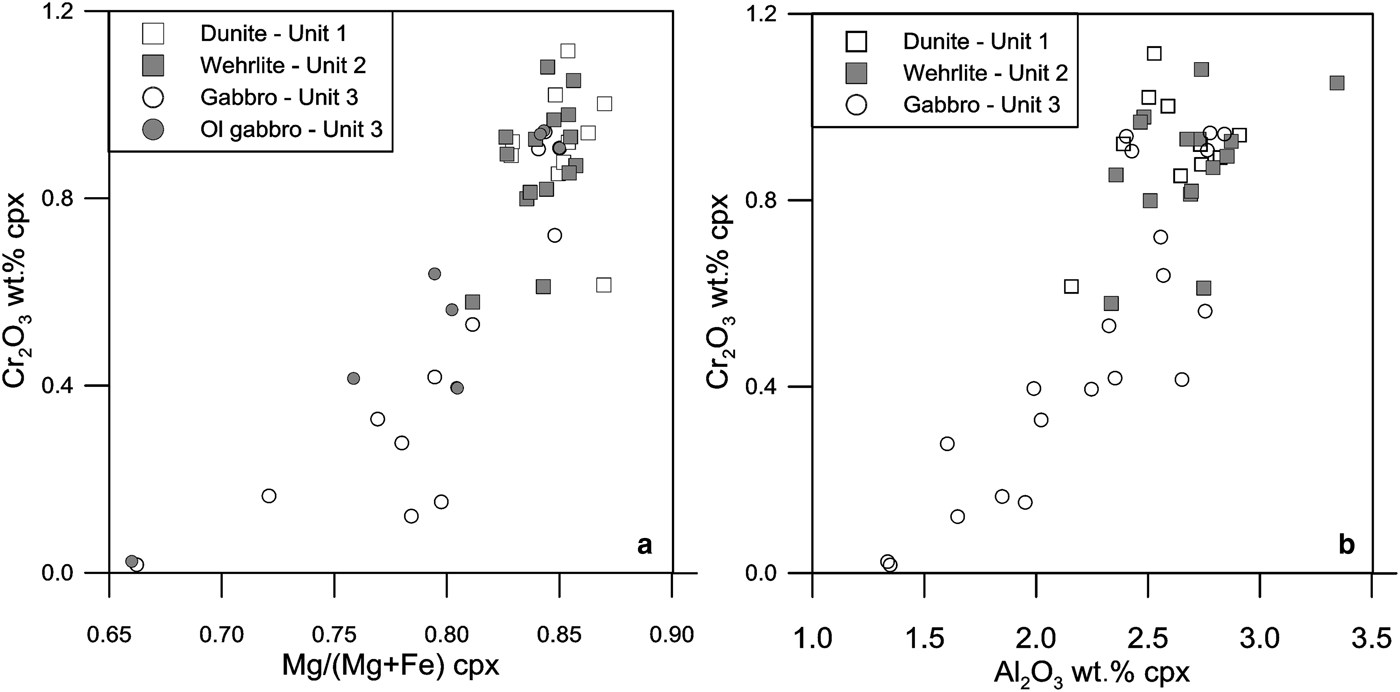
Clinopyroxene composition (Supplementary Table S2) also shows also a large overlap in the three units in terms of Mg# (Fig. 5b). We can distinguish a first compositional range, with an Mg# ranging between 87.0 and 81.1 with no evidence of a differentiation trend in Units 1, 2 and 3, and a second range, between 80.6 and 66.0 for the clinopyroxene in the gabbro unit, accompanied by a strong decrease in Cr2O3 and Al2O3 (both being strongly correlated, Figs. 6a,b). This could indicate the derivation of the most primitive portion of the gabbro unit from Unit 2, followed by differentiation in a closed system. However, the presence of olivine in the gabbro is not correlated with the degree of differentiation, as shown in Fig. 6a. Figure 5b shows a linear distribution of the Mg# between olivine and clinopyroxene for the three units, indicating equilibrium crystallization between the coexisting minerals.
Plot of (a) Cr2O3 in wt. percent vs. Mg/(Mg + Fe) in molar percent and (b) vs. Al2O3 in wt. percent in clinopyroxene from the three units of the Conakry Igneous Complex. For Unit 3, olivine-bearing gabbros are distinguished in (a).

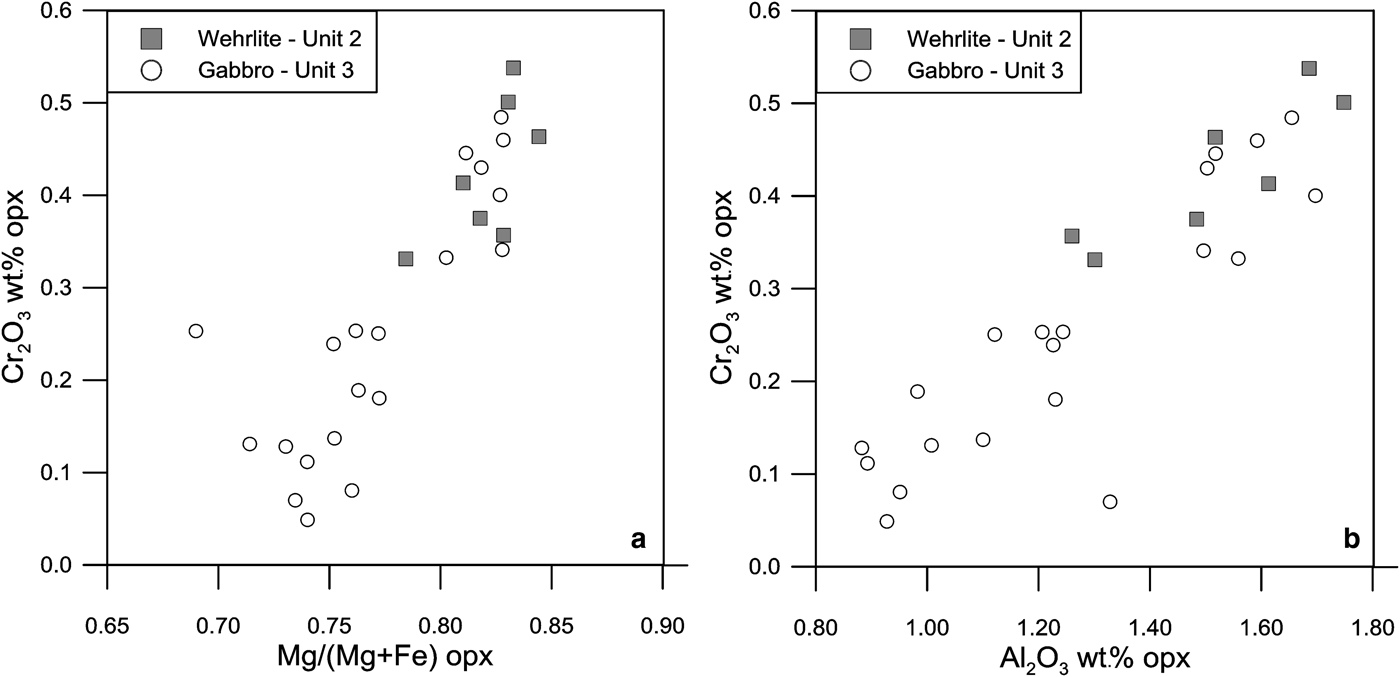
Orthopyroxene is present in many of the wehrlites and related facies (such as lherzolite) of Unit 2 but also occurs in most gabbros (Unit 3). Its composition (Supplementary Table S3) reflects that of clinopyroxene, with Mg-rich crystals in pyroxene peridotite and in some gabbros, and a trend towards more evolved compositions in the gabbro unit. The differentiation trend, marked by a decrease in the Mg# (Fig. 7a) is also clearly correlated with a decrease in Cr2O3 and Al2O3, with a good correlation between both elements (Figs 7a,b).
Plot of (a) Cr2O3 in wt. percent vs. Mg/(Mg + Fe) in molar percent and (b) vs. Al2O3 in wt.% in orthopyroxene from Units 2 and 3 of the Conakry Igneous Complex.

Plagioclase is present in most of the Conakry Igneous Complex rock types. Its composition (Supplementary Table S4) varies within the same range for the dunite and related facies (An 75.5 to An 63.1) and the wehrlite and related facies (An 78.7 to An 58.6). Some gabbros tend to have a more An-rich composition (An 80.1 to An 47.9).
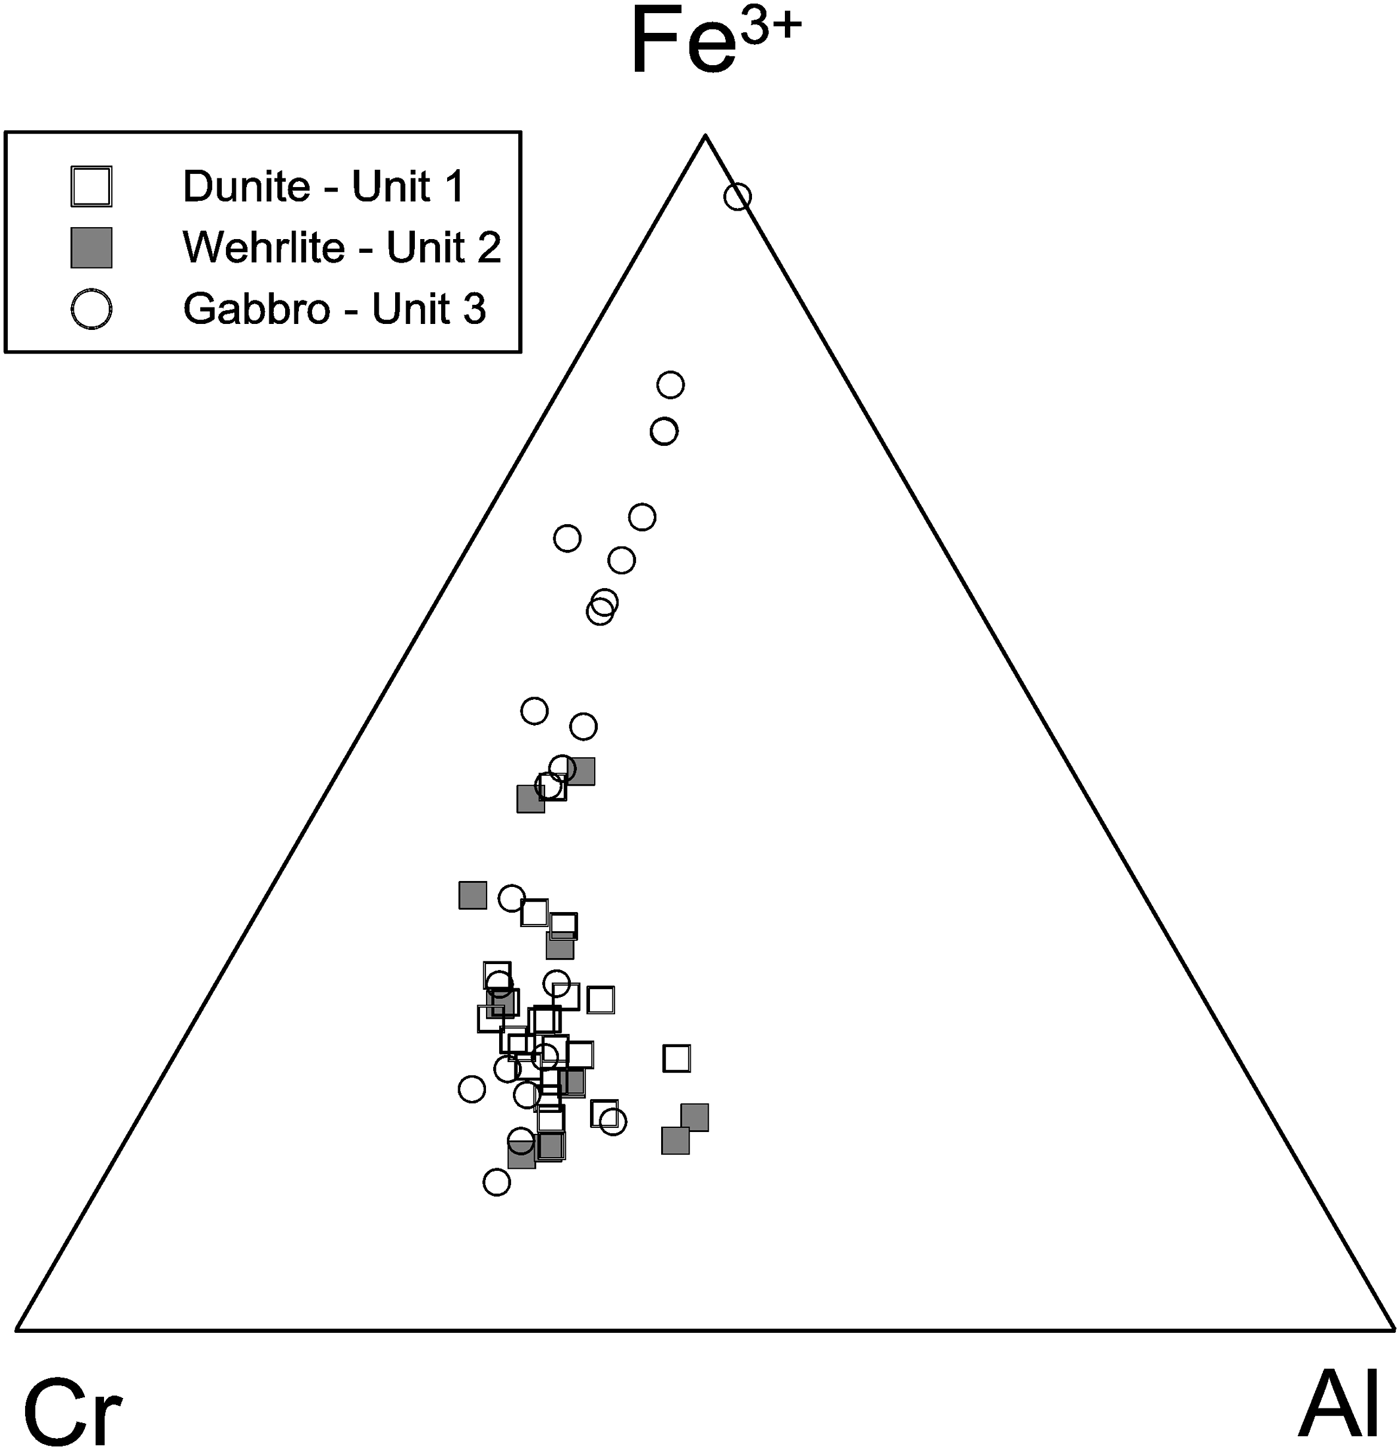
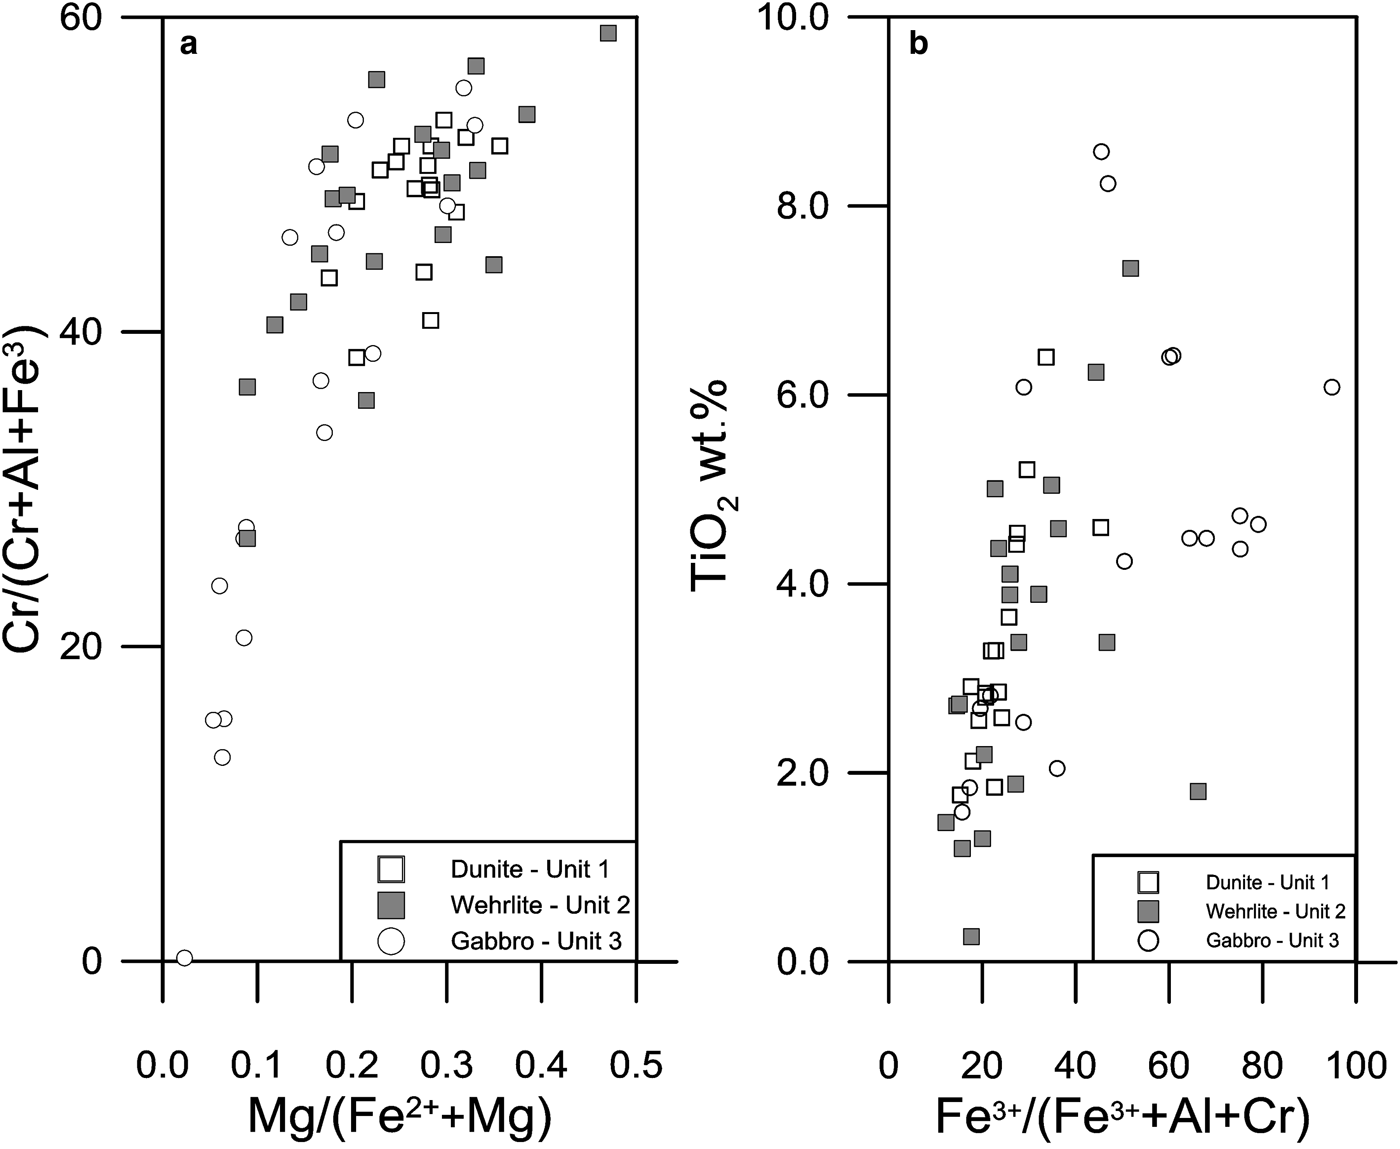
Chromite is ubiquitous in the ultramafic facies and very common in the gabbro unit (Supplementary Table S5). In the triangular diagram (Fig. 8) it is characterized by relatively high Fe3+ values; dunite, pyroxene peridotite and some gabbros plot in the same central area of the diagram. A differentiation trend is marked by an Fe3+ enrichment, Fe3+ substituting for Cr at relatively constant Al content, and affecting the gabbro unit more specifically, again testifying to a differentiation trend in part of the gabbro unit. The Fe3+ enrichment (and Cr decrease) is correlated with a decrease in the Mg# (towards the FeCr2O4 pole, Fig. 9a). Chromite is also characterized by variable but frequently high TiO2 values. The high values are not associated with a specific unit, TiO2 ranging between 1.2 and 8.6 wt.% without clear substitution (Fig. 9b). Such high values could be indicative of minerals crystallized from a plume type magma (see for example Pagé and Barnes, Reference Pagé and Barnes2009).
Composition of disseminated chromian spinel in the Al–Cr–Fe3+ diagram for the three units of the Conakry Igneous Complex.

Plots of (a) Cr/(Cr + Al + Fe3+) in molar percent vs. Mg/(Mg + Fe2+) in molar percent and (b) TiO2 in wt. percent vs. Fe3+/(Fe3++Al+Cr) in molar percent in chromian spinel from the three units of the Conakry Igneous Complex.

Whole-rock geochemistry
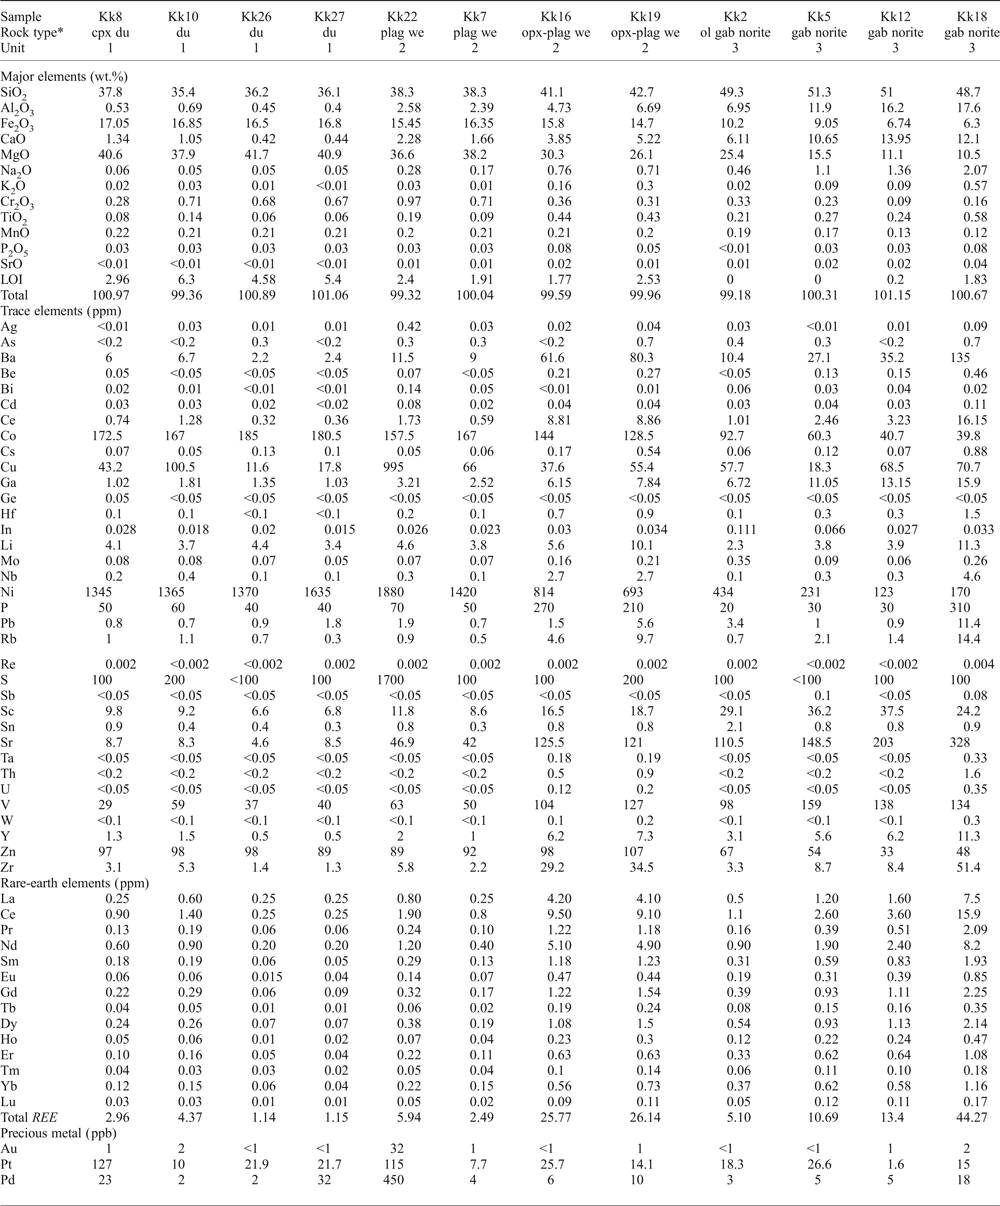
After the mineral chemistry study, 20 representative samples of the three main lithologies were selected (Table 1). This selection was not based on the PGM abundancy.
Major- and trace-element compositions of selected samples from the three units of the Conakry Igneous Complex.

Se < 1 ppm, Te < 0.05 ppm, Tl < 0.02 ppm, W < 0.1 ppm
* Rock type defined according to microscopic characterization.
Major- and trace-element chemistry
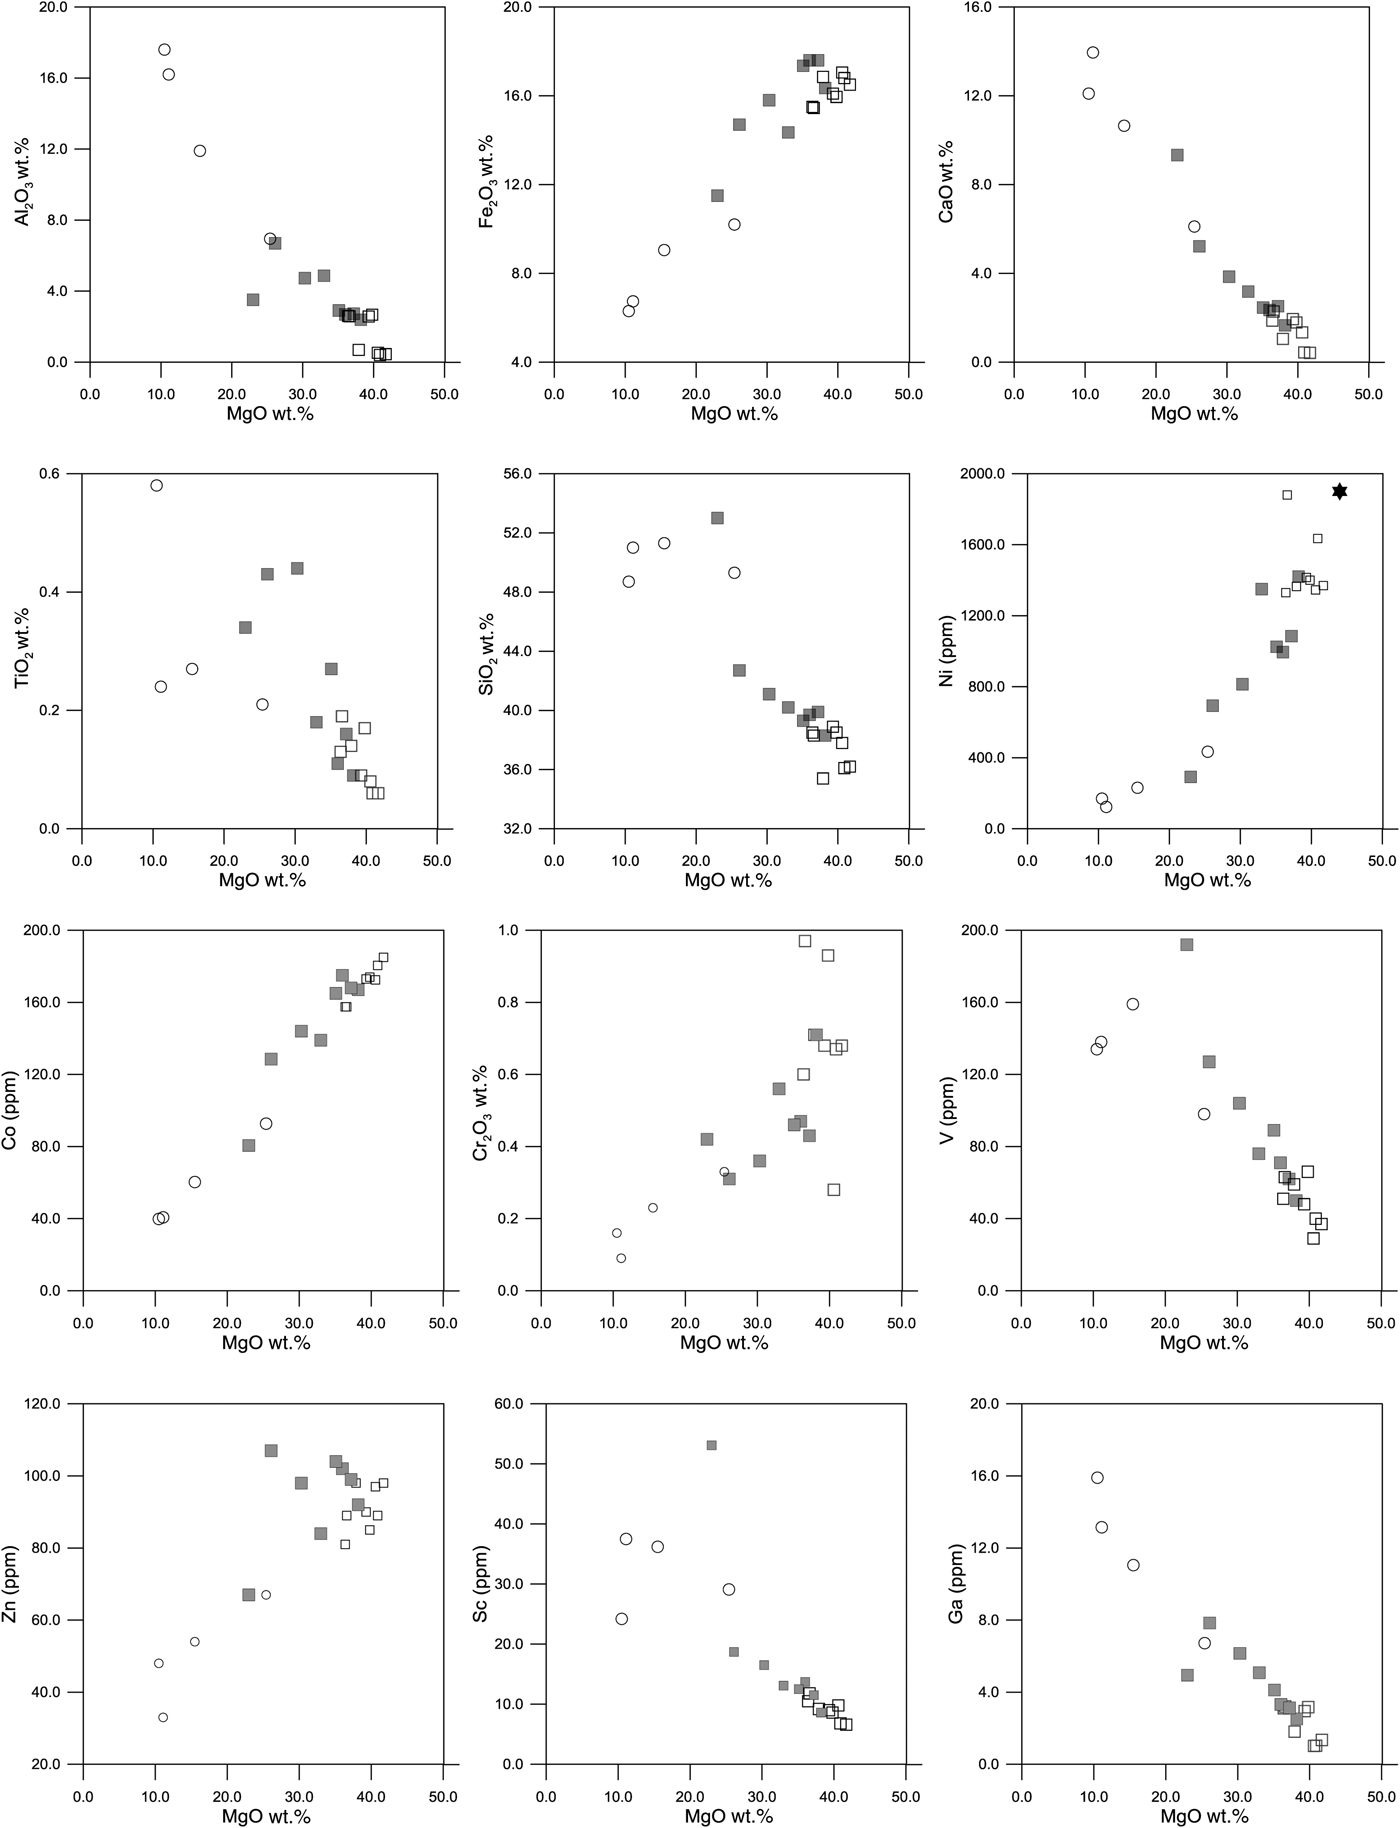
The contents of MgO range from 36.4 to 41.7 wt.% in Unit 1, 23.0 to 38.2 wt.% in Unit 2 (the lowest value corresponding to a plagioclase-bearing websterite), and 10.5 to 25.4 in the gabbro forming Unit 3. Plots of MgO vs. other major elements (Fig. 10) show an apparent chemical continuity between the three units with the following trends with decreasing MgO: an increase in SiO2, Al2O3, CaO, and a decrease in Fe2O3. These compositional trends are controlled by the successive crystal fractionation of olivine (Unit 1), orthopyroxene and clinopyroxene (Unit 2) and plagioclase (Unit 3). This is further illustrated by the minor- and trace-element behaviours: decreasing MgO is associated with decreases in Ni and Co (mainly controlled by olivine) and Cr2O3 (controlled by chromite and clinopyroxene), and increasing V and TiO2 (appearance of Fe-Ti oxides in the most evolved rocks). Gallium and Sc are also negatively correlated with MgO. Gallium is probably controlled by the progressive increase in plagioclase content. Because scandium does not substitute in plagioclase, Sc may be correlated to FeO which is anticorrelated to MgO. The decrease in Zn, related to the decrease in MgO noted in Units 1 and 3, is probably correlated with the decreased proportion of chromite.
MgO vs. selected major, minor and trace elements in the three units of the Conakry Igneous Complex. The star in the MgO–Ni binary diagram corresponds to the average olivine composition in Unit 1. Key as in Fig. 9.

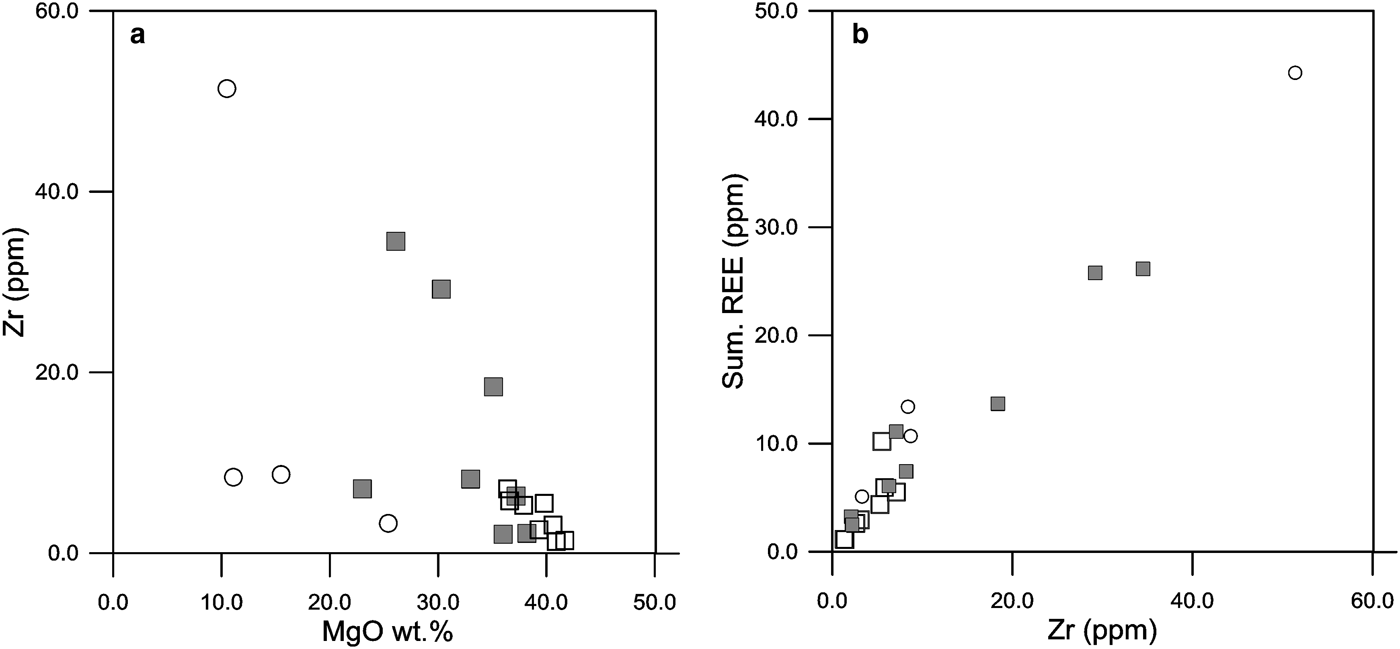
Zirconium exhibits a complex behaviour, displaying two trends with decreasing MgO (Fig. 11a). In the first, it remains low (<10 ppm) and unrelated to the MgO values, whereas in the second it increases with decreasing MgO, the presence of Zr being controlled mainly by zircon. The lack of correlation between Zr and MgO indicates that Zr is not a direct indicator of the degree of differentiation.
(a) MgO vs. Zr and (b) Zr versus total REE content in the three units of the Conakry Igneous Complex. Key as in Fig. 9.

Rare-earth elements
In all the facies, the REE content remains low (Table 1), between 1.6 and 5.9 ppm in Units 1, between 3 and 26 in Unit 2, and 5 and 45 in Unit 3. The total REE content appears to be directly proportional to the Zr content of the rock (Fig. 11b).
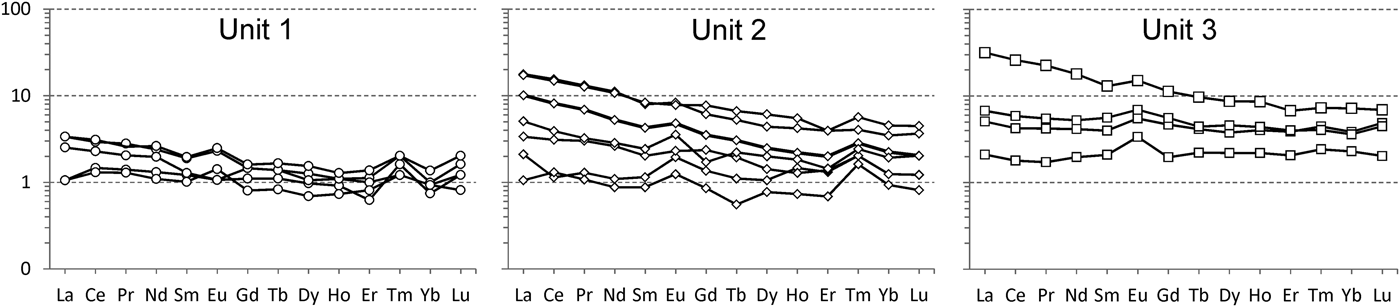
The chondrite-normalized REE patterns (Fig. 12) for Unit 1 are relatively flat, with (La/Yb)n between 1.1 and 2.4 and, for some samples, a slight positive Eu anomaly. Unit 2 also shows a relatively flat but broader pattern, with a slight enrichment in LREE and an (La/Yb.)n ratio between 1.1 and 5.1. Gabbro (Unit 3) exhibits two types of profile: one flat with a slight positive Eu anomaly and an (La/Yb)n between 1 and 1.9, and a second, enriched in LREE, with an (La/)/Yb)n value of 4.4. This latter gabbro has the highest REE content. The weak positive Eu anomaly in some facies in Unit 1 emphasizes the presence of rare interstitial plagioclase, more pronounced in Units 2 and 3.
Chondrite-normalized REE diagrams for selected samples of the three units of the Conakry Igneous Complex. Chondrite values are from McDonough and Sun (Reference McDonough and Sun1995).

Deckart et al., (Reference Deckart, Bertrand and Liégeois2005) published relatively similar patterns for gabbroic cumulates sampled on Mount Kakoulima, with the same range of total REE. On the other hand, they mentioned ultramafic cumulates (“wehrlites”) exhibiting common REE patterns between tholeiites from Guinea and Kakoulima gabbro. Thus they suggested that “the ultramafic cumulates contain a significant amount of trapped liquid” and called them “impregnated cumulates”. They did not however describe either the “impregnation” mechanism or the samples themselves.
Precious metals
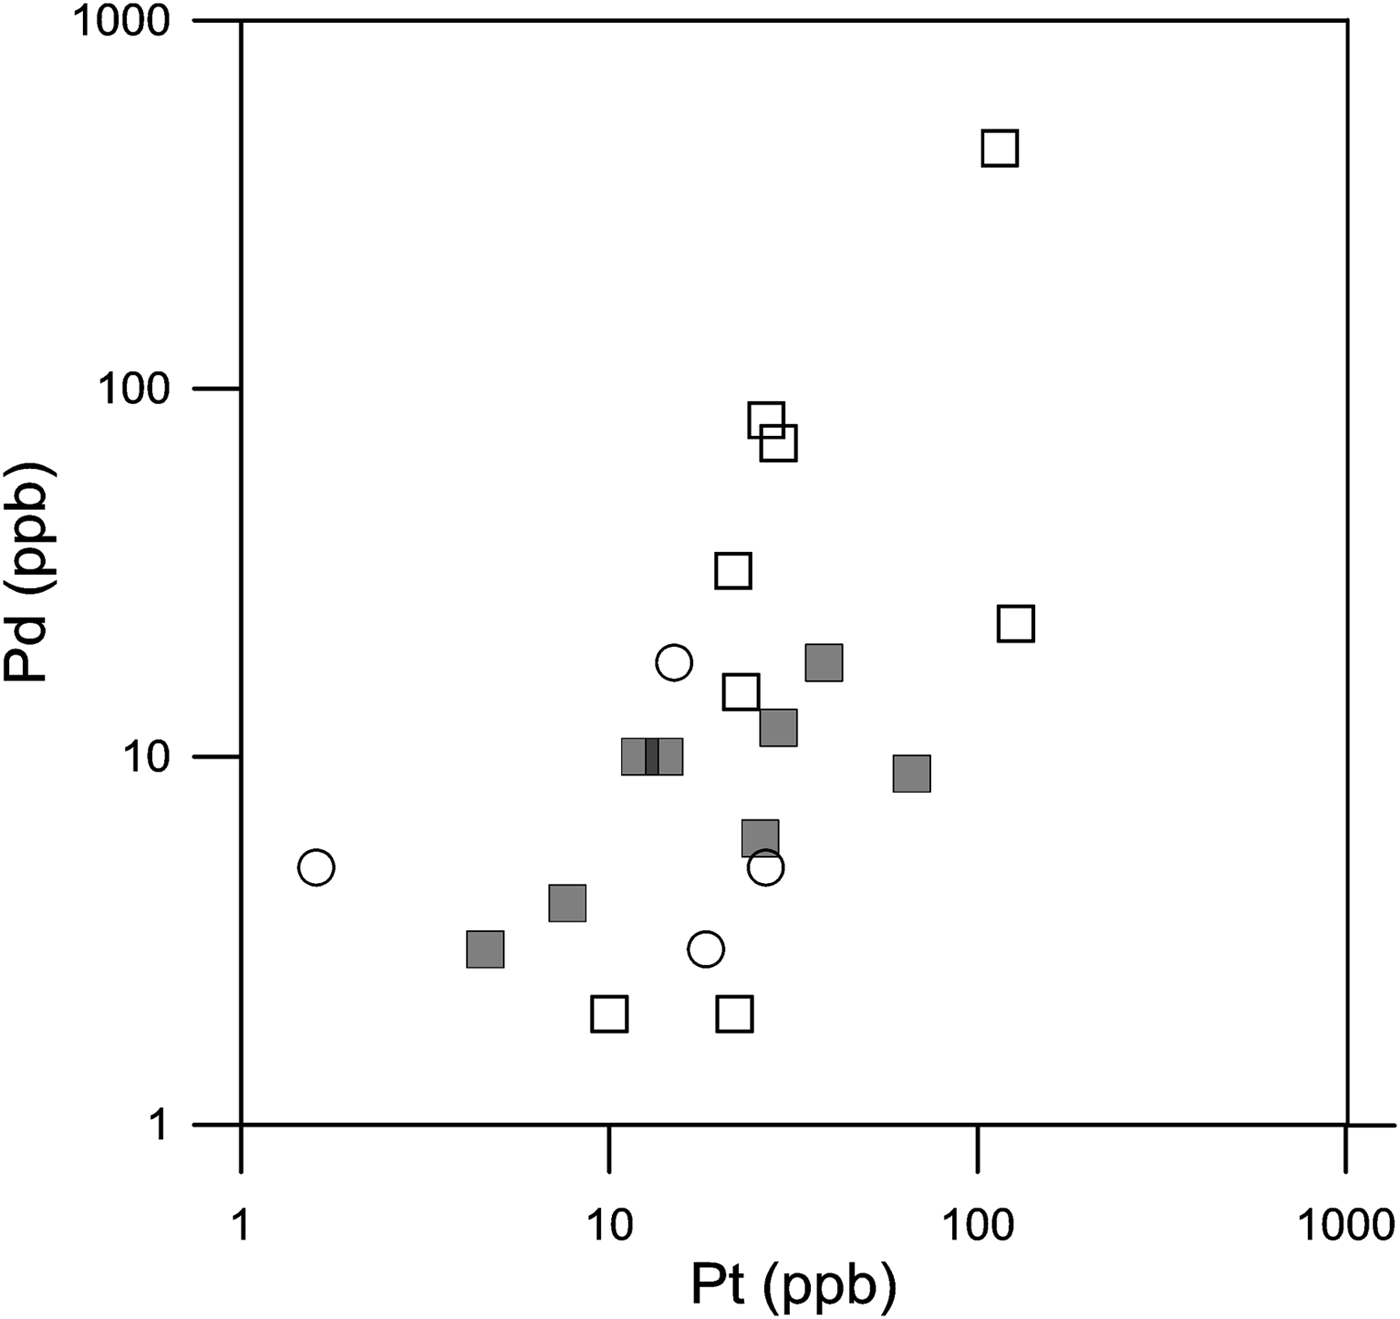
Gold is below the detection limit of 1 ppb in most samples whereas Pt ranges from 2 to 127 and Pd from 2 to 82 ppb with an exceptionally high value of 450 ppb for Sample KK22 (Table 1). There is a rough correlation between Pt and Pd (Fig. 13) but the PGE content does not seem to be related to the mafic character of the sample. This correlation reflects the occurrence of Pt–Pd minerals in various proportions. Note that the PGM-rich samples were not analysed for PGE because they were discovered afterwards.
Pt–Pd correlation diagram for selected samples of the three units of the Conakry Igneous Complex. Key as in Fig. 9.

Mineralization
PGM and sulfide mineralogy
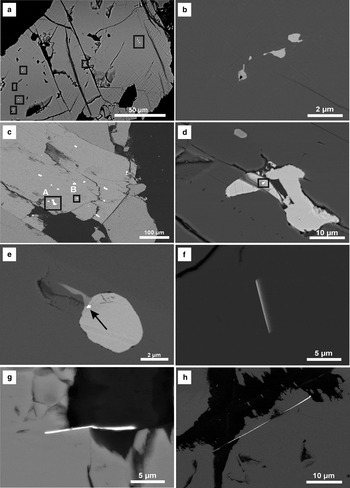
Disseminated BMS are found in various proportions in the three units of the complex and in all facies; they have been found in higher proportion closer to the ‘gossan locality’ (Fig. 1c). They occur either as inclusions in the silicates (Figs 14a,c), locally along cleavages in clinopyroxene, or form small composite ‘blebs’ (<100 µm, Figs 15c,d). Where they are more abundant (they never exceed 5 vol.% of the rock in the samples collected), they are generally interstitial with respect to euhedral silicates but tend to be distributed homogeneously. In order of decreasing abundance, we found chalcopyrite, pyrrhotite, pentlandite and rare pyrite. Traces of millerite and mackinawite are observed in chalcopyrite-pyrrhotite-pentlandite assemblages. Galena and sphalerite rather occur as disseminated tiny inclusions in silicates.
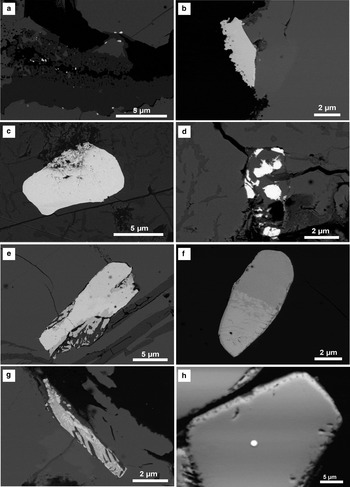
Back-scattered scanning electron microscope images showing the PGM and their host minerals (BSE mode). Analysis numbers refer to Table 2. (a) Large chalcopyrite grain containing small blebs of PdSn minerals (in black squares). Sample KK22. (b) Detail of (a) showing a cluster of anhedral paolovite (Anal. 44). (c) Large euhedral clinopyroxene with BMS inclusions in cleavage. Sample KK63. (d) Detail of (c) (square A) showing a pentlandite grain containing a laurite inclusion (in square). (e) Detail of (c) (square B) showing a pentlandite grain containing an undetermined (Pd,Pt)(Te,Bi) inclusion (arrow). (f) Lath of an undetermined PtTe mineral in pentlandite. Sample KK94. (g) Lath of an undetermined PtPdTe mineral in pentlandite and silicate. Sample KK94. (h) Lath of an undetermined PtTe mineral in pentlandite and silicate. Sample KK100.

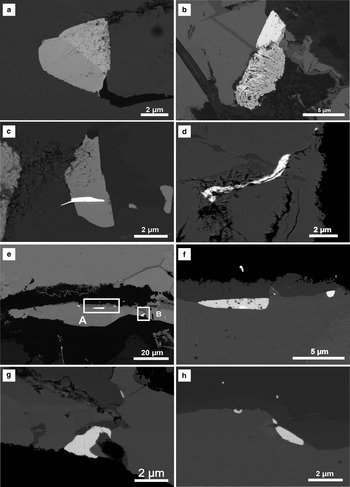
(a) Two-phase grain (michenerite with variable Te/Bi ratios) included in pyrrhotite. Sample KK94 (Anal. 37, grey area). (b) Complex grain of moncheite (white) and an apparently altered mineral of a composition close to michenerite. Sample KK 94 (Anal. 35, white area). (c) Michenerite partly included in pyrrhotite. Sample KK94 (Anal. 42). (d) Apparently altered undetermined PdBiTe grain in a fractured assemblage of BMS. Sample KK94. (e) BMS enriched in PGM. Sample KK95-2. (f) Detail of image (e) (rectangle A) showing a large undetermined (Pd,Pb)Te grain (Anal. 20). (g) Detail of image (e) (rectangle B) showing an undetermined (Pd,Pb)Te grain (Anal. 21). (h) Small PGM located at the periphery of BMS grain. Sample KK95-2.

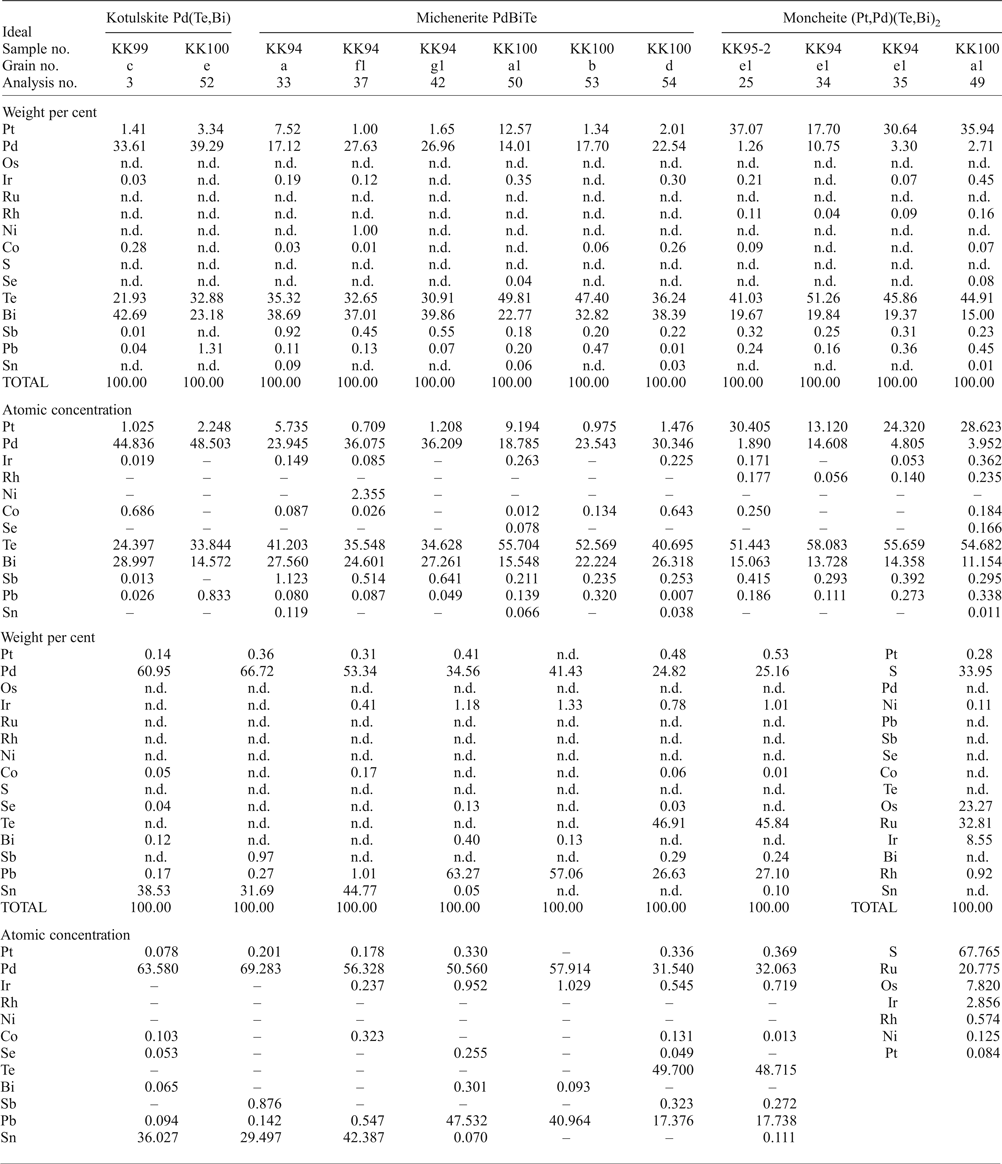
Selected compositions from electron microprobe analyses of platinum-group minerals from the Conakry Igneous Complex.

n.d. – not detected.
In view of previous exploration work describing a PGE enrichment associated with submassive BMS sulfides, we focused our attention on samples containing BMS and more specifically on BMS grains. PGM were found in all six samples investigated.
Platinum-group minerals were first identified and qualitatively analysed using a HIROX SH-3000 SEM, equipped with an EDS BRUKER-Nano. Detailed images were acquired using a Tescan MIRA III XMU low-vacuum Field Emission Scanning Electron Microscope (FE-SEM), equipped with a YAG-scintillator back-scattered electron (BSE) detector.
In a second stage, PGM were searched for systematically in BMS-free peridotites from Units 1 and 2, using the Tescan SEM to check for possible occurrences of PGM not associated with BMS (as described by Bowles et al., Reference Bowles, Prichard, Suarez and Fisher2013 in the Freetown Layered Complex). Results were negative. We also searched for detrital PGM in rivers draining the southern flank of the Conakry Igneous Complex. Results were negative in terms of alluvial grains, but we found a laurite grain included in a chromite crystal, exhibiting a typical habit (Fig. 16h).
(a) BMS enriched in PGM (white spots). Sample KK 95-2. (b) Large paolovite at the contact between chalcopyrite and silicate. Sample KK95-2 (Anal. 22). (c) Large moncheite (apparently locally altered) in pentlandite. Sample KK 95-2 (Anal. 25). (d) Plumbopalladinite grains in fractured BMS. Sample KK 95-2 (Anals.29, 30). (e) Complex grain of kotulskite composition in fractured pentlandite. Sample KK 99 (Anal. 3). (f) Complex PGM grain of michenerite and moncheite association included in pyrrhotite. Sample KK 100 (Anal. 50, grey zone, michenerite, Anal.49, moncheite). (g) Complex grain of michenerite composition in a fractured pyrrhotite. Sample KK 100 (Anal. 53). (h) Small laurite included in a euhedral chromite crystal obtained by panning (Anal. 55).

All the PGM grains are attached to or included in BMS. Their morphology is variable from very thin laths suggesting exsolution from the sulfide (Figs 14f,g,h) to subhedral shapes (Figs. 15e,f,g,h and 16f). More commonly they exhibit irregular morphologies (Figs 15a and 16d), and some PGM show evidence of intergrowth or exsolution (Figs. 15a,b and 16c,e,f,g). Alteration features are also observed, generally when the PGM grain is in a fracture within the host sulfide (Fig. 15d), or at a silicate contact (Fig. 16b).
Platinum-group minerals were analysed by EPMA (Table 2). Arsenic, Au and Hg were not detected. Owing to the very small size of the PGM (commonly smaller than the analysed spot), their complexity (alteration, narrow association of multiphase grains) and their occurrence as inclusions in other minerals (BMS, chromite and silicate/BMS contacts), the raw analytical data obtained had to be corrected. Moreover, when EPMA analyses were not possible, mineral compositions were only qualitatively established using an SEM equipped with an EDS detector.
The correction consisted of removing from the raw analytical data the elements believed to come from the host (for example S, Fe, Cu for PGM included in chalcopyrite). The corrected composition was then recalculated to 100% and the structural formula calculated from the corrected composition. This empirical method is validated by the good stoichiometric compositions obtained for most PGM. Table 2 gives the recalculated compositions in wt.% and atomic concentration.
Most of the PGM identified are Pd–Pt minerals; none are PGM sulfides (with the exception of rare laurite).
Pd–Sn minerals
Three Pd–Sn grains were analysed, two adjacent to BMS, ~6 µm x 2 µm in diameter (Sample 95-2, see Fig. 16b, Anal. 22), the third corresponding to a cluster of very small grains (<1 µm) in chalcopyrite (Sample 22, Figs 14a,b, Anal 44). Cabri (Reference Cabri and Cabri2002) gives two Pd–Sn minerals: atokite (Pd3Sn) and paolovite (Pd2Sn). Recalculated analyses indicate a composition close to paolovite for all the compositions obtained (Table 2). Paolovite and atokite are relatively common in PGE mineralization associated with BMS, and both are often described as intergrowths.
Pt–Pd–Te–Bi minerals
Among the common PGM having (Pt,Pd) as metal and (Te,Bi) as ‘metalloid’ we may distinguish the ratios one-to-one (Pt,Pd)(Te,Bi) and one-to-two (Pt,Pd)(Te,Bi)2 with usually a solid solution for both (Pt,Pd) and (Te,Bi); the end-members being for example kotulskite PdTe, polarite PdBi, moncheite PtTe2, merenskyite PdTe2, insizwaite PtBi2, michenerite PdBiTe and maslovite PtBiTe. Among the analyses obtained, we have distinguished two types of composition: Pd > Pt and Pt > Pd. For the first category, Pd-rich, we obtained two types of composition: (Pd,Pt)(Te,Bi)2, where the Te/Bi ratio is very variable, and a composition close to (Pd,Pt)(Te,Bi), again with large variations in the Te/Bi ratio. The first has been attributed to michenerite and the second to kotulskite (Fig. 16e, Anal. 3, Table 2). The Pt-rich composition corresponds mainly to (Pt,Pd)(Te,Bi)2 (moncheite), where Te is systematically higher than Bi. A second composition close to (Pt,Pd)2(Te,Bi), does not seem to correspond to any defined mineral. In some cases Pd–Te–Bi minerals occur as a two-phase assemblages with Pt–Te–Bi minerals (Fig. 16f, Grain a1, Fig. 15e, Fig. 16g) but each phase is generally too small to be accurately analysed and in some cases they seem to form a symplectite. Moreover under the SEM some PGM seem to have undergone a late alteration which may have affected the (Pt + Pd)/(Te + Bi) ratio, explaining the poor stoichiometry for some compositions. Tin-bearing PGM as well as Sb in solid solution in PGM seem to be characteristically absent in the PGM of the Conakry Igneous Complex assemblages. Pt–Pd–Te–Bi minerals are very common in Cu–Ni sulfide deposits worldwide, and kotulskite is often described in intergrowths with moncheite and michenerite (Cabri, Reference Cabri and Cabri2002).
Pd–Pb minerals
Two different Pd–Pb minerals have been identified in the Conakry Igneous Complex, both included in pyrrhotite. After removing the sulfide contribution, the first (Anal. 29, 30, Fig. 16d) appears to be a Pd–Pb alloy (with up to 1.3 wt.% Ir), with the formula Pb2.90Ir0.05Pb2.05, close to the ideal Pd3Pb2 of plumbopalladinite. The second PGM (two occurrences, Figs 15f,g, Anal. 20, 21) has a less common composition. After subtraction of the host BMS contribution, the following formula is obtained: (Pd0.314Pb0.173Ir0.005)0.492Te0.494, which could correspond to a composition of the type (Pd,Pb)Te, (Table 2) either an unnamed species or a Pb-rich kotulskite, described in many deposits, such as Noril'sk-Talnakh (Vymazalová et al., Reference Vymazalová, Laufek, Sluzhenikin and Stanley2017) or Lac des Isles Complex (Djon et al., Reference Djon, Olivo, Miller, Peck and Joy2017). The three minerals were found in the same sample (KK95-2). Pd–Pb minerals are fairly uncommon in PGE mineralization. Plumbopalladinite has been described in sulfide ores from the Noril'sk area (Sluzhenikin, Reference Sluzhenikin2011) but also in the Merensky Reef and at Stillwater in chromite layers (Prichard et al., Reference Prichard, Barnes, Fisher, Pagé and Zientek2017). Other possible PdPb minerals in similar contexts are urvantsevite Pd(Bi,Pb)2,known at Noril'sk, and zvyagintsevite Pb3Pb, described from many localities (see Cabri, Reference Cabri and Cabri2002).
Ru–Os sulfides
Two laurites were found; one occurs as a very small inclusion (too small for EPMA analysis) in a pyrrhotite grain, itself included in a large pyroxene (Sample KK 63, Fig. 14d), the second is included in a chromite crystal collected by panning stream sediments to search for PGM. This laurite is small and has the same composition and habit as the laurites traditionally included in chromite (Fig. 16h). The recalculated composition gives ~32.8 wt.% Ru and 23.3 wt.% Os, corresponding to the following formula: (Ru0.622Os0.234Ir0.086Rh0.017Pt 0.001)S2.030.
Base-metal sulfides
Analyses of the magmatic BMS using EPMA gave ideal stoichiometric compositions for chalcopyrite and pyrrhotite. Pentlandite shows relatively heterogeneous Co content, which remains low (between 0.7 and 2.2 wt.%) and in some cases relatively high concentrations of Cu (up to 4.4 wt.%). This mineral assemblage, its mode of occurrence and the mineral compositions are fully consistent with a magmatic origin for the sulfides. Locally the BMS assemblage shows evidence of late alteration, with millerite replacing pentlandite and rare occurrences of secondary native Cu in serpentinized samples.
Discussion
Geometry and crystallization processes
The former description of a “layered complex” (Barrère, Reference Barrère1959) is based: (1) on the observation of an inferred mineral layering, deduced from systematic occurrence of low-angle fractures dipping towards the centre of the Conakry Igneous Complex on either side of Mount Kakoulima; and (2) on geological mapping. These low-angle fractures in the Conakry Igneous Complex have been misinterpreted as a magmatic layering and obviously cannot be used to define the geometry of the Conakry Igneous Complex. Indeed, these fractures, filled by secondary minerals, are supergene in origin. These fractures are located at the bottom of the weathering profile. The existence of paleosurfaces and associated strong weathering profiles in Guinea are well established, e.g. Chardon et al. (Reference Chardon, Chevillotte, Beauvais, Grandin and Boulangé2006). The weathering process affects all the surface of the Conakry Igneous Complex which is composed mainly of ferralitic crust and saprolite. Fresh rock outcrops are mainly restricted to streams and cliffs where the weathering profile has been eroded. As it has been demonstrated that the bottom of a weathering profile in cropping out weathered magmatic massifs is constituted by a horizon of low-angle fractures (the fissured layer, e.g. Lachassagne et al., Reference Lachassagne, Wyns and Dewandel2011), all of these fractures, filled by secondary minerals, are supergene in origin and do not define a magmatic layering.
The Conakry Igneous Complex exhibits a very elongated shape, ~55 km by 5 km with a NW–SE extension. This, together with its morphology, suggests a dyke-like structure (see cross-section Fig. 1d), in agreement with inversions from gravity and magnetic surveys (Ponsard, Reference Ponsard1984; Ponsard et al., Reference Ponsard, Roussel, Villeneuve and Lesquer1988).
Absence of mineral layering in large ultramafic intrusive bodes is not common, but provides valuable information on the magmatic processes and magma emplacement. It is for example a characteristic feature of Alaskan-type complexes, where the ultramafic units (dunite and wehrlite), which have a uniform mineral composition, are interpreted as an accumulation of olivine and minor chromite from a mafic magma in an open system in a vertical cylinder (Augé et al., Reference Augé, Genna, Legendre, Ivanov and Volchenko2005). Accumulation of olivine (and minor chromite and pyroxene) in a continuously refilled system with the partial or total removal of liquid by a filter-press process may easily lead to the formation of isotropic – non layered – rocks with almost no (or only local) variation in mineral composition, as observed in the Conakry Igneous Complex.
This dyke seems to be emplaced along a lineament that was re-used several times during the Mesozoic (see Bertrand and Villeneuve, Reference Bertrand and Villeneuve1989), at least during the upper Trias (Conakry Igneous Complex emplacement) and the middle Cretaceous (Los syenite emplacement). Like a dyke, the complex does not exhibit any mineral layering and is composed of several intrusive units. Accordingly, the Kakoulima complex cannot be a layered complex (Barrère, Reference Barrère1959) or a laccolithic intrusion (Deckart et al., Reference Deckart, Bertrand and Liégeois2005).
Mineral chemistry suggests that both Units 1 and 2 were derived from closely similar liquids, Unit 2 having only a slightly more evolved composition. The large variations recorded in whole-rock geochemistry mainly reflect the varying proportions of liquids trapped in the cumulate (higher in Unit 2) and are not indicative of a fractionation process. Most of the liquid from which Units 1 and 2 were derived must have been expelled from the dyke.
The gabbro unit is characterized by a lack of cumulate texture, and a differentiation process recorded both in the mineral chemistry and in the whole-rock composition. In contrast with Units 1 and 2, we have geological evidence that the upper part of the gabbro unit (partly intruding the Ordovician sandstones) corresponds to the top of the magmatic system. Thus emplacement of the gabbro would have occurred at a subsurface level, involving a rapid cooling. This implies an evolution in a closed system (contrary to Unit 1 and 2), explaining the differentiation trends. Although there is a possible geochemical continuity between Units 2 and 3, the field relationships show clearly that Unit 3 is intrusive into Units 1 and 2.
Deckart et al. (Reference Deckart, Bertrand and Liégeois2005) observed that the “ultramafic (wehrlite) cumulates” from Kakoulima share common REE patterns with “mixed features” of Guinea tholeiite and Kakoulima gabbro cumulates. They therefore concluded that the ultramafic cumulates contain “significant amounts of trapped liquid” and thus are “impregnated cumulates”. This conclusion is questionable because, apart from a slight REE enrichment in this wehrlite, they did not mention any other effect of this possible impregnation. As described above, most wehrlites (Unit 2) contain a certain amount of trapped liquid that crystallized as intercumulus and we have no evidence of an impregnation process from an external source. The REE patterns obtained here for the Kakoulima gabbro (Unit 3) are in agreement with the data of Deckart et al. (Reference Deckart, Bertrand and Liégeois2005). Some evolved differentiated facies of Unit 2 show REE patterns similar to the gabbro, whereas the REE contents in Unit 1 are flat.
With an Fo content of 84.8, the least evolved dunite of the Conakry Igneous Complex has a composition suggesting derivation from an evolved magma, i.e. one having already undergone a certain amount of fractional crystallization. Thus the mineral compositions of Units 1 and 2, and the relatively high degree of differentiation for Unit 3, suggest the existence of a deeper magma chamber where a first stage of differentiation may have taken place.
Mineralization
Over the past 20 years, Mount Kakoulima has been explored for Ni–Cu–PGE mineralization. Drilling in a gossan zone revealed a ‘submassive sulphides layer’, 100 m x 100 m and 0.8 m thick, with up to 3.6% Ni, 1.1% Cu and 2 to 4 ppm Pt + Pd (SEMAFO Inc, 2001; Konaté and Pan, Reference Konaté and Pan2013). Various company reports and the location of the boreholes indicate that the target was a mineralized layer (reef) in the so-called ‘transition zone’ of Barrère (Reference Barrère1959), just below the gabbro unit. Obviously this model was not adequate. The submassive Ni–Cu–PGE mineralization occurs very close to the edge of the complex in Unit 2a (misinterpreted as the transition zone), in dykes or digitations intruding the host sandstone, suggesting a ‘contact type mineralization’, e.g. Peck et al. (Reference Peck, Keays, James, Chubb and Reeves2001). Sulfide saturation was probably caused by host contamination with incorporation of Si from the host rock (Maier et al., Reference Maier, Barnes and Li2001). Such a process is supported by the abundance of BMS at the roof of the gabbro unit, where sandstone xenoliths are abundant.
Disseminated BMS are found in various proportions in all facies, and in most cases they account for much less than 1% of the rock. Higher proportions (up to 5%) have been collected near the gossan area in facies of Unit 2, and also in the most differentiated gabbro. The BMS assemblage is totally compatible with a magmatic assemblage. The PGE content has not been investigated fully. However PGM were found in all the BMS-bearing samples investigated and are everywhere associated with the BMS confirming collection of Pt, Pd by a sulfide liquid. The characteristic of the Conakry Igneous Complex PGM, described for the first time here, is to be dominated by (Pd,Pt)(Te,Bi) minerals with rare Pd,Sn and Pd,Pb compositions. Most grains show apparent alteration and complex exsolutions. The absence of Pt,Pd sulfides and of Pt,Pd antimonides is noticeable in this environment. Interestingly, laurite occurs as inclusions in chromite crystals, as it commonly does in ophiolite chromite or in chromite from layered intrusions.
Comparison with the Freetown Layered Complex
The Conakry Igneous Complex belongs to the Central Atlantic Magmatic Province (CAMP), associated with the early stage of Central Atlantic rifting, estimated at 200 Ma, like the numerous and voluminous diabase dykes in Guinea and the neighbouring Freetown layered complex in Sierra Leone (radiometric age 193 Ma, Beckinsale et al., Reference Beckinsale, Bowles, Pankhurst and Wells1977 and between 196.3 ± 3, and 232.1 ± 9 Ma Barrie et al., Reference Barrie, Wijbrans, Andriessen, Beunk, Strasser-King and Fode2010). The emplacement of the Freetown Complex has been related to both Atlantic Ocean opening and a mantle plume activity (Bowles et al., Reference Bowles, Prichard, Suarez and Fisher2013). The high Ti content in Conakry Igneous Complex chromite, typical of mantle melts related to mantle plume activity (Pagé and Barnes, Reference Pagé and Barnes2009), suggests a common origin for the two complexes.
Located ~130 km to the South, the Freetown Layered Complex is described as a 60 km long, 14 km wide tholeiitic intrusion with a lopolithic shape (Umeji, Reference Umeji1983). The portion of the complex on land consists of a 6.5 km thick sequence dipping to the west, with an apparent centre or top of the intrusion well out to sea, so that the exposed rocks comprise less than half of the total sequence.
In contrast to the Conakry Igneous Complex, the Freetown Complex is well and rhythmically layered (Chalokwu et al., Reference Chalokwu, Seney, Wurie and Bersch1995 described it as having “impressive” modal and grain-size layering), and does not exhibit ultramafic units but rather sequences of troctolite, olivine gabbro, gabbronorite, gabbro and anorthosite.
Oxygen isotopic and Sr-Nd isotopic studies (Chalokwu and Ghazi, Reference Chalokwu and Ghazi1995, Chalokwu et al., Reference Chalokwu, Ripley and Park1999; Hattori and Chalokwu, Reference Hattori and Chalokwu1995) provide evidence for magma recharge by magma injection with mixing of new and evolved resident magmas within the magma chamber. Chalokwu and Seney (Reference Chalokwu and Seney1995) and Bowles (Reference Bowles2000b) describe changes in the progress of crystallization at certain horizons, indicative of new inputs of magma. These horizons are marked by a sharp increase in Mg content but also by abrupt changes in the trace element (Ni, Cr, Cu, Co) content, in silicate mineral compositions, and in their mineral proportions (Bowles, Reference Bowles2000b).
The Freetown Complex has been divided into four zones on a “stratigraphic” basis (Wells, Reference Wells1962), corresponding to a succession of magma recharges, as these four zones correspond to different magma compositions (Chalokwu, Reference Chalokwu2001). The variation in rock type is due mainly to variations in the proportions of olivine, plagioclase and pyroxene and to variations in mineral grain size (Bowles, Reference Bowles2000b). There is little progressive or systematic variation in mineral composition throughout the complex. Sulfides are rare, small and disseminated.
All the facies described in the Freetown Complex are found in the gabbro Unit 3 of the Conakry Igneous Complex. Conversely, the ultramafic facies largely dominant in the Conakry Igneous Complex are absent from the Freetown Complex. In terms of mineral composition, olivine from the Freetown Complex ranges from Fo 75 to Fo 56. By comparison, gabbro from Unit 3 of the Conakry Igneous Complex ranges between Fo 81.6 and Fo 71.0.
The presence of alluvial PGM in streams draining the Freetown Complex was known in 1928, when artisanal production of Pt was described (Pollett, Reference Pollett1931). The alluvial PGM was found to consist of Pt–Fe alloys (isoferroplatinum, Pt3Fe), with rare laurite, erlichmanite, tulameenite and Os–Ir alloys (Bowles, Reference Bowles1981), often included is Pt–Fe nuggets. At that time, the primary source of the alluvial PGM was unknown. Exploration work for primary Pt occurrences is described in Bowles (Reference Bowles2000b) with mention of anomalous Pt levels (0.01 to 0.4 g/t) in “pyroxene troctolites” corresponding to Pt-bearing horizons following the magmatic layering. These horizons are marked by elevated values of Pt, Pd, Cu, Cr and Ni and are accompanied by a change in plagioclase composition assumed to reflect the introduction of fresh magma. At some localities, a weathered sulfide mineralization is mentioned, with relict chalcopyrite and pyrrhotite and fine (up to 20 µm) PGM grains (Bowles, Reference Bowles2000b).
More recently, primary PGM have been reported in magnetite-bearing gabbro from the Freetown Complex (Bowles et al., Reference Bowles, Prichard, Suarez and Fisher2013) in four layers (or “horizons”) characterized by a local, more primitive composition of the silicate assemblage, and elevated PGE and base-metal contents. The PGM are described as irregularly distributed and locally altered.
Platinum-group mineral assemblages are found mainly interstitial to olivine, pyroxene and plagioclase, frequently at the edges of amphiboles or in interstitial sites associated with amphibole, chlorite or quartz. In some cases, PGM occur either attached to magnetite grains included in late magmatic amphibole or near the margins of chalcopyrite or pentlandite. According to Bowles et al. (Reference Bowles, Prichard, Suarez and Fisher2013), the four horizons where PGM have been found correspond to four compositionally distinct magma pulses. The association with magnetite and Cu-rich BMS is interpreted as representing late sulfur saturation in the magma after Ni has been removed by incorporation into olivine.
There are some major differences in PGE mineralization between the Conakry Igneous Complex and the Freetown Complex. In the latter, 50% of the PGM are included in silicates (either interstitial to primary silicates or included in later silicates (amphibole, chlorite), and only 35% in sulfides (mainly chalcopyrite), the remainder being included either in magnetite or in magnetite-sulfide assemblages. Most of the PGM in the Conakry Igneous Complex are included in BMS, some near the margins of the sulfide grains. In terms of mineral composition Pt–Fe alloys and cooperite represent respectively 70% and 20% of the Freetown Complex PGM, whereas neither has been found in the Conakry Igneous Complex. Both have in common their very small grain size. In the Freetown Complex the nature of the PGM varies from one horizon to another, two being dominated by Pd-PGM.
Conclusion
The model we propose considers the Conakry Complex to be a polyphase dyke through which the magma was passing and dynamically depositing olivine pyroxene and chromite. Pressure in the system leading to the removal of interstitial liquid and the formation of adcumulates (‘filter press process’) will result in Unit 1 type facies. Further injection of a slightly more differentiated magma will produce the pyroxene-bearing facies of Unit 2. A third magma injection will lead to the third unit, Unit 3 corresponding to a more evolved composition. Unlike Units 1 and 2, Unit 3 apparently evolved in a closed system, emplaced near the surface of the intrusion. We have no evidence of a genetic link between the three units. It is clear however that the less evolved composition (Unit 1) does not correspond to a directly mantle-derived magma but most probably arises from a liquid having undergone a certain degree of differentiation in a lower magma chamber. The geometry of the system and the dynamics of its mineral accumulation explain the absence of mineral layering, in contrast to other intrusions in similar contexts, such as the Freetown Complex.
PGM in the Conakry Igneous Complex are everywhere associated with BMS. The most abundant concentration of Ni–Cu–PGE sulfides has been identified near the edge of the complex, probably corresponding to a ‘contact type mineralization’, combining the effects of accumulation of dense sulfides in a conduit and assimilation from the host.
Acknowledgements
We thank Dr Cissé, Directeur National de la Géologie, Ministère des Mines et Géologie. Guinea, and the DNG staff for help and support during the study. We also thank J.F. Labbé and J.L. Lasserre for technical support during the fieldwork and G. Wille for the EPMA. We wish to dedicate this work to Hazel Prichard in memory of our first meeting in the Sultanate of Oman in 1981, the earliest of so many friendly and rewarding encounters.
We also thank S.-J. Barnes and an anonymous reviewer for their constructive comments. A special thanks to our friend John Bowles for his encouragement all along this work and more. The English text was edited by J.V. Guy-Bray.
Supplementary material
To view supplementary material for this article, please visit https://doi.org/10.1180/mgm.2018.79