


Introduction
The stability of the West Antarctic ice sheet is closely linked to the position of sea-level at its margin (Reference WeertmanWeertman, 1974; Reference Thomas and BentleyThomas and Bentley, 1978 [b]). Reference HollinHollin (1962), among others, has suggested that the sea-level rise resulting from disintegration of the large late-glacial ice sheets of the Northern Hemisphere caused the Antarctic ice sheet to retreat to its present position. The position of sea-level relative to the ice is, of course, a function of the geoid distortion and solid-earth deformation associated with the changing mass of the retreating ice sheet, as well as of the simple rise of eustatic sea-level. Relative sea-level, and the stability of the West Antarctic ice sheet, are thus dependent upon the change in the mass of the ice sheet, the eustatic rise of sea-level, and the rheology of the Earth. Here we use a preliminary reconstruction of the 18000 years b.p. Antarctic ice sheet done by Reference Hughes, Hughes, Denton, Andersen, Schilling, Fastook, Lingle, Denton and HughesHughes and others (in press) to determine the volume of the Antarctic ice sheet that was in excess of the present ice sheet, and which thus contributed to eustatic rise of sea-level and a changed configuration of Earth loading when the ice sheet retreated to its present size (Fig. 1). These results are incorporated into a model of Earth deformation from surface loads that ultimately predicts global changes of relative sea-level as a function of deglaciation (Reference Farrell and ClarkFarrell and Clark, 1976). We interpret the Holocene history of the West Antarctic ice sheet in terms of these calculated relative sea-level changes at the ice margin.
The Antarctic ice sheet at present.

Antarctic Reconstruction
The 18000 years b.p. Antarctic ice sheet has been reconstructed by Reference Hughes, Hughes, Denton, Andersen, Schilling, Fastook, Lingle, Denton and HughesHughes and others (in press), through numerical solutions of the equations of flow for ice along flow lines. The ice-sheet margin (or grounding line) was assumed to coincide with the 500 m depth contour near the edge of the continental shelf. Flow lines were hypothesized in accordance with available geological evidence. Bedrock elevations at discrete intervals along each flow line were obtained from available maps, and elevations of the present ice sheet, at the same intervals, were also included as input data. Model output included total ice thickness at either 100 or 50 km intervals along flow lines, thickness in excess of the thickness of the present ice sheet, elevation of the reconstructed ice surface with respect to present sea-level, and the elevation of the depressed bed with respect to present sea-level. The reconstructed ice sheet was assumed to be in isostatic equilibrium, and the effect of additional bed depression on the profile of the 18000 years b.p. ice sheet (Reference WeertmanWeertman, 1961) was taken into account.
Ice Contributing to Eustatic Sea-Level Rise
The mass of the 18000 years b.p. Antarctic ice sheet which contributed to a rise of eustatic sea-level when retreat occurred was the portion which exceeded the dimensions of the present ice sheet, and was either above present sea-level or below the present ice-sheet bed. Figure 2 shows a hypothelical section of the ice sheet which is grounded below sea-level, and which terminates as a floating ice shelf. G1 is the present grounding line and G2 is the assumed 18000 years b.p. grounding line. Seaward of G1 the reconstructed surface is below the present ice-sheet surface, because sea-level at 18000 years b.p. was lower than at present. Seaward of S the reconstructed profile is below present sea-level;Footnote * grounded ice within this area actually contributed to a slight drop of eustatic sea-level during deglaciation, because of the density difference between ice and water. (This effect is neglected.) Seaward of G2, floating ice contributed neither to an increase nor a decrease of eustatic sea-level.
A hypothetical section of the Antarctic ice sheet which is (and was) grounded below sea-level, and which terminates as a floating ice shelf. (Floating ice seaward of G2, was not included in the 18000 years b.p. ice-sheet reconstruction.) Ice thickness hb contributed to a rise of eustatic sea-level when the ice sheet retreated to its present size, as did hs, because the depressed bed rose to its present position between 18000 years b.p. and the present.

At points inland of S, the total depth of the 18000 years b.p. ice column is
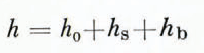
where h 0 is the present ice thickness, h s is the difference in elevation between the reconstructed surface and the present surface, and h b is the vertical distance between the present ice-sheet bed and the isostatically depressed bed of 18000 years b.p. The ice thickness which contributed to a rise of eustatic sea-level when the ice sheet retreated to its present size is

Figure 3 is a contour map of h e in Equations (2). This map was derived from a preliminary reconstruction of the 18000 years b.p. Antarctic ice sheet which was judged by Denton and Hughes to be too thick in some areas of the interior, particularly over the West Antarctic dome and in some areas of East Antarctica. A revised reconstruction, judged to be more in accord with available data, has been completed (Reference Hughes, Hughes, Denton, Andersen, Schilling, Fastook, Lingle, Denton and HughesHughes and others (in press)). Excess ice thickness shown in Figure 3 was used, however, as a starting point for this sea-level study. (The volume of the revised reconstruction was found to be within the error limits of the preliminary version, so substitution of the latter would probably cause negligible change in the sea-level results described here.) Interpolation between calculated values at 100 or 50 km intervals was used to plot thickness-change values which were multiples of 500 m along each reconstructed flow line. The contour map was drawn by connecting these points with smooth curves. Areas seaward of a 0 thickness-change contour, but inland of the ice-sheet margin, are equivalent to the segment of 18000 years b.p. ice sheet between points S and G2 in Figure 2. No attempt was made to represent 18000 years b.p. floating ice shelves.
The portion of a preliminary reconstruction of the 18000 years b.p. Antarctic ice sheet by Reference Hughes, Hughes, Denton, Andersen, Schilling, Fastook, Lingle, Denton and HughesHughes and others (in press) which contributed to a rise of eustatic sea-level, when the ice sheet retreated to its present size (after Reference Clark and LingleClark and Lingle, 1979). The reconstruction used to derive this map was judged too thick in some areas and a revised reconstruction has been completed (Reference Hughes, Hughes, Denton, Andersen, Schilling, Fastook, Lingle, Denton and HughesHughes and others (in press)). Ice thickness shown on this map was used as a starting point for this sea-level study, however. The contours represent ice thickness that exceeded the dimensions of the present ice sheet, and was either above present sea-level or below the present ice-sheet bed. The assumed margin coincides with the 500 m depth contour, near the edge of the continental shelf.

Area and Volume
An accurate means of measuring area was required for determination of ice volume. The American Geographical Society map of Antarctica spans a large latitude range, so the nominal 1 : 5000000 scale factor could not be used. Area distortion was minimized by calculating a planimeter scale factor for each 5° interval of latitude. The area of a segment of the Earth’s surface between two latitude parallels 5° apart and two longitude meridians 10° apart, to an accuracy sufficient for our purposes, is

where R is the radius of the Earth. 5° by 10° areas on the American Geographical Society map of Antarctica were measured with a planimeter, and Equations (3) was used to calculate a scale factor for each latitude interval. The volume of ice represented by the map in Figure 3 was then found by using a planimeter between the contour lines within each 5° interval of latitude.
The volumes between individual latitude intervals were summed over the area of the map. Gross errors were avoided by comparing the sums of areas between contour lines to larger areas, as measured independently. The sum of all areas between contour lines was also compared to the (independently measured) total area of the ice sheet.
Table I shows the result of the volume calculation. The figures are adjusted to reflect revision of the preliminary ice-sheet reconstruction used to derive Figure 3. The eustatic sea-level rise caused by retreat of the West Antarctic ice sheet is greater than the rise caused by retreat of the much larger East Antarctic ice sheet, because the area and thickness change associated with retreat of the East Antarctic ice sheet from the edge of the continental shelf was relatively small. (The edge of the continental shelf is close to the present East Antarctic coast.) The large decrease in West Antarctic ice-sheet volume was caused by the large thickness change associated with extensive retreat of grounding lines through the Ross Sea (Reference Thomas and BentleyThomas and Bentley, 1978[b]) and Weddell Sea since 18000 years b.p. Grounding-line retreat in the Weddell Sea was assumed comparable to retreat in the Ross Sea during the same period, although this assumption is poorly constrained by data at present. The total volume of the 18000 years b.p. Antarctic ice sheet is also shown in Table I. It was calculated in the manner described above, using total thickness values along each flow line, i.e. h in Equations (1) rather than he in Equations (2).

Accuracy of Ice-Sheet Reconstruction
If the dimensions of the 18000 years b.p. Antarctic ice sheet had been reconstructed by numerous investigators working independently, it would be possible to infer the uncertainty of individual reconstructions by noting the variation of the results. Numerous such reconstructions have not been done; however, several reconstructions of the Laurentide ice sheet have recently been completed. Reference Hughes, Hughes, Denton, Andersen, Schilling, Fastook, Lingle, Denton and HughesHughes and others (in press) have reconstructed the Laurentide ice sheet, using the same ice-flow equations used to reconstruct Antarctica. A rough indication of the uncertainty of the Antarctic reconstruction can be obtained by noting the variation of these recent Laurentide ice-sheet reconstructions. A similar uncertainty can be assumed to apply to Antarctica.
Reference PatersonPaterson (1972) found the volume of the Laurentide ice sheet during the late Wisconsin glacial maximum to be 26.5 × 10⁶ km3. Reference SugdenSugden (1977) found the volume of the Laurentide ice sheet during its maximum extent (not necessarily late Wisconsin) to be 37×106 km3. Reference Hughes, Hughes, Denton, Andersen, Schilling, Fastook, Lingle, Denton and HughesHughes and others (in press) found the volume of the minimum probable Laurentide ice sheet at 18000 years b.p. to be 31 × 106 km3, and that of the maximum probable Laurentide ice sheet at that time to be 35×106 km3. Paterson’s volume is less than the mean by 18%; Sugden’s is greater by 14%.
The volume of the present Antarctic ice sheet (including ice shelves) was found to be 24.3 × 10⁶ km3 by Reference Thiel, Wexler, Wexler, Rubin and CaskeyThiel (1962). Bentley (1964) stated that P. A. Shumskiy found the present ice-sheet volume to be (24± 3) × 106 km3. According to Reference Mellor and FairbridgeMellor (1967), the preferred volume estimate is 23 × 106 km3. Reference RadokRadok (1978) quoted a volume of 28 × 106 km3. If the correct value is assumed to lie between the estimates of Mellor and Radok, the volume of the present ice sheet is known to within about ±10%. The uncertainty of the 18000 years b.p. Antarctic ice-sheet reconstruction is greater than the uncertainty of the present ice-sheet volume, and perhaps similar to the uncertainty of recent Laurentide ice-sheet reconstructions, if the margins of Hughes and others are approximately correct. Error limits of ±15% have been assigned to the volume figures in Table I.
Deglaciation
Reference Thomas and BentleyThomas and Bentley (1978 [b]) have calculated several alternative retreat-rates for the West Antarctic ice sheet in the Ross Sea, based on differing assumptions regarding shear stress between ice streams and adjacent ice, and initial isostatic depression. Their results were not complete at the time this study was done, however, so a simple linear retreat history was assumed for all of Antarctica. The map shown in Figure 3 was divided into 174 grid elements, defined by latitude and longitude. Ice within each element was reduced to 0 in 12 discrete 1000 year steps, so the ice sheet attained its present size by 6000 years b.p. This time was chosen because disagreement exists as to whether the volume of the ocean’ increased or decreased during the past 6000 years (Reference BloomBloom, 1970; Reference FairbridgeFairbridge, 1976). Reference Clark, Clark, Farrell and PeltierClark and others (1978) have shown that the apparent discrepancies can be explained by geoid distortions caused by continuing solid-earth deformation, with constant ocean volume assumed during this period. (Reference Thomas and BentleyThomas and Bentley (1978[b]) found that the Ross Ice Shelf was free of grounded ice by about 7000 years b.p., for all alternative retreat models considered by them.)
The Sea-Level Model
The Reference Farrell and ClarkFarrell and Clark (1976) model is a numerical method for computation of the relative sea-level changes caused by re-distribution of ice and water loads on the Earth’s surface, and of rock within the Earth’s mantle. When an ice sheet shrinks or vanishes, the transfer of mass from the ice sheet to the ocean causes distortion of the Earth’s gravitational potential field. In particular, the geoid (the gravitational equipotential surface which coincides with the surface of the ocean) is distorted. Additional geoid distortion is caused by re-distribution of rock within the mantle as the solid Earth deforms in response to the changed configuration of ice and water loads. Thus, the global sea-level changes caused by an episode of either deglaciation or glaciation are complex and non-uniform. Model output is the time-dependent change in separation between the ocean surface and the ocean floor, everywhere. The change in separation between these two dynamic surfaces, at a particular location, is the change in relative sea-level. For detailed discussion see Reference Clark, Clark, Farrell and PeltierClark and others (1978), Reference Farrell and ClarkFarrell and Clark (1976), Reference Peltier and AndrewsPeltier and Andrews (1976), and Reference PeltierPeltier (1974).
Relative Sea-Level Changes—the Ross Sea
Figure 4 shows predicted relative sea-level change caused by Antarctic ice-sheet retreat (alternating dashes and dots), Northern Hemisphere deglaciation (dashed line) and total relative sea-level change (solid line) in the Ross Sea near the edge of the continental shelf (Fig. 1). The solid curve is the algebraic sum of the curves representing the Antarctic and Northern Hemisphere contributions.
Predicted relative sea-level change against time in the Ross Sea, near the edge of the continental shelf. The dashed and dotted curve is sea-level change caused by assumed Antarctic ice-sheet retreat. The dashed curve is sea-level change caused by Northern Hemisphere deglaciation, as previously calculated by Reference Clark, Clark, Farrell and PeltierClark and others (1978). The solid curve represents total relative sea-level change. It is the algebraic sum of the Antarctic and Northern Hemisphere contributions.

The Ross Sea is within Northern Hemisphere sea-level Zone V (see Reference Clark, Clark, Farrell and PeltierClark and others, 1978), as are the Southern Ocean and the Weddell Sea. Within this zone, submergence (rising relative sea-level) is continuous while water is added to the ocean. Northern Hemisphere deglaciation was complete by 5000 years b.p., and solid-earth relaxation is then predicted to have resulted in about 3 m of emergence between 5000 years b.p. and the present.
The edge of the continental shelf is within the Transition Zone, between Zones I and II relative to the Antarctic ice sheet. Here, relative sea-level fell during ice retreat because reduced gravitational attraction of the ice mass caused water to flow away from the shrinking ice sheet, while the sea-floor gradually rose. Later, a pro-glacial fore-bulge migrating toward the reduced ice sheet caused relative sea-level to rise. This occurred at about 8000 years b.p. in Figure 4.
Between 16000 and 13000 years b.p., emergence due to assumed Antarctic ice-sheet retreat dominated; thus, net emergence is predicted to have occurred near the ice margin in the Ross Sea. After 13000 years b.p., submergence caused by ice disintegration in the Northern Hemisphere dominated, so net submergence is predicted to have occurred between 13000 years b.p. and the present.
Figure 5 shows predicted relative sea-level change at Pennell Bank (Fig. 1) between the edge of the continental shelf and the present margin of the Ross Ice Shelf. The grounding line was assumed to retreat such that a floating ice shelf existed here by 12000 years b.p. Calculated sea-level changes begin one model step later, i.e. at 11000 years b.p. This location was also within the Antarctic Zone I to Zone II Transition Zone, so initial emergence due to Antarctic ice-sheet retreat was followed by submergence starting at 7000 years b.p. (dashed and dotted line). Submergence due to Northern Hemisphere deglaciation dominated between 11000 and 5000 years b.p., however, and submergence due to Antarctic ice-sheet retreat dominated between 5000 years b.p. and the present, so net submergence is predicted to have been continuous between 11000 years b.p. and the present.
Predicted relative sea-level change at pennell Bank, between the edge of the continental shelf and the present margin of the Ross tee shelf (solid curve). Alternating dashes and dots: Antarctic contribution; dashed curve: Northern Hemisphere contribution.

Figure 6 shows relative sea-level change near the present margin of the Ross Ice Shelf, at the latitude of McMurdo Sound (Fig. 1). McMurdo Sound is within Antarctic Zone I, where reduced gravitation between the shrinking ice mass and the ocean, combined with isostatic uplift of the sea-floor, caused continuous emergence following removal of the ice. Slight emergence due to Earth relaxation following completion of Northern Hemisphere deglaciation also occurred (dashed line). Net emergence of 25 m since 5000 years b.p. (solid line) is predicted.
Predicted relative sea-level change near the present margin of the Ross Ice Shelf (solid curve). Circles represent (dates from) emerged delta-like features in McMurdo Sound obtained by Reference Denton, Denton, Borns, Grosswald, Stuiver and NicholsDenton and others (1975), and Reference Stuiver, Stuiver, Denton and BornsStuiver and others (1976); the data represent sea-level change minus initial depth to these features. Stuiver and others stated that emergence here after 5400 carbon- 14 years b.p. exceeded 8.1 m. The dates are uncorrected for the deficiency of carbon-14 in Antarctic marine waters and are thus too old by 850–1400 years (Reference Stuiver, Stuiver, Denton and BornsStuiver and others, 1976). Arrows with question marks represent undated raised beaches at McMurdo Sound (20 m; Reference NicholsNichols, 1968), and at Terra Nova Bay (30.5 m; Reference Denton, Denton, Borns, Grosswald, Stuiver and NicholsDenton and others, 1975).

McMurdo Sound is one of the few places on Antarctica where sea-level data are available. Reference Stuiver, Stuiver, Denton and BornsStuiver and others (1976) have dated Adamussium colbecki (Mollusca) in emerged marine deposits at New Harbor, at the mouth of Taylor Valley in McMurdo Sound. The deposits were part of a delta-like feature, so these dates and elevations do not represent change in relative sea-level per se, but rather change in relative sea-level minus initial depth to the surface of the delta. The data are plotted in Figure 6 (circles). Reference Stuiver, Stuiver, Denton and BornsStuiver and others (1976) stated that emergence after 5400 carbon-14 years b.p. exceeded 8.1 m.
Reference Denton, Denton, Borns, Grosswald, Stuiver and NicholsDenton and others (1975) have dated Adamussium colbecki shells in the foreset beds of a delta at South River, near Marble Point (also in McMurdo Sound), at 6 350±60 and 6 430±70 carbon-14 years b.p. The foreset beds appeared to be graded to the local marine limit, 12.5 m above present sea-level. Adamussium colbecki shells, in marine silt layers raised 7.5 m above present sea-level, were dated at 6 050±70 and 5 800±70 carbon-14 years b.p. (These and other dates plotted in Figure 6 are uncorrected for the deficiency of carbon-14 in Antarctic marine waters and are thus too old. Reference Stuiver, Stuiver, Denton and BornsStuiver and others (1976) stated that a correction factor of 850–1400 years b.p. will eventually be applied.)
Raised beaches up to 30.5 m above present sea-level were found at several localities between Inexpressible Island and Campbell Glacier tongue in Terra Nova Bay by Reference Denton, Denton, Borns, Grosswald, Stuiver and NicholsDenton and others (1975). Terra Nova Bay is about 280 km north of McMurdo Sound. In terms of distance from the assumed 18000 years b.p. ice margin, the bay is roughly midway between Pennell Bank and McMurdo Sound. The beaches appeared to be associated with nearby distributions of young drift left by grounded ice from the Ross Sea. Dates were not obtained, however, so the beaches are represented by arrows with question marks in Figure 6.
Reference NicholsNichols (1968) found numerous raised beaches in the McMurdo Sound area; seven were 20 m above present sea-level. These are also represented by arrows with question marks in Figure 6, since dates were not obtained.
If emergence along the coast between McMurdo Sound and Terra Nova Bay was as great as 20–30.5 m since 6000 years b.p., the calculated sea-level curve in Figure 6 is approximately correct. If emergence was closer to 12.5 m, this might indicate that ice thickness in McMurdo Sound at 18000 years b.p. was less than shown in Figure 3.
Figure 7 shows relative sea-level change in the center of the present Ross Ice Shelf. This location is well within Antarctic Zone I; 23 m of emergence is predicted to have occurred during the past 2000 years.
Predicted sea-level change in the center of the present Ross Ice Shelf (solid curve). Alternating dashes and dots: Antarctic contribution; dashed curve: Northern Hemisphere contribution.

Pine Island Bay
North of Pine Island Bay (Fig. 1), the Southern Ocean at lat. 61° S. is within Antarctic Zone II (Fig. 8). Continuous submergence (dashed and dotted line) was caused by addition of water to the ocean, combined with collapse of the pro-glacial fore-bulge during flow of mantle rock toward uplifting areas. Sea-level effects due to northern ice disintegration and Antarctic ice-sheet retreat thus combined to produce about 100 m of submergence between 16000 and 5000 years b.p. About 1.2 m of net emergence between 5000 years b.p. and the present (solid curve) is predicted due to completion of northern deglaciation (dashed curve).
Predicted relative sea-level change in the Southern Ocean, north of Pine Island Bay. Alternating dashes and dots: Antarctic contribution; dashed curve : Northern Hemisphere contribution.

Predicted relative sea-level change within Pine Island Bay (Fig. 9) begins at 5000 years b.p., since grounded ice was assumed to exist there until 6000 years b.p. Pine Island Bay is within the Antarctic Transition Zone. The emergence characteristic of this zone during early stages of deglaciation is not represented, however, because this portion of the curve (dashes and dots) occurred before the assumed disappearance of grounded ice from the bay. Submergence of about 8 m due to Antarctic ice-sheet retreat is partially counteracted by emergence due to northern ice retreat, so net submergence of 5 m is predicted between 5000 years b.p. and the present.
Predicted relative sea-level change in Pine Island Bay, near the present grounding lines of Pine Island and Thwaites Glaciers. Alternating dashes and dots: Antarctic contribution; dashed curve : Northern Hemisphere contribution.

The Weddell Sea
Near the edge of the continental shelf in the Weddell Sea (Fig. 1), pronounced emergence due to Antarctic ice-sheet retreat is predicted to have been largely counteracted by submergence due to Northern Hemisphere deglaciation, so that relative sea-level at 11000 years b.p. was only 2 m lower than at present (Fig. 10). Relative sea-level is predicted to have remained within 6 m of present sea-level since 11000 years b.p., with net submergence of about 5.5 m between 4000 years b.p. and the present.
Predicted relative sea-level change in the Weddell Sea, near the edge of the continental shelf. Alternating dashes and dots: Antarctic contribution; dashed curve: Northern Hemisphere contribution.

The Antarctic Peninsula forms an arc around the Weddell Sea (Fig. 1). Thus, the edge of the continental shelf in the Weddell Sea is much closer to the Zone I side of the Transition Zone than the continental shelf in the Ross Sea, where net submergence is predicted. Pronounced emergence due to assumed early retreat in the Weddell Sea more nearly counteracts submergence caused by northern deglaciation, so Figure 10 is not similar to Figure 4.
In the southern Weddell Sea, near the present grounding line (Fig. 11), about 4.3 m of net emergence is predicted during the past 1000 years. Emergence due to uplift of the Antarctic sea-floor is predicted to have been augmented slightly by emergence resulting from completion of northern deglaciation.
Predicted relative sea-level change in the Weddell Sea, near the present grounding line of the Ronne Ice Shelf. Alternating dashes and dots: Antarctic contribution; dashed curve: Northern Hemisphere contribution.

Discussion and Conclusions
The change in ice volume associated with retreat of the Antarctic ice sheet from its 18000 years b.p. maximum, as reconstructed by Reference Hughes, Hughes, Denton, Andersen, Schilling, Fastook, Lingle, Denton and HughesHughes and others (in press), to its present size suggests that Antarctica may have been the second largest contributor to post-glacial eustatic sea-level rise after the Laurentide ice sheet. The Reference Farrell and ClarkFarrell and Clark (1976) model predicts that a change in ice mass of this magnitude would have caused large non-uniform changes of relative sea-level near the ice margin during retreat. Such changes in sea-level at the grounding line surely affected the stability of the West Antarctic ice sheet. The ice sheet retreated in regions where relative sea-level was rising but retreat slowed and, perhaps, reversed when the grounding line moved to within regions of falling sea-level resulting from isostatic uplift and geoid perturbation.
Reference HollinHollin (1962) first suggested that the extent of the Antarctic ice sheet as a whole might be controlled by sea-level. Reference Bentley and OstensoBentley and Ostenso (1961) found that the West Antarctic ice sheet is grounded mostly below sea-level. Reference WeertmanWeertman (1974) showed that such marine ice sheets are not necessarily stable, and that stability is critically dependent on water depth at the grounding line. Reference Denton and ArmstrongDenton and Armstrong (1968), and Reference Denton, Denton, Armstrong and StuiverDenton and others (1970, Reference Denton, Denton, Armstrong, Stuiver and Turekian1971) found evidence that grounded ice existed recently in McMurdo Sound, and Reference Denton and BornsDenton and Borns (1974), and Reference Denton, Denton, Borns, Grosswald, Stuiver and NicholsDenton and others (1975) found additional evidence suggesting that the grounded ice sheets that filled McMurdo Sound were widespread throughout the Ross Sea. Reference HughesHughes (1973, Reference Hughes1975) synthesized several lines of evidence indicating the recent and extensive retreat of the West Antarctic ice sheet, and Reference Thomas and BentleyThomas and Bentley (1978[b]) calculated retreat-rates in the Ross Sea, assuming a grounding-line position at 18000 years b.p. similar to that reconstructed by Reference Hughes, Hughes, Denton, Andersen, Schilling, Fastook, Lingle, Denton and HughesHughes and others (in press). The relative sea-level curves presented here suggest, more specifically, the relationships between Northern Hemisphere deglaciation, sea-level changes at the Antarctic ice margin and behavior of the West Antarctic ice sheet.
If the West Antarctic ice sheet began retreating from the edge of the continental shelf immediately after 18000 years B.P., as assumed here, net emergence at the ice margin is predicted to have occurred as shown in Figure 4. Falling sea-level at the ice margin would have tended to re-stabilize the grounding line, however. This suggests that the West Antarctic ice sheet probably remained grounded to the edge of the continental shelf during the initial gradual stages of Northern Hemisphere deglaciation, and that retreat began only after submergence due to accelerated northern deglaciation became sufficiently pronounced to dominate the emergence at the Ross Sea ice margin. (This emergence would otherwise have been caused by reduction of the West Antarctic ice mass.) Figure 4 shows that this is predicted to have started at c. 13000 years B.P. This is approximately in accord with the assumption of Reference Thomas and BentleyThomas and Bentley (1978[b]) that retreat started at c. 15000 years B.P. The first 100 km of retreat was found by them to take 1 500-2500 years, but after that retreat-rates accelerated dramatically. This accords with the continuous net submergence predicted at the grounding line during the time the grounding line was assumed to retreat across Pennell Bank (Fig. 5). (Note that comparable net submergence is not predicted for the Weddell Sea near the continental shelf (Fig. 10), however.)
Immediate decrease of sea depth at the ice margin during retreat due to elastic uplift of the sea-floor was assumed by Thomas and Bentley to be less than 5% of total isostatic depression and, since this was within the error limits of their calculation, the effect was neglected. 5% appears to be a substantial underestimate, however. Reference Farrell and ClarkFarrell and Clark (1976) calculated the instantaneous global response to a 1 m thinning of the Laurentide and Fennoscandian ice sheets, and the viscous response after a time lapse of 1000 years. For points beneath interior regions of the reduced ice loads (e.g. the Baltic Sea), immediate emergence was found to be 50% greater than the average global rise of sea-level. (That is, the instantaneous decrease in separation between the geoid and the ocean bottom was found to be greater by 50% than the average increase in separation between these two surfaces over the world ocean.) Elastic uplift of the sea-floor was found to account for 37% of this total instantaneous emergence, and the remaining 63% resulted from concurrent depression of the geoid due to reduced gravitational attraction of the ice mass. The total instantaneous decrease of relative sea-level was found to be 60% of the decrease after 1000 years of viscous isostatic adjustment and geoid change. Immediate emergence after thinning was found by Reference Clark, Clark, Farrell and PeltierClark and others (1978) to be 27% of total emergence after 10000 years of viscous isostatic adjustment.
These results, which are for the centers of ice sheets, are modulated by angular separation when a point located elsewhere beneath an ice sheet is considered. Thus, the sea-level response at the grounding line to thinning of the West Antarctic ice sheet should be somewhat less than the above values. (Reference Clark and LingleClark and Lingle (1977) found that, if the present West Antarctic ice sheet thinned uniformly by 1 m, immediate emergence would occur in the Ross Sea. Viscous flow within the mantle would cause relative sea-level to begin rising, however, after about 1200 years. The nature of the coupling between ice-sheet retreat, sea-level change, and the elastic and viscous response of the solid Earth is not simple.)
Reference Thomas and BentleyThomas and Bentley (1978[b]) suggested that grounding-line retreat was halted in the Ross Sea by suitably high bedrock sills, or by the damming effects of an ice shelf that formed in front of the grounding line, augmented by isostatic uplift of the sea-floor. The results discussed here indicate that the effect of elastic uplift is greatly increased by simultaneous depression of the geoid, and both factors constitute a substantial fraction of eventual sea-level change. Figure 6 shows that when the grounding line retreats beyond a critical distance (McMurdo Sound, for the initial ice-sheet configuration assumed here), the relative sea-level response is characterized by dramatic emergence, even though sea-levels are rising elsewhere. Figure 7 (central Ross Ice Shelf) shows that both the total emergence and the rate of emergence accompanying further retreat become larger, as the grounding line approaches the center of the ice sheet. Thus, falling relative sea-levels may have exerted a significant braking effect on retreat of the West Antarctic ice sheet, when grounding lines in both the Ross and Weddell Seas retreated into regions where this was the dominant response.
Reference Thomas and BentleyThomas and Bentley (1978[a]) have found that the south-east corner of the Ross Ice Shelf is thickening, possibly by more than 0.3 m a−1. They suggested that this is due to compressive strain-rates up-stream of Crary Ice Rise, where the ice shelf has been pinned by a high point on the sea-floor due to isostatic uplift, and that thickening might be causing the grounding lines of ice streams feeding this portion of the ice shelf (such as ice stream B) to advance. The calculated relative sea-level curves presented here are compatible with this conclusion. In addition, these curves (Figs 7 and 11) indicate that similar ice-shelf thickening may be occurring up-stream of pinning points beneath the Ronne Ice Shelf in the Weddell Sea.
Reference Denton, Denton, Hughes, Fastook, Schilling and LingleDenton and others (1979) and Stuiver and others (in press) have suggested that the grounding lines of Pine Island and Thwaites Glaciers (which discharge into Pine Island Bay (Fig. 1)) may be on the verge of rapid retreat. This suggestion is based on the hypothesis that ice-stream acceleration, accompanied by grounding-line retreat, is prevented by the stabilizing influence of large fringing ice shelves in cases where the ice-stream bed is below sea-level. (A suitably high bedrock sill would tend to re-stabilize a retreating grounding line.) Pine Island and Thwaites Glaciers are not buttressed by large ice shelves. Figure 9 shows that 5 m of relative sea-level rise since 5000 years B.P. is predicted in Pine Island Bay. If the Pine Island and Thwaites Glaciers grounding lines are metastable or unstable, continuing sea-level rise in this area would increase the probability of rapid retreat.
The edge of the continental shelf is the maximum possible extent of the Antarctic ice sheet during the 18000 years B.P. glacial maximum. Reference Kellogg, Kellogg, Truesdale and OstermanKellogg and others (1979) have concluded that sediment cores taken from the bottom of the Ross Sea support the hypothesis that the grounding line did advance that far in the Ross Sea embayment. Reference DrewryDrewry (1979) believes, however, that Ross Sea sediments indicate that the grounding line was only slightly seaward of its present position at 18000 years B.P., and that only limited grounding of an expanded Ross Ice Shelf occurred over high points on the sea floor. Because of this disagreement regarding the former extent of the West Antarctic ice sheet, it is worth considering how the results obtained here might differ if the ice sheet were only slightly larger at 18000 years B.P. instead of substantially larger as shown in Figure 3.
If grounding-line retreat had started, say, from some position between the present margin of the Ross Ice Shelf and the edge of the continental shelf, the area of the present Ross Ice Shelf would probably still be within sea-level Zone I, where continuous emergence would be predicted. However, the point at which submergence at the grounding line during retreat would be replaced by falling relative sea-level would be further toward the center of the West Antarctic ice sheet than predicted here. Predicted emergence at McMurdo Sound would be less, as would the fall of relative sea-level beneath the Ross Ice Shelf during the past 2000 years. If the grounding line at 18000 years B.P. were only slightly seaward of its present position, with only limited grounding of the Ross Ice Shelf on sea-floor high points, McMurdo Sound might fall either within the Antarctic Transition Zone (where emergence during retreat followed by submergence until the present would be predicted), or within Antarctic Zone II (where continuous submergence during and after retreat would be predicted).
Acknowledgements
This work was supported by National Science Foundation grant OCE 76-20743, and by Division of Earth Sciences NSF grants DES 74-13047-A01 and EAR 74-13047A-02. Computer time used in this research was supplied by the National Center for Atmospheric Research, which is sponsored by NSF. Thanks are extended to W. R. Peltier for supplying the Green functions used in the Farrell and Clark model, to G. H. Denton and T. J. Hughes for allowing us to use unpublished CLIMAP results, to Diana D. Lingle for drafting the figures, and to D. H. Schilling, C. R. Bentley, R. H. Thomas, and T.J. Hughes for reviewing the manuscript.
Discussion
D. J. Drewry: DO I gather from your emergence curve for the Ross Sea that the sea-level change at 18000 years B.P. was about 75 m? If not, can you predict sea-level depression in this area at that time?
C. S. Lingle: In the Ross Sea, near the edge of the continental shelf, about 3 m of emergence is predicted between 16000 and 13000 years B.P., followed by 76 m of submergence between 13000 years B.P. and the present. The total predicted submergence (as opposed to the form of the emergence-submergence curve), however, is a function of the ice history used as input to the Farrell and Clark model.
The curve representing relative sea-level change due to deglaciation of the Northern Hemisphere (Fig. 3) was calculated using an assumed eustatic sea-level rise of 75.6 m (Reference Clark, Clark, Farrell and PeltierClark and others, 1978). The curve representing the Antarctic contribution to relative sea-level change at this location was calculated using an assumed additional eustatic rise of 25 m. The Farrell and Clark model calculates the time-dependent distribution of relative sea-level change corresponding to a given initial configuration of ice sheets, and a given history of ice-sheet thinning. Thus, total submergence predicted for this location might be greater or less, depending primarily on the deglaciation history assumed for the Northern Hemisphere.
R. H. Thomas: What would be the effect on your emergence curves in the Ross Sea of allowing the West Antarctic ice sheet to retreat more rapidly than you assumed ?
Lingle : Continuous emergence during and after ice-sheet thinning would still be predicted for areas beneath the Ross Ice Shelf, but a lesser rate of emergence would be predicted between 2000 years B.P. and the present (Fig. 6) if the ice sheet retreated to its present size earlier than we assumed. Further north in the Ross Sea, say in the Pennell Bank area, the curve representing relative sea-level change due to Antarctic retreat in Figure 5 would show emergence beginning at an earlier time, followed by submergence beginning at an earlier time. The net effect would be continuous submergence during the past 11000 years or more, but with a lesser rate of submergence predicted between 6000 years B.P. and the present.
O. Orheim: What physical evidence do you have for the assumption that the Filchner-Ronne Ice Shelf was grounded out to the 500 m bathymetric contour?
Lingle: That condition in the Weddell Sea was only an assumption made on similarity around Antarctica.
T. J. Hughes: There are ice-cored moraines at the Ronne Ice Shelf but no dates are available.



