1 Introduction
Oceanic mesoscales, of the order of 100 km, are constrained by the effects of rapid rotation and strong stratification and cover a wide temporal range of scales. The slow time scales are predominantly due to mesoscale eddies in geostrophic balance (Ferrari & Wunsch Reference Ferrari and Wunsch2010; Chelton, Schlax & Samelson Reference Chelton, Schlax and Samelson2011), while internal gravity waves – primarily storm excited near-inertial waves and internal tides – contribute to the fast time scales (Garrett & Kunze Reference Garrett and Kunze2007; Alford et al. Reference Alford, MacKinnon, Simmons and Nash2016). Although the fast–slow time-scale separation and the smallness of the Rossby and Froude numbers have been used in the past to rule out energetic interactions between the waves and the balanced flow (Farge & Sadourny Reference Farge and Sadourny1989; Polvani et al. Reference Polvani, McWilliams, Spall and Ford1994; Dewar & Killworth Reference Dewar and Killworth1995; Majda & Embid Reference Majda and Embid1998; Zeitlin, Reznik & Ben Jelloul Reference Zeitlin and Reznik2003), recent investigations in a wide range of configurations are beginning to challenge this paradigm. The increased demand to understand various missing links in the oceanic energy transfer pathways has also fuelled different kinds of wave–balanced flow investigations.
Near-inertial waves (NIWs hereafter) form an important peak in the high-frequency spectrum of oceanic kinetic energy (Ferrari & Wunsch Reference Ferrari and Wunsch2009). This has inspired several theoretical investigations of NIW-balanced flow interactions. Xie & Vanneste (Reference Xie and Vanneste2015) exploited the small Rossby number at mesoscales to derive an asymptotic model to examine NIW-balanced flow interactions and recently Rocha, Wagner & Young (Reference Rocha, Wagner and Young2018) examined a further simplification of this asymptotic model, restricting the wave field to a single plane wave. Both these investigations found NIWs extracting energy from balanced flows. Gertz & Straub (Reference Gertz and Straub2009) examined the interaction of externally forced NIWs on balanced flows within a set-up motivated by wind-driven ocean gyres. Gertz & Straub found that the balanced flow could gain or lose energy to waves. Particularly in regions where balanced flow was weaker than waves, at large scales, waves were seen to transfer energy to the balanced flow. Taylor & Straub (Reference Taylor and Straub2016) conducted a series of forced-dissipative numerical simulations to find that externally forced NIWs could act as a sink for the slow mesoscale field. Both Gertz & Straub and Taylor & Straub report that their local Rossby numbers reached
 $O(1)$
values, and in this sense differs from previously mentioned asymptotic models, although all these works were examining mesoscale wave–balanced flow interactions. In the high Rossby number regime, specifically with an eye on submesoscale dynamics, Barkan, Winters & McWilliams (Reference Barkan, Winters and McWilliams2017) examined the effect of externally forced waves in the upper ocean on balanced eddies. Although the stochastic high-frequency forcing used there excited a wide spectrum of internal gravity waves, more than three quarters of the wave energy was observed to be within the NIW band. Fast waves, in addition to directly extracting low-frequency energy, were also seen to initiate mesoscale to submesoscale energy transfer, leading to increased total energy dissipation. Finally, NIWs can interact strongly with ocean fronts. Thomas (Reference Thomas2017) reviews a wide range of situations in which NIW–front interactions can initiate instabilities, turbulence and dissipation of both the wave and the front. Amongst these different wave–front configurations discussed by Thomas, the investigation undertaken by Thomas & Taylor (Reference Thomas and Taylor2014) is an example where NIWs transfer energy to baroclinic geostrophic currents, this being catalyzed by parametric subharmonic instability.
In addition to the near-inertial peak, the oceanic frequency spectrum also consists of a second dominant high-frequency component corresponding to the lunar
 $M_{2}$
tide (Ferrari & Wunsch Reference Ferrari and Wunsch2009). Recent oceanic observations and state-of-the-art high-resolution global-scale ocean simulations point out that, in certain oceanic regions, gravity waves corresponding to internal tides can have more energy than the geostrophic balanced flow. Bühler, Callies & Ferrari (Reference Bühler, Callies and Ferrari2014) developed and applied a gravity wave–balanced flow decomposition to shipboard acoustic Doppler current profiler (ADCP) data to conclude that, depending on the geographic location, the energy contained in the regional flow could be dominated by either inertia–gravity waves or the balanced component. While the Gulf Stream mesoscale regime was seen to be dominated by balanced flow, inertia–gravity waves dominated at 100 km scales in the eastern subtropical North Pacific, with the dominant wave frequency corresponding to that of the
 $M_{2}$
tide. Qiu et al. (Reference Qiu, Nakano, Chen and Klein2017) applied the same wave–balanced flow decomposition to an extended ADCP data set to reach a similar conclusion – the Kuroshio region was seen to have dominant geostrophic eddy energy at mesoscales while the North Equatorial Current region was seen to have a dominance of gravity wave energy at 100 km scales. High-resolution simulations of the global oceans concur with the above mentioned findings. On examining the results of wind and tidally forced eddy-resolving simulations on a global scale, Richman et al. (Reference Richman, Arbic, Shriver, Metzger and Wallcraft2012) and Qiu et al. (Reference Qiu, Chen, Klein, Wang, Torres, Fu and Menemenlis2018) found that gravity waves dominated around 100 km scales in regions of strong internal tide generation sites, such as north of Hawaii, while the Gulf Stream and Kuroshio mesoscale band was seen to be predominantly dominated by balanced eddy energy.
Given that the geostrophic kinetic energy and the low-mode internal tide energy distribution are known to vary significantly depending on the geographic location over the globe (Wunsch & Stammer Reference Wunsch and Stammer1998; Zhao et al. Reference Zhao, Alford, Girton, Rainville and Simmons2016), the findings discussed above are hardly surprising – i.e. gravity wave energy, especially in the vicinity of internal tide generation zones, can dominate over geostrophically balanced flows in specific regions, while the contrary must be expected in regions where eddy kinetic energy is strong. However, at present, it is unclear how these low vertical mode inertia–gravity waves, such as internal tides, affect geostrophic balanced flow. Although low baroclinic mode internal tide–balanced flow interactions have been investigated in idealized settings, these have focused primarily on the effect of balanced flow on waves, that leads to the scattering and loss of coherence of the wave field (Dunphy & Lamb Reference Dunphy and Lamb2014 and Ponte & Klein Reference Ponte and Klein2015 for example), rather than addressing potential wave–balanced flow energy exchange. Consequently, while a variety of theoretical investigations, such as the ones mentioned before, have focused on energy exchange between high baroclinic mode NIWs and balanced flows in different configurations, energy exchange between low baroclinic mode internal tides and balanced flow remain majorly unexplored.
This sets the primary motivation for the present work, where we examine, using numerical simulations, how fast inertia–gravity waves, representative of the first mode internal tide, affect the balanced flow. Our goal is to understand the geophysical turbulence phenomenology and the energy transfer pathways between inertia–gravity waves and balanced flows in the small Rossby number regime. Motivated by oceanic observations that indicate the predominance of internal tide and balanced energy in low vertical modes, we truncate the hydrostatic Boussinesq equations on to the barotropic and the first baroclinic mode to obtain a reduced model. This idealized model captures two-mode (barotropic and one baroclinic mode) quasi-geostrophic turbulence phenomenology in the absence of inertia–gravity waves. Consequently, we seek to understand how the well-established two-mode quasi-geostrophic turbulence phenomenology would be modified by inertia–gravity waves, especially when the wave energy exceeds the balanced flow energy. We present the derivation and features of the model in § 2, followed by a detailed description of the numerical experiments in § 3. We then summarize our work with a discussion in § 4.
2 The model
The hydrostatic Boussinesq equations on the ‘
 $f$
-plane’ are
 $$\begin{eqnarray}\displaystyle & \displaystyle \frac{\unicode[STIX]{x2202}\boldsymbol{v}}{\unicode[STIX]{x2202}t}+\boldsymbol{f}\times \boldsymbol{v}+\unicode[STIX]{x1D735}p+\boldsymbol{v}\boldsymbol{\cdot }\unicode[STIX]{x1D735}\boldsymbol{v}+w\frac{\unicode[STIX]{x2202}\boldsymbol{v}}{\unicode[STIX]{x2202}z}=0, & \displaystyle\end{eqnarray}$$
 $$\begin{eqnarray}\displaystyle & \displaystyle \frac{\unicode[STIX]{x2202}b}{\unicode[STIX]{x2202}t}+N^{2}w+\boldsymbol{v}\boldsymbol{\cdot }\unicode[STIX]{x1D735}b+w\frac{\unicode[STIX]{x2202}b}{\unicode[STIX]{x2202}z}=0, & \displaystyle\end{eqnarray}$$
 $$\begin{eqnarray}\displaystyle & \displaystyle \frac{\unicode[STIX]{x2202}p}{\unicode[STIX]{x2202}z}=b, & \displaystyle\end{eqnarray}$$
 $$\begin{eqnarray}\displaystyle & \displaystyle \unicode[STIX]{x1D735}\boldsymbol{\cdot }\boldsymbol{v}+\frac{\unicode[STIX]{x2202}w}{\unicode[STIX]{x2202}z}=0, & \displaystyle\end{eqnarray}$$
 $\boldsymbol{v}=(u,v)$
and
 $w$
are the horizontal and vertical velocities respectively,
 $b$
is the buoyancy,
 $p$
is the pressure,
 $\boldsymbol{f}=f\hat{\boldsymbol{z}}$
is the constant rotation rate,
 $N$
is the buoyancy frequency and
 $\unicode[STIX]{x1D735}=(\unicode[STIX]{x2202}_{x},\unicode[STIX]{x2202}_{y})$
.
At oceanic mesoscales, the barotropic and the first baroclinic mode contain most of the geostrophically balanced energy, as inferred from oceanic observations (Wunsch Reference Wunsch1997), theoretical estimates (Fu & Flierl Reference Fu and Flierl1980) and idealized numerical simulations (Smith & Vallis Reference Smith and Vallis2001). Additionally, satellite altimetry data show that the mode-1 internal tide, corresponding to the first baroclinic mode inertia–gravity wave, contains a large fraction of internal tide energy (see for example Ray & Zaron Reference Ray and Zaron2016 and Zhao et al.
Reference Zhao, Alford, Girton, Rainville and Simmons2016). Motivated by these observations that indicate dominant wave and balanced energies in the lowest vertical modes, we truncate the primitive equations to the barotropic and the first baroclinic mode. We assume constant buoyancy frequency
 $N$
and expand all variables in terms of the barotropic and the first baroclinic mode as:
 $$\begin{eqnarray}\displaystyle \left.\begin{array}{@{}c@{}}\displaystyle [\boldsymbol{v}(\boldsymbol{x},z,t),p(\boldsymbol{x},z,t)]=[\boldsymbol{v}_{T}(\boldsymbol{x},t),p_{T}(\boldsymbol{x},t)]+\sqrt{2}[\boldsymbol{v}_{C}(\boldsymbol{x},t),p_{C}(\boldsymbol{x},t)]\cos \left(\frac{\unicode[STIX]{x03C0}z}{H}\right),\\ \displaystyle [w(\boldsymbol{x},z,t),b(\boldsymbol{x},z,t)]=\sqrt{2}[w_{C}(\boldsymbol{x},t),b_{C}(\boldsymbol{x},t)]\sin \left(\frac{\unicode[STIX]{x03C0}z}{H}\right),\end{array}\right\} & & \displaystyle\end{eqnarray}$$
where
 $\boldsymbol{x}=(x,y)$
and
 $H$
is the ocean depth. Using above expansion and projecting (2.1) on the two vertical modes gives us
 $$\begin{eqnarray}\displaystyle & \displaystyle \frac{\unicode[STIX]{x2202}\boldsymbol{v}_{T}}{\unicode[STIX]{x2202}t}+\boldsymbol{f}\times \boldsymbol{v}_{T}+\unicode[STIX]{x1D735}p_{T}+\boldsymbol{v}_{T}\boldsymbol{\cdot }\unicode[STIX]{x1D735}\boldsymbol{v}_{T}+\boldsymbol{v}_{C}\boldsymbol{\cdot }\unicode[STIX]{x1D735}\boldsymbol{v}_{C}+(\unicode[STIX]{x1D735}\boldsymbol{\cdot }\boldsymbol{v}_{C})\boldsymbol{v}_{C}=0, & \displaystyle\end{eqnarray}$$
 $$\begin{eqnarray}\displaystyle & \displaystyle \unicode[STIX]{x1D735}\boldsymbol{\cdot }\boldsymbol{v}_{T}=0, & \displaystyle\end{eqnarray}$$
 $$\begin{eqnarray}\displaystyle & \displaystyle \frac{\unicode[STIX]{x2202}\boldsymbol{v}_{C}}{\unicode[STIX]{x2202}t}+\hat{\boldsymbol{z}}\times \boldsymbol{v}_{C}+\unicode[STIX]{x1D735}p_{C}+(\boldsymbol{v}_{T}\boldsymbol{\cdot }\unicode[STIX]{x1D735}\boldsymbol{v}_{C}+\boldsymbol{v}_{C}\boldsymbol{\cdot }\unicode[STIX]{x1D735}\boldsymbol{v}_{T})=0, & \displaystyle\end{eqnarray}$$
 $$\begin{eqnarray}\displaystyle & \displaystyle \frac{\unicode[STIX]{x2202}p_{C}}{\unicode[STIX]{x2202}t}+\left(\frac{NH}{\unicode[STIX]{x03C0}}\right)^{2}\unicode[STIX]{x1D735}\boldsymbol{\cdot }\boldsymbol{v}_{C}+\boldsymbol{v}_{T}\boldsymbol{\cdot }\unicode[STIX]{x1D735}p_{C}=0. & \displaystyle\end{eqnarray}$$
Returning to our two-vertical-mode truncated equations, we note that in (2.3a
), spatially homogeneous inertial oscillation corresponding to the zeroth Fourier mode, with the time derivative balancing the Coriolis term, is the only fast oscillating linear mode. Numerically integrating the above system in the various regimes discussed in this paper, we found this mode to be energetically insignificant and dynamically passive in terms of its effect on other modes. Therefore we take one more step to simplify our model by ignoring the spatially homogeneous inertial oscillation. We take the curl of (2.3a
) and define
 $\unicode[STIX]{x1D701}_{T}=\unicode[STIX]{x1D735}\times \boldsymbol{v}_{T}$
to replace (2.3a
) and (2.3b
) by
 $$\begin{eqnarray}\frac{\unicode[STIX]{x2202}\unicode[STIX]{x1D701}_{T}}{\unicode[STIX]{x2202}t}+\unicode[STIX]{x1D735}\times (\boldsymbol{v}_{T}\boldsymbol{\cdot }\unicode[STIX]{x1D735}\boldsymbol{v}_{T}+\boldsymbol{v}_{C}\boldsymbol{\cdot }\unicode[STIX]{x1D735}\boldsymbol{v}_{C}+(\unicode[STIX]{x1D735}\boldsymbol{\cdot }\boldsymbol{v}_{C})\boldsymbol{v}_{C})=0.\end{eqnarray}$$
Equations (2.4), (2.3c ) and (2.3d ) constitute our model for the present work. We non-dimensionalize all variables as
 $$\begin{eqnarray}\displaystyle t\rightarrow t/f,\quad \boldsymbol{x}\rightarrow L_{D}\boldsymbol{x},\quad (\boldsymbol{v}_{T},\boldsymbol{v}_{C})\rightarrow U(\boldsymbol{v}_{T},\boldsymbol{v}_{C}),\quad (p_{T},p_{C})\rightarrow fUL_{D}(p_{T},p_{C}), & & \displaystyle\end{eqnarray}$$
where
 $L_{D}=NH/\unicode[STIX]{x03C0}f$
is the first deformation scale. In the above scaling, we used a single velocity scale,
 $U$
, to non-dimensionalize both barotropic and baroclinic velocity components. From the point of view of the freely evolving turbulent simulations that we discus below,
 $U$
may be considered to be the largest velocity magnitude present in the system at
 $t=0$
. Using (2.5) in (2.4), (2.3c
) and (2.3d
) gives us our final set of equations
 $$\begin{eqnarray}\displaystyle & \displaystyle \frac{\unicode[STIX]{x2202}\unicode[STIX]{x1D701}_{T}}{\unicode[STIX]{x2202}t}+Ro\unicode[STIX]{x1D735}\times (\boldsymbol{v}_{T}\boldsymbol{\cdot }\unicode[STIX]{x1D735}\boldsymbol{v}_{T}+\boldsymbol{v}_{C}\boldsymbol{\cdot }\unicode[STIX]{x1D735}\boldsymbol{v}_{C}+(\unicode[STIX]{x1D735}\boldsymbol{\cdot }\boldsymbol{v}_{C})\boldsymbol{v}_{C})=0, & \displaystyle\end{eqnarray}$$
 $$\begin{eqnarray}\displaystyle & \displaystyle \frac{\unicode[STIX]{x2202}\boldsymbol{v}_{C}}{\unicode[STIX]{x2202}t}+\hat{\boldsymbol{z}}\times \boldsymbol{v}_{C}+\unicode[STIX]{x1D735}p_{C}+Ro(\boldsymbol{v}_{T}\boldsymbol{\cdot }\unicode[STIX]{x1D735}\boldsymbol{v}_{C}+\boldsymbol{v}_{C}\boldsymbol{\cdot }\unicode[STIX]{x1D735}\boldsymbol{v}_{T})=0, & \displaystyle\end{eqnarray}$$
 $$\begin{eqnarray}\displaystyle & \displaystyle \frac{\unicode[STIX]{x2202}p_{C}}{\unicode[STIX]{x2202}t}+\unicode[STIX]{x1D735}\boldsymbol{\cdot }\boldsymbol{v}_{C}+Ro(\boldsymbol{v}_{T}\boldsymbol{\cdot }\unicode[STIX]{x1D735}p_{C})=0, & \displaystyle\end{eqnarray}$$
 $Ro=U/fL_{D}$
is the Rossby number. Note that since we chose our length scale,
 $L$
, to be the deformation scale, the Burger number,
 $Bu=(L_{D}/L)^{2}$
, a second non-dimensional parameter, does not explicitly appear in the above equations.
Throughout this paper, we use subscripts
 $T$
and
 $C$
to represent the barotropic and the baroclinic fields respectively. Consequently in (2.6),
 $\unicode[STIX]{x1D701}_{T}$
is the barotropic vorticity corresponding to the divergence free barotropic velocity field
 $\boldsymbol{v}_{T}$
, whereas
 $\boldsymbol{v}_{C}$
and
 $p_{C}$
refer to baroclinic velocity and pressure respectively. Our focus here is on the mesoscale regime characterized by small Rossby number,
 $Ro=U/fL_{D}\ll 1$
. We are therefore set in a parameter regime where both the wave field and the balanced flow have an
 $O(1)$
Burger number, and in this sense this case differs from several previous investigations that have examined interactions between asymptotically small Burger number NIWs and
 $O(1)$
Burger number balanced flows.
2.1 Linear dynamics and quasi-geostrophy
Since our experiments are in the weakly nonlinear regime characterized by
 $Ro\ll 1$
, the nonlinear dynamics is set by the nonlinear interaction of linear modes. Setting
 $Ro=0$
in (2.6), we get the linear equations
 $$\begin{eqnarray}\displaystyle & \displaystyle \frac{\unicode[STIX]{x2202}\unicode[STIX]{x1D701}_{T}}{\unicode[STIX]{x2202}t}=0, & \displaystyle\end{eqnarray}$$
 $$\begin{eqnarray}\displaystyle & \displaystyle \frac{\unicode[STIX]{x2202}\boldsymbol{v}_{C}}{\unicode[STIX]{x2202}t}+\hat{\boldsymbol{z}}\times \boldsymbol{v}_{C}+\unicode[STIX]{x1D735}p_{C}=0, & \displaystyle\end{eqnarray}$$
 $$\begin{eqnarray}\displaystyle & \displaystyle \frac{\unicode[STIX]{x2202}p_{C}}{\unicode[STIX]{x2202}t}+\unicode[STIX]{x1D735}\boldsymbol{\cdot }\boldsymbol{v}_{C}=0. & \displaystyle\end{eqnarray}$$
 $\unicode[STIX]{x1D701}_{T}$
being purely balanced at the linear level, and does not evolve in the absence of nonlinear interactions. On the other hand, the baroclinic mode, whose evolution is captured by equations identical to linear rotating shallow water equations, consists of a linear combination of a geostrophic balanced component and a gravity wave component, which we denote with subscripts
 $G$
and
 $W$
hereafter. They satisfy
 $$\begin{eqnarray}\displaystyle \left.\begin{array}{@{}c@{}}\displaystyle \hat{\boldsymbol{z}}\times \boldsymbol{v}_{G}+\unicode[STIX]{x1D735}p_{G}=0,\\ \displaystyle \unicode[STIX]{x1D735}\boldsymbol{\cdot }\boldsymbol{v}_{G}=0,\end{array}\quad \begin{array}{@{}c@{}}\displaystyle \unicode[STIX]{x2202}\boldsymbol{v}_{W}/\unicode[STIX]{x2202}t+\hat{\boldsymbol{z}}\times \boldsymbol{v}_{W}+\unicode[STIX]{x1D735}p_{W}=0,\\ \displaystyle \unicode[STIX]{x2202}p_{W}/\unicode[STIX]{x2202}t+\unicode[STIX]{x1D735}\boldsymbol{\cdot }\boldsymbol{v}_{W}=0.\end{array}\right\} & & \displaystyle\end{eqnarray}$$
The decomposition (2.8) can be equivalently constructed in spectral space. The linear baroclinic equations, (2.7b ) and (2.7c ), being identical to the linear rotating shallow water equations, have a decomposition that coincides with that used by Remmel & Smith (Reference Remmel and Smith2009) and Ward & Dewar (Reference Ward and Dewar2010). Consider rewriting (2.7b ) and (2.7c ) as
 $$\begin{eqnarray}\frac{\unicode[STIX]{x2202}\boldsymbol{U}_{C}}{\unicode[STIX]{x2202}t}+\mathscr{L}\boldsymbol{U}_{C}=0,\end{eqnarray}$$
where
 $\boldsymbol{U}_{C}=(u_{C},v_{C},p_{C})^{\text{T}}$
(the superscript ‘
 $\text{T}$
’ is a shorthand for ‘transpose’) with
 $\mathscr{L}$
being the corresponding linear differential operator matrix. One can show that the eigenvectors of the linear system (2.9) form a complete orthogonal basis in spectral space,
 $\{\unicode[STIX]{x1D719}_{0}(\boldsymbol{k}),\unicode[STIX]{x1D719}_{+}(\boldsymbol{k}),\unicode[STIX]{x1D719}_{-}(\boldsymbol{k})\}$
, where
 $\unicode[STIX]{x1D719}_{0}$
contains the balanced component,
 $G$
, and
 $\unicode[STIX]{x1D719}_{+}$
and
 $\unicode[STIX]{x1D719}_{-}$
together contain the wave component,
 $W$
. The basis vectors for
 $k\neq 0$
are given by
 $$\begin{eqnarray}\displaystyle & \displaystyle \unicode[STIX]{x1D719}_{0}=\frac{1}{\unicode[STIX]{x1D714}}(\text{i}k_{y},-\text{i}k_{x},-1)^{\text{T}}, & \displaystyle\end{eqnarray}$$
 $$\begin{eqnarray}\displaystyle & \displaystyle \unicode[STIX]{x1D719}_{\pm }=\frac{1}{\sqrt{2}\unicode[STIX]{x1D714}k}(\pm \unicode[STIX]{x1D714}k_{x}+\text{i}k_{y},\pm \unicode[STIX]{x1D714}k_{y}-\text{i}k_{x},\unicode[STIX]{x1D714}^{2}-1)^{\text{T}}, & \displaystyle\end{eqnarray}$$
 $\boldsymbol{k}=(k_{x},k_{y})$
,
 $k=\sqrt{k_{x}^{2}+k_{y}^{2}}$
and
 $\unicode[STIX]{x1D714}=\sqrt{1+k^{2}}$
. For the special case
 $k=0$
, we have
 $$\begin{eqnarray}\displaystyle \unicode[STIX]{x1D719}_{0}=(0,0,1)^{\text{T}},\quad \unicode[STIX]{x1D719}_{\pm }=\frac{1}{\sqrt{2}}(\text{i},\pm 1,0)^{\text{T}}. & & \displaystyle\end{eqnarray}$$
The baroclinic mode in spectral space can thus be expanded as a linear combination of the basis vectors
 $$\begin{eqnarray}\displaystyle (\hat{u} _{C},\hat{v}_{C},\hat{p}_{C})^{\text{T}}=(\hat{u} _{G},\hat{v}_{G},\hat{p}_{G})^{\text{T}}+(\hat{u} _{W},\hat{v}_{W},\hat{p}_{W})^{\text{T}}, & & \displaystyle\end{eqnarray}$$
where
 $$\begin{eqnarray}\displaystyle (\hat{u} _{G},\hat{v}_{G},\hat{p}_{G})^{\text{T}}=a_{0}(\boldsymbol{k},t)\unicode[STIX]{x1D719}_{0} & & \displaystyle\end{eqnarray}$$
and
 $$\begin{eqnarray}\displaystyle (\hat{u} _{W},\hat{v}_{W},\hat{p}_{W})^{\text{T}}=a_{+}(\boldsymbol{k},t)\unicode[STIX]{x1D719}_{+}+a_{-}(\boldsymbol{k},t)\unicode[STIX]{x1D719}_{-}. & & \displaystyle\end{eqnarray}$$
The coefficients
 $a_{0}$
,
 $a_{+}$
and
 $a_{-}$
can be found by taking the inner product of
 $(\hat{u} _{C},\hat{v}_{C},\hat{p}_{C})^{\text{T}}$
with the corresponding basis vectors:
 $\unicode[STIX]{x1D719}_{0}$
,
 $\unicode[STIX]{x1D719}_{+}$
and
 $\unicode[STIX]{x1D719}_{-}$
. We used above decomposition, given in (2.12), to separate wave and balanced components from the numerical solutions and also for initializing the simulations with varying wave and balanced flow energies.
Returning to the equations in physical space, from (2.7b ) and (2.7c ) we get the linear potential vorticity (PV hereafter) equation
 $$\begin{eqnarray}\displaystyle \frac{\unicode[STIX]{x2202}q_{C}}{\unicode[STIX]{x2202}t}=0,\quad q_{C}=\unicode[STIX]{x1D701}_{C}-p_{C}. & & \displaystyle\end{eqnarray}$$
Furthermore, equations (2.8) give us
 $$\begin{eqnarray}\frac{\unicode[STIX]{x2202}q_{W}}{\unicode[STIX]{x2202}t}=0,\end{eqnarray}$$
which on assuming
 $q_{W}=0$
at
 $t=0$
gives us
 $$\begin{eqnarray}q_{W}=\unicode[STIX]{x1D701}_{W}-p_{W}=0.\end{eqnarray}$$
Consequently, we have
 $$\begin{eqnarray}q_{C}=q_{G}=(\unicode[STIX]{x1D6E5}-1)p_{G}.\end{eqnarray}$$
The linear PV is unaffected by waves and therefore
 $q_{C}$
forms the balanced PV of the baroclinic mode. The balanced modes
 $\unicode[STIX]{x1D701}_{T}$
and
 $q_{C}$
in the absence of waves evolve according to the two-mode quasi-geostrophic equations. To see this explicitly, consider ignoring inertia–gravity waves and restricting the baroclinic fields to geostrophic balanced fields, i.e.
 $\boldsymbol{v}_{C}=\boldsymbol{v}_{G}$
and
 $p_{C}=p_{G}$
such that
 $\hat{\boldsymbol{z}}\times \boldsymbol{v}_{G}=\unicode[STIX]{x1D735}p_{G}$
. Using these in (2.6), we get
 $$\begin{eqnarray}\displaystyle & \displaystyle \frac{\unicode[STIX]{x2202}\unicode[STIX]{x1D701}_{T}}{\unicode[STIX]{x2202}t}+Ro(\boldsymbol{v}_{T}\boldsymbol{\cdot }\unicode[STIX]{x1D735}\unicode[STIX]{x1D701}_{T}+\boldsymbol{v}_{G}\boldsymbol{\cdot }\unicode[STIX]{x1D735}\unicode[STIX]{x1D701}_{G})=0, & \displaystyle\end{eqnarray}$$
 $$\begin{eqnarray}\displaystyle & \displaystyle \frac{\unicode[STIX]{x2202}\unicode[STIX]{x1D701}_{G}}{\unicode[STIX]{x2202}t}+Ro(\boldsymbol{v}_{G}\boldsymbol{\cdot }\unicode[STIX]{x1D735}\unicode[STIX]{x1D701}_{T}+\boldsymbol{v}_{T}\boldsymbol{\cdot }\unicode[STIX]{x1D735}\unicode[STIX]{x1D701}_{G})=0, & \displaystyle\end{eqnarray}$$
 $$\begin{eqnarray}\displaystyle & \displaystyle \frac{\unicode[STIX]{x2202}p_{G}}{\unicode[STIX]{x2202}t}+Ro(\boldsymbol{v}_{T}\boldsymbol{\cdot }\unicode[STIX]{x1D735}p_{G})=0, & \displaystyle\end{eqnarray}$$
 $p_{G}=\unicode[STIX]{x1D713}_{G}$
,
 $\unicode[STIX]{x1D701}_{G}=\unicode[STIX]{x1D6E5}\unicode[STIX]{x1D713}_{G}$
and
 $\unicode[STIX]{x1D701}_{T}=\unicode[STIX]{x1D6E5}\unicode[STIX]{x1D713}_{T}$
, we get the quasi-geostrophic equations for the evolution of barotropic and baroclinic balanced flow as
 $$\begin{eqnarray}\displaystyle & \displaystyle \frac{\unicode[STIX]{x2202}}{\unicode[STIX]{x2202}t}\unicode[STIX]{x1D6E5}\unicode[STIX]{x1D713}_{T}+Ro\,\unicode[STIX]{x2202}[\unicode[STIX]{x1D713}_{T},\unicode[STIX]{x1D6E5}\unicode[STIX]{x1D713}_{T}]+Ro\,\unicode[STIX]{x2202}[\unicode[STIX]{x1D713}_{G},(\unicode[STIX]{x1D6E5}-1)\unicode[STIX]{x1D713}_{G}]=0, & \displaystyle\end{eqnarray}$$
 $$\begin{eqnarray}\displaystyle & \displaystyle \frac{\unicode[STIX]{x2202}}{\unicode[STIX]{x2202}t}(\unicode[STIX]{x1D6E5}-1)\unicode[STIX]{x1D713}_{G}+Ro\,\unicode[STIX]{x2202}[\unicode[STIX]{x1D713}_{T},(\unicode[STIX]{x1D6E5}-1)\unicode[STIX]{x1D713}_{G}]+Ro\,\unicode[STIX]{x2202}[\unicode[STIX]{x1D713}_{G},\unicode[STIX]{x1D6E5}\unicode[STIX]{x1D713}_{T}]=0, & \displaystyle\end{eqnarray}$$
 $\unicode[STIX]{x2202}[f,g]=f_{x}g_{y}-f_{y}g_{x}$
is the Jacobian. Consequently, we anticipate geostrophic turbulence phenomenology on integrating (2.6) with balanced initial conditions, where the net transfer of energy is from the baroclinic balanced flow to the barotropic balanced flow (Salmon Reference Salmon1978, Vallis Reference Vallis2006). Figure 1 shows the three modes in our model (2.6) and the energy pathway (blue arrow) in the absence of inertia–gravity waves, based on the two-mode quasi-geostrophic turbulence phenomenology. (We note that (2.18), which we refer to as the two-mode quasi-geostrophic equations throughout this paper, is identical to the two-layer quasi-geostrophic equations with equal layer depths.)
Schematic of the model described by (2.6). The dashed boxes on the top and bottom represent the barotropic and baroclinic modes respectively, denoted by T and C. The barotropic mode is balanced with no gravity wave component. The baroclinic mode, on the other hand, has inertia–gravity waves (W, red box) in addition to the balanced flow (G, blue box), i.e.
 $\text{C}=\text{W}+\text{G}$
. We denote the total balanced field by B, i.e.
 $\text{B}=\text{T}+\text{G}$
. The well-established quasi-geostrophic phenomenology, obtained by reducing (2.6) to (2.18), involves interactions between T and G alone resulting in a net energy transfer from G to T, as indicated by the blue arrow above.

The above mentioned quasi-geostrophic turbulence phenomenology is expected to be modified by the presence of inertia–gravity waves. Notably, although gravity waves do not project on the linear potential vorticity, nonlinear wave interactions can generate an
 $O(Ro)$
PV component, asymptotically comparable in strength to quadratic wave quantities, such as Stokes drift for example (Bühler & McIntyre Reference Bühler and McIntyre1998; Thomas Reference Thomas2016). In the presence of an
 $O(1)$
balanced flow, the effect of this weak wave PV would be negligible, at least for a few eddy turnover time scales. In contrast, wave-dominated regions with weak balanced flow, such as the regions described before where mode-1 internal tides with significant energy content are observed, the wave-induced PV would affect the quasi-geostrophic phenomenology. This is expected particularly in the scaling regime where balanced flow is relatively weak, with
 $O(Ro)$
strength, making it comparable in magnitude to the
 $O(Ro)$
PV induced by the
 $O(1)$
wave field. This distinguished parameter regime, where nonlinear wave interaction effects are comparable in strength to the vortical field, has been considered for surface gravity wave–vorticity interactions in connection with Langmuir circulations (Craik & Leibovich Reference Craik and Leibovich1976; Leibovich Reference Leibovich1980) and NIW-balanced flow interactions (Xie & Vanneste Reference Xie and Vanneste2015; Wagner & Young Reference Wagner and Young2016; Rocha et al.
Reference Rocha, Wagner and Young2018). Our objective is to explore the geophysical turbulence phenomenology and the energy transfer directions between first baroclinic mode inertia–gravity waves and balanced flow in similar parameter regimes, characterized by small balance-to-wave energy ratios, using numerical simulations. Consequently, we will explain how the inertia–gravity wave component (W) in the schematic shown in figure 1 would participate in the geophysical turbulence phenomenology, especially in wave dominating regimes.
2.2 Advantages of the model over shallow water equations
Before we proceed to numerical simulation results, we point out some interesting features of the idealized model used for the present study, equation (2.6) that captures the interaction of the barotropic and first baroclinic mode, ignoring higher vertical modes. Typically, the rotating shallow water equations (RSW hereafter), the work horses for idealized geophysical fluid dynamic investigations (Zeitlin Reference Zeitlin2018), would be the first choice for similar wave–vortex interaction investigations. However, we note that the model (2.6) has at least two attractive advantages over RSW models for the wave–balanced flow investigations we undertake. First, unlike RSW, whose energy consists of cubic terms, equation (2.6) conserves quadratic energy
 $$\begin{eqnarray}\displaystyle \frac{\text{d}}{\text{d}t}\int \int \left(\frac{1}{2}{\boldsymbol{v}_{T}}^{2}+\frac{1}{2}{\boldsymbol{v}_{C}}^{2}+\frac{1}{2}{p_{C}}^{2}\right)\text{d}x\,\text{d}y=0, & & \displaystyle\end{eqnarray}$$
allowing an exact spectral decomposition of the energy into wave and balanced components. Second, and more importantly, equation (2.6) does not seem to develop shocks, this observation being based on a wide set of exploratory numerical simulations we performed with varying wave energy levels (see appendix A for specific details of the potential absence of shocks in the model). This is a significant advantage for the present study that is attempting to understand the effect of high energy non-breaking dispersive waves on balanced flow. Although RSW models have a clear separation between waves and balanced flow at the linear level, analogous to the decomposition presented in (2.8) and (2.12), nonlinear interactions and subsequent shock formation will result in strong intermittent and localized dissipation, which can in turn generate PV locally (Pratt Reference Pratt1983; Jiang & Smith Reference Jiang and Smith2003; Lahaye & Zeitlin Reference Lahaye and Zeitlin2012b ). Such shock-induced wave dissipation makes it difficult to maintain a high wave-to-balance energy ratio in the different regimes we are interested in.
In principle, the wave spectrum obtained from RSW simulations that resolve a broad range of scales should consist of multiple segments. At large scales, where the effects of rotation dominate, a non-breaking wave spectrum due to weakly nonlinear interactions between inertia–gravity waves is anticipated (we note that this part of the spectrum can itself be composed of several subparts. Falkovich (Reference Falkovich1992) and Falkovich & Medvedev (Reference Falkovich and Medvedev1992) are attempts to capture the low and high wavenumber subparts of this segment of the inertial range using the wave–turbulence formalism). At smaller scales, the effects of rotation would be negligible and strongly nonlinear dynamics would dominate. Given that the shallow water equations are similar to the compressible gas dynamics equations (Whitham Reference Whitham2011), shocks in RSW models at small scales may be expected to generate a wave spectrum close to
 $k^{-2}$
at these small scales, as is the scenario in compressible flows (Kuznetsov Reference Kuznetsov2004; Falkovich & Kritsuk Reference Falkovich and Kritsuk2017; Gupta & Scalo Reference Gupta and Scalo2018; Murray & Bustamante Reference Murray and Bustamante2018).
Consequently, the wave spectrum of high-resolution RSW simulations should have a non-breaking rotation-dominated part at low wavenumbers and a shock spectrum generated by dissipative wave breaking events at smaller scales, followed by the viscous range. Although we anticipate such RSW simulations with a clear inviscid dispersive wave spectrum at large scales, well separated from the shock spectrum at small scales, to qualitatively capture the results we report below, extremely high-resolution simulations using shock capturing RSW models would be computationally much expensive, diminishing the advantage gained by preferring a reduced two-dimensional model (notably the full three-dimensional Boussinesq equations are shock free with divergence free velocity fields). These considerations favoured the use of the truncated model (2.6) in this study over RSW models to examine energetic interactions between first baroclinic mode inertia–gravity waves and geostrophic balanced flows at affordable resolutions. The truncated model, equations (2.6) allows a clear separation between balanced and wave fields across scales, both fields are allowed to interact only via nonlinear dynamics that inhibits shock formation. Absence of shock results in minimal wave energy dissipation, which allowed us to maintain desired high wave energy levels in the experiments described in detail below.
3 Numerical experiments
To investigate the geophysical turbulence phenomenology in different cases, we numerically integrated (2.6) in the small Rossby number regime by setting
 $Ro=0.1$
. For each experiment, equation (2.6) was integrated up to
 $t=30\,000$
on a
 $[0,2\unicode[STIX]{x03C0}]^{2}$
doubly periodic domain with a dealiased pseudospectral code. All our results presented below were based on simulations with
 $384^{2}$
grid points, which corresponded to
 $128^{2}$
active Fourier modes after two-thirds dealiasing (or an equivalent resolution of
 $256^{2}$
). Selected simulations were run at double the resolution to ensure that the results discussed below were unaffected by our resolution. Hyperdiffusion terms of the form
 $\unicode[STIX]{x1D708}\unicode[STIX]{x1D6E5}^{8}\unicode[STIX]{x1D701}_{T}$
,
 $\unicode[STIX]{x1D708}\unicode[STIX]{x1D6E5}^{8}\boldsymbol{v}_{C}$
and
 $\unicode[STIX]{x1D708}\unicode[STIX]{x1D6E5}^{8}p_{C}$
were added to equations (2.6) to dissipate small-scale features and represent the only mechanism by which total energy is lost. Use of a high-order dissipation operator (
 $\unicode[STIX]{x1D708}\unicode[STIX]{x1D6E5}^{8}$
, similar to Farge & Sadourny (Reference Farge and Sadourny1989), Maltrud & Vallis (Reference Maltrud and Vallis1993) and Musacchio & Boffetta (Reference Musacchio and Boffetta2019) for example), allowed us to have an extended range of inviscid scales for the chosen spatial resolution. The dissipation wavenumber,
 $k_{d}$
, corresponding to the
 $\unicode[STIX]{x1D708}\unicode[STIX]{x1D6E5}^{n}$
hyperdissipation operator is given by (see for example Spyksma, Magcalas & Campbell (Reference Spyksma, Magcalas and Campbell2012)):
 $k_{d}=({\mathcal{E}}/\unicode[STIX]{x1D708}^{3})^{1/(6n-2)}$
,
 ${\mathcal{E}}$
being the energy dissipation rate. We chose the hyperviscosity
 $\unicode[STIX]{x1D708}$
to be
 $2.4\times 10^{-34}$
corresponding to
 $n=8$
so that the dissipation wavenumber
 $k_{d}$
was between 105 and 108 in all simulations, with
 $k_{max}=128$
.
Freely evolving turbulent simulations in different regimes were initialized with specific amounts of energy in the T, G and W modes. We hereafter denote the barotropic energy, baroclinic balanced energy and their sum, the total baroclinic balanced energy by
 $E_{T}$
,
 $E_{G}$
and
 $E_{B}=E_{T}+E_{G}$
respectively, while total wave energy is denoted by
 $E_{W}$
. Low wavenumber random initialization was used for wave and balanced fields, i.e. initial conditions were non-zero for
 $k<k_{0}$
and zero for higher wavenumbers. In particular, for the barotropic mode, a random streamfunction was initialized as
 $\hat{\unicode[STIX]{x1D713}}_{T}=\hat{\unicode[STIX]{x1D713}}_{T0}\exp (2\unicode[STIX]{x03C0}\text{i}\unicode[STIX]{x1D703})$
when
 $k<k_{0}$
and zero otherwise, where
 $\unicode[STIX]{x1D703}$
is a random variable uniformly sampled in
 $[0,1]$
. The barotropic vorticity,
 $\unicode[STIX]{x1D701}_{T}$
, was then retrieved by applying the spectral Laplace operator to
 $\hat{\unicode[STIX]{x1D713}}_{T}$
and transforming to physical space. The streamfunction amplitude
 $\hat{\unicode[STIX]{x1D713}}_{T0}$
was chosen so as to get the desired value of
 $E_{T}$
. To get the initial baroclinic velocity and pressure, we utilized the wave–balanced flow decomposition described in (2.12). The coefficients
 $a_{0}$
,
 $a_{+}$
and
 $a_{-}$
were set to a constant times
 $\exp (2\unicode[STIX]{x03C0}\text{i}\unicode[STIX]{x1D703}_{0})$
,
 $\exp (2\unicode[STIX]{x03C0}\text{i}\unicode[STIX]{x1D703}_{+})$
and
 $\exp (2\unicode[STIX]{x03C0}\text{i}\unicode[STIX]{x1D703}_{-})$
respectively when
 $k<k_{0}$
and zero otherwise,
 $\unicode[STIX]{x1D703}_{0}$
,
 $\unicode[STIX]{x1D703}_{+}$
and
 $\unicode[STIX]{x1D703}_{-}$
being random variables similar to the barotropic case discussed before. The amplitude of
 $a_{0}$
was chosen so that
 $E_{G}=E_{T}$
, ensuring that the balanced flow in the baroclinic mode had the same amount of initial energy as the barotropic mode. For all experiments discussed in this paper, we initialized both the balanced modes, T and G, with an equal amount of energy (i.e.
 $E_{T}=E_{G}=E_{B}/2$
), since the barotropic mode and the first baroclinic mode are known to contain more or less comparable amounts of energy (Wunsch Reference Wunsch1997). The amplitudes of
 $a_{+}$
and
 $a_{-}$
were chosen to be equal and scaled to create the desired value of
 $E_{B}/E_{W}$
for the simulation regime of interest.
We investigated different balance-to-wave energy regimes via numerical simulations by varying the initial balance-to-wave energy ratio, i.e.
 $(E_{B}/E_{W})_{t=0}$
, out of which we start comparing three specific parameter regimes. The first case we examine was initialized with only balanced flow with no waves, i.e.
 $(E_{B}/E_{W})_{t=0}=\infty$
. Since we expect quasi-geostrophic phenomenology in this regime, we call this the ‘QG’ regime. The second regime we consider is expected to capture the dynamics of a flow whose wave and balanced fields are of comparable magnitude, i.e.
 $U_{B}\sim U_{W}$
, where
 $U_{B}$
and
 $U_{W}$
correspond to balanced and wave velocity scales respectively. This simulation was therefore initialized such that wave and balanced flow energy were equal, i.e.
 $(E_{B}/E_{W})_{t=0}=1$
and we denote this regime by ‘CW’ (for comparable wave regime). The third regime we explored corresponded to the case where the balanced flow is weaker than the waves, specifically
 $U_{B}\sim Ro~U_{W}$
, so that second-order quadratic nonlinear wave quantities of
 $O(Ro)$
strength, such as Stokes drift for example, are comparable in strength to the balanced flow. Concomitantly, we simulated this regime by initializing
 $(E_{B}/E_{W})_{t=0}=Ro^{2}$
and we denote this by ‘SW’ (for strong waves), since wave energy is asymptotically larger than balanced energy.
(For the QG regime, to get
 $(E_{B}/E_{W})_{t=0}=\infty$
, we used
 $(E_{B})_{t=0}=0.04$
and
 $(E_{W})_{t=0}=0$
. For the CW regime, we set
 $(E_{B})_{t=0}=0.04$
and
 $(E_{W})_{t=0}=0.04$
to obtain
 $(E_{B}/E_{W})_{t=0}=1$
. Finally, the SW regime was initialized as
 $(E_{B})_{t=0}=0.04$
and
 $(E_{W})_{t=0}=4$
thereby obtaining
 $(E_{B}/E_{W})_{t=0}=Ro^{2}$
.)
Figure 2 shows snapshots of the barotropic vorticity (
 $\unicode[STIX]{x1D701}_{T}$
, a), the baroclinic PV (
 $q_{C}$
, b) and the energy spectra (c) of balanced flow (
 $E_{B}$
, black) and waves (
 $E_{W}$
, red), at
 $t=30\,000$
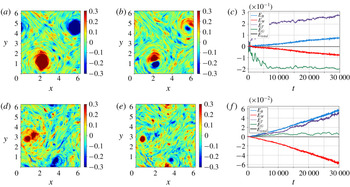
for QG (a–c) and CW (d–f) regimes. Initially, the flow in these regimes were seen to develop baroclinic instabilities, leading to turbulence characterized by small-scale structures, which gradually merged and grew, resulting in the formation of large-scale coherent vortices. At the final time corresponding to the state shown in figure 2, most of the energy is contained in the large coherent structures, with negligible small-scale features. The energy changes that accompany this process are shown in figure 3. In both QG and CW cases, the barotropic mode continuously extracts energy from the baroclinic balanced mode, as is expected in two-mode geostrophic turbulent flows (Salmon Reference Salmon1978, Vallis Reference Vallis2006). Nevertheless, the total balanced energy and the total wave energy do not show any noticeable change with time, both being separately conserved.
Top row shows (a)
 $\unicode[STIX]{x1D701}_{T}$
, (b)
 $q_{C}$
and (c) energy spectrum for the QG regime at
 $t=30\,000$
. (d–f) Shows the same quantities for the CW regime. The barotropic, baroclinic balanced and total balanced flow energy spectra –
 $E_{T}$
,
 $E_{G}$
and
 $E_{B}$
– are indistinguishable from each other, which is why only the last one is shown above.

Energy change versus time (difference in energy from
 $t=0$
) for barotropic (
 $E_{T}$
, purple); balanced baroclinic (
 $E_{G}$
, green); balanced total (
 $E_{B}$
, blue); wave (
 $E_{W}$
, red); and total (
 $E_{total}$
, black) energies versus time for QG (a) and CW (b). Notice that although the barotropic and the baroclinic balanced modes do exchange energy, total balanced energy (
 $E_{B}$
), wave energy (
 $E_{W}$
) and the total energy (
 $E_{total}$
) curves lie on top of each other, showing insignificant changes during the entire simulation.

The phenomenology differs drastically in the SW regime. During the early stages, we observed that the presence of waves inhibited vortex mergers and the formation of coherent vortices, with the balanced fields being dominated by small-scale structures. However, on much longer time scales, vortex mergers were observed to take place, although the continuous interaction between inertia–gravity waves and the vortices keeps generating a wide range of active small-scale filamentary features in the balanced flow field. Such a long time state is shown in figure 4. The PV fields shown in figure 4 may be qualitatively compared with those observed in the forced-dissipative three-dimensional simulations of Barkan et al. (Reference Barkan, Winters and McWilliams2017). Barkan et al., operating at
 $O(1)$
Rossby numbers to capture submesoscale dynamics, found that waves eroded the coherent vortices (see figures 1 and 3 there). On the other hand, in our SW regime, we observed that inertia–gravity waves affect the coherent vortices in the regime
 $Ro\ll 1$
, characteristic of mesoscales. Overall we found that the coherent structures are more common and persistent in the barotropic mode compared to the baroclinic balanced flow, the latter consisting of a lot more scattered small-scale features, as may be inferred from figures 4(a) and 4(b).
(a) The
 $\unicode[STIX]{x1D701}_{T}$
, (b)
 $q_{C}$
and (c) energy spectra for the SW case at
 $t=30\,000$
. Notice that the domain is rich with a range of small-scale structures, in addition to the large-scale coherent vortices seen in the barotropic field.

Compared to the QG and CW regimes, significant wave–balance energy exchange accompanies the changes we observed in the balanced flow fields in the SW regime, these being quantified in figure 5(a). Observe that the total wave energy (red curve) drops almost linearly with time, while the total balanced energy (blue curve) grows by an equal amount to conserve total energy (black curve). In addition to the total balanced flow gaining energy and waves losing energy, we find that the barotropic balanced mode (purple curve) gains energy while baroclinic balanced mode (green curve) loses energy. To get a better handle on the details of the interaction to uncover the energy transfer pathways, we computed all the nonlinear wave–balance transfer terms resulting in the energy exchange.
(a) Energy change versus time (difference in energy from
 $t=0$
) for barotropic (
 $E_{T}$
, purple); balanced baroclinic (
 $E_{G}$
, green); balanced total (
 $E_{B}$
, blue); wave (
 $E_{W}$
, red); and total (
 $E_{total}$
, black) energies versus time for the SW regime. Decomposition of energy change of (b) barotropic, (c) baroclinic balanced and (d) waves for the SW case based on equations (3.2).

On applying the wave–balanced flow decomposition given by (2.12) to the governing equations (2.6), we obtain evolution equations for wave and balanced fields. From these equations we form the energy evolution equations for the barotropic flow, baroclinic balanced flow and inertia–gravity waves (for example, the energy equation for the barotropic flow is obtained by multiplying (2.6a ) with the barotropic streamfunction in spectral space). The energy evolution equations for the three components take the form (the reader is referred to Davidson (Reference Davidson2013) for generic derivation of such equations and to Waite (Reference Waite2017) for a specific example)
 $$\begin{eqnarray}\displaystyle & \displaystyle \frac{\unicode[STIX]{x2202}\hat{E}_{T}(k,t)}{\unicode[STIX]{x2202}t}=\hat{T}_{TTT}(k,t)+\hat{T}_{TGG}(k,t)+\hat{T}_{TGW}(k,t)+\hat{T}_{TWW}(k,t)-{\hat{H}}_{T}(k,t), & \displaystyle\end{eqnarray}$$
 $$\begin{eqnarray}\displaystyle & \displaystyle \frac{\unicode[STIX]{x2202}\hat{E}_{G}(k,t)}{\unicode[STIX]{x2202}t}=\hat{T}_{GTG}(k,t)+\hat{T}_{GTW}(k,t)-{\hat{H}}_{G}(k,t), & \displaystyle\end{eqnarray}$$
 $$\begin{eqnarray}\displaystyle & \displaystyle \frac{\unicode[STIX]{x2202}\hat{E}_{W}(k,t)}{\unicode[STIX]{x2202}t}=\hat{T}_{WTG}(k,t)+\hat{T}_{WTW}(k,t)-H_{W}(k,t), & \displaystyle\end{eqnarray}$$
 $\hat{E}_{T}(k,t)=|\hat{\boldsymbol{v}}_{T}(k,t)|^{2}$
,
 $\hat{E}_{G}(k,t)=|\hat{\boldsymbol{v}}_{G}(k,t)|^{2}+|\hat{p}_{G}(k,t)|^{2}$
and
 $\hat{E}_{W}(k,t)=|\hat{\boldsymbol{v}}_{W}(k,t)|^{2}+|\hat{p}_{W}(k,t)|^{2}$
represent barotropic, baroclinic balanced and wave energy at a given wavenumber
 $k$
. We have grouped terms on the right-hand side based on the specific type of interaction. For example,
 $\hat{T}_{TTT}(k,t)$
refers to the sum of all nonlinear barotropic triads that project on wavenumber
 $k$
and
 $\hat{T}_{TGW}(k,t)$
represents the sum of all barotropic–baroclinic balanced–wave triads that project on
 $k$
. Similarly other terms follow. The
 ${\hat{H}}(k,t)$
terms above refer to the hyperdissipation acting at the wavenumber
 $k$
. On summing equations (3.1) over
 $k$
from
 $k=0$
to
 $k=k_{max}$
, where
 $k_{max}$
is the largest wavenumber at the chosen resolution, we get the evolution equations for the total energy of the three components. Finally, we integrate the total energy equation of each component from
 $t=0$
to
 $t=t$
to get the equations for change in corresponding energies from initial time as
 $$\begin{eqnarray}\displaystyle & \displaystyle E_{T}(t)-E_{T}(0)=E_{TGG}(t)+E_{TGW}(t)+E_{TWW}(t), & \displaystyle\end{eqnarray}$$
 $$\begin{eqnarray}\displaystyle & \displaystyle E_{G}(t)-E_{G}(0)=E_{GTG}(t)+E_{GTW}(t), & \displaystyle\end{eqnarray}$$
 $$\begin{eqnarray}\displaystyle & \displaystyle E_{W}(t)-E_{W}(0)=E_{WTG}(t)+E_{WTW}(t). & \displaystyle\end{eqnarray}$$
 $E_{TTT}$
, since the sum of all triadic barotropic interactions must not change the net energy within the barotropic mode demanding that
 $E_{TTT}=0$
. Additionally, we dropped the energy dissipation terms in the final set of equations given in (3.2), as these were several orders of magnitude lower than the other transfer terms (recall that the total energy is almost conserved in our simulations, as indicated by the black curve in figure 5
a).
In (3.2),
 $E_{TWW}$
is the sum of all triadic interaction terms involving two wave modes and a barotropic mode and is equal and opposite to
 $E_{WTW}$
, i.e.
 $E_{TWW}+E_{WTW}=0$
. A positive
 $E_{TWW}$
value means that the barotropic mode gains a certain amount of energy from waves, the latter losing the same amount of energy. Similarly,
 $E_{TGG}$
and
 $E_{GTG}$
are equal and opposite, i.e.
 $E_{TGG}+E_{GTG}=0$
, and quantify the amount of energy transferred between the balanced modes alone. A positive value of
 $E_{TGG}$
implies that the baroclinic balanced flow transfers a certain amount of energy to the barotropic mode, resulting in an equal amount of loss in its own energy, given by
 $E_{GTG}$
. Finally
 $E_{TGW}$
,
 $E_{GTW}$
and
 $E_{WTG}$
correspond to the sum of mixed wave–barotropic–baroclinic balanced triads with
 $E_{GTW}+E_{TGW}+E_{WTG}=0$
. A positive value for
 $E_{GTW}$
and negative values for
 $E_{TGW}$
and
 $E_{WTG}$
would mean that the baroclinic balanced flow gains energy from both barotropic mode and waves.
Finally, to quantify the energy budgets, we calculated fractional energy change of the three modes, T, G and W, and the various triads that appear in (3.2). We denote the fractional change associated with each of the variables in (3.2) by adding a
 $\unicode[STIX]{x1D6E5}$
in front of the variable. For example, the fractional change in the energy of the barotropic mode is
 $\unicode[STIX]{x0394}E_{T}=(E_{T}(t_{final})-E_{T}(0))/E_{T}(0)$
with
 $\unicode[STIX]{x0394}E_{TWW}=(E_{TWW}(t_{final})-E_{TWW}(0))/E_{T}(0)$
being part of it due to triadic interactions between waves and the barotropic mode alone. Similarly,
 $\unicode[STIX]{x0394}E_{G}=(E_{G}(t_{final})-E_{G}(0))/E_{G}(0)$
is the fractional change in the baroclinic balanced flow energy, where
 $\unicode[STIX]{x0394}E_{GTW}=(E_{GTW}(t_{final})-E_{GTW}(0))/E_{G}(0)$
forms a fraction of it due to triadic interactions involving waves, barotropic mode and the baroclinic balanced flow. Fractional changes due to other triadic interaction terms that are seen in (3.2) were calculated along the same lines, and will be used for the discussion that follow.
To get a handle on the energy changes in the SW regime due to different triadic interactions, we examined the time evolution of the various terms in (3.2), these being shown in figures 5(b), 5(c) and 5(d). We find that waves transfer energy directly to the barotropic mode, as seen from the strictly monotonic increase of the
 $E_{TWW}$
curve in figure 5(b) and the corresponding decrease in
 $E_{WTW}$
curve in figure 5(d) for the wave energy budget. The barotropic mode also gains energy due to the direct transfer from the baroclinic balanced mode, as can be seen from the
 $E_{TGG}$
curve and the corresponding
 $E_{GTG}$
curve in figures 5(b) and 5(c) respectively. The baroclinic balanced mode does extract some energy from the waves and the barotropic mode. Observe the monotonic increase of the
 $E_{GTW}$
curve in figure 5(c) with corresponding decreasing curves
 $E_{TGW}$
and
 $E_{WTG}$
in figures 5(b) and 5(d). However, this gain in the baroclinic balanced energy is smaller than the energy it transfers directly to the barotropic mode, leading to the net decrease in the baroclinic balanced energy. Overall we find that by the end of our simulation at
 $t=30\,000$
, the barotropic energy increases,
 $\unicode[STIX]{x0394}E_{T}=360\,\%$
, with energy gain from waves
 $\unicode[STIX]{x0394}E_{TWW}=148\,\%$
and from baroclinic balanced flow
 $\unicode[STIX]{x0394}E_{TGG}=344\,\%$
, which exceeds the energy loss via
 $\unicode[STIX]{x0394}E_{TGW}=-132\,\%$
. The baroclinic energy decreases,
 $\unicode[STIX]{x0394}E_{G}=-86\,\%$
, due to its direct transfer to the barotropic flow
 $\unicode[STIX]{x0394}E_{GTG}=-344\,\%$
exceeding its net gain from waves and barotropic flow
 $\unicode[STIX]{x0394}E_{GTW}=258\,\%$
. On the other hand, the wave energy, being significantly larger than balanced flow energy, drops only by
 $\unicode[STIX]{x0394}E_{W}=-1.4\,\%$
during this period. These quantitative energy changes are summarized in the fourth row of table 1, with the second and third rows corresponding to QG and CW regimes discussed before.
Frequency (
 $\unicode[STIX]{x1D714}$
) spectra for
 $u_{T}$
(black),
 $u_{G}$
(blue) and
 $u_{W}$
(red) for modes with
 $k=5$
in the (a) QG, (b) CW and (c) SW cases. The spectra shown above were computed by averaging the frequency spectra of 10 wavenumbers
 $\boldsymbol{k}$
that satisfied
 $|k-5|<0.01$
. In each case, the spectra were computed using a time series between
 $t=5000$
and 7000. Observe the peak at
 $\unicode[STIX]{x1D714}=5.1$
for all three cases, this being the inertia–gravity wave frequency (
 $\unicode[STIX]{x1D714}_{W}=\sqrt{1+k^{2}}$
) at
 $k=5$
. Panel (d) shows the frequency spectra of slow-balanced fields, obtained after a running time averaging operation is performed based on (3.3). Notice that the slow-balanced fields have negligible high frequency components compared with the total balanced fields shown in (c).

At this point the reader is reminded that our wave–balance decomposition as given in (2.8) and (2.12) is based on the normal modes of the linear equations (2.7). The PV fields, shown in figures 2 and 4 represents our geostrophic balanced field. In the SW regime, wave quantities which are second order in wave amplitude, such as Stokes drift for example, are comparable in strength with the balanced flow. Consequently, nonlinear wave interactions including resonant, near-resonant and non-resonant terms, would directly affect the PV. Disentangling these different wave contributions from the PV field in turbulent flow fields, such as the ones we explore, is highly non-trivial. For the QG, CW and SW regimes discussed so far, we examined the frequency spectra of all low wavenumbers up to
 $k=12$
and an example corresponding to
 $k=5$
is given in figure 6. We examined only low wavenumbers since as we shall show below, all the wave–balanced flow energy exchanges in the SW regime take place at wavenumbers
 $k\leqslant 12$
, i.e. at large scales where waves dominate over balanced flow (recall figure 4
c).
Observe in figure 6 that the linear wave frequency peak (see the red curve) stands out in all three cases – QG (a), CW (b) and SW (c) regimes. Only in the QG case, shown in figure 6(a), the waves have a second dominant contribution at low frequencies, corresponding to the ageostrophic corrections to the balanced flow that does not project on the PV. In the CW and especially in the SW case, waves have a single sharp peak corresponding to the linear wave frequency followed by a rapid decay on either side. The presence of high-frequency oscillations in the spectra of the balanced flow in the SW regime, seen in the black and blue curves in figure 6(c), is the signature of nonlinear wave interactions projecting on the balanced flow. The balanced flow in the SW regime therefore fluctuates on fast wave time scales, although a major part of the balanced energy is associated with the low-frequency ‘slow-balanced component’. To demonstrate this explicitly, especially that the energy change of the balanced flow observed in figure 5(a) corresponds to the energy change associated with the slow-balanced component, we performed a running time average of the balanced flow fields. For example, the time-averaged barotropic
 $x$
-velocity component was calculated as
 $$\begin{eqnarray}\overline{u}_{T}(\boldsymbol{x},t)=\frac{1}{\unicode[STIX]{x1D70F}}\int _{t-\unicode[STIX]{x1D70F}/2}^{t+\unicode[STIX]{x1D70F}/2}u_{T}(\boldsymbol{x},s)\,\text{d}s.\end{eqnarray}$$
We examined the slow-balanced fields for three different time averaging window lengths:
 $\unicode[STIX]{x1D70F}=10$
, 25 and 50. Figure 6(d) shows the frequency spectra of the slow-balanced fields computed after the time averaging operation was performed with
 $\unicode[STIX]{x1D70F}=50$
. It is clear that the slow-balanced field has insignificant high-frequency fluctuations. We examined the evolution of the energy of the slow-balanced component as a function of time, against the total balanced energy. This means, for example, we computed the slow-barotropic energy
 $1/2({\overline{u}_{T}}^{2}+{\overline{v}_{T}}^{2})$
and compared it with the total unaveraged-in-time barotropic energy
 $1/2({u_{T}}^{2}+{v_{T}}^{2})$
for different time averaging window lengths (
 $\unicode[STIX]{x1D70F}$
). Such a comparison is shown in figure 7 for the case
 $\unicode[STIX]{x1D70F}=50$
for the duration
 $t=5000{-}10\,000$
in the SW regime shown in figure 5(a). Observe that the slow-balanced energy curves very well approximate the total balanced energy curves. For all three averaging windows (
 $\unicode[STIX]{x1D70F}=10$
, 25 and 50) we observed that the slow-balanced energy was more than 98 % of the total balanced energy. (We present only the case corresponding to
 $\unicode[STIX]{x1D70F}=50$
in figure 7, since other cases are very similar). This confirms that although the balanced field in the SW regime consists of fast fluctuations, as was clear from the frequency spectra shown in figure 6(c), such fast fluctuations carry a negligible amount of energy and the total balanced flow is dominated by the slow-balanced component. Consequently, we conclude that the energy change associated with the balanced fields shown in figure 5(a) almost entirely coincides with the energy change associated with the slow-balanced fields, as is clear from figure 7.
Summary of numerical experiments discussed in this paper. The first, second and third columns show the experiment, initial balance-to-wave energy ratio and initialization wavenumber. The percentage changes in barotropic, baroclinic and wave energies are shown in the next three columns. Last three columns show the percentage of barotropic energy gain due to direct transfer by waves, percentage of barotropic energy gain due to direct transfer by baroclinic balanced flow and percentage of baroclinic balanced energy gain due to transfer from both waves and the barotropic mode.

In spite of the above discussion, we emphasize that although our wave–balance decomposition, based on the linear equations, robustly captures the linear waves in the SW regime, the balanced flow – this being the dynamical field in geostrophic balance and orthogonal to waves – is influenced by nonlinear wave interactions. The time averaging operation does not filter out the effect of waves on balanced flow, but rather simply allows us to define a slow-balanced flow that evolves on a slow time scale with negligible high-frequency fluctuations (recall figure 6 d). This is because nonlinear wave interaction effects would generate a slow time-averaged contribution to the PV, thus affecting the slow-balanced field. Consequently, it is important to appreciate that nonlinear wave interactions form an integral part of balanced dynamics in the SW regime. In appendix B we compare the linear wave–balanced decomposition with alternate decompositions used for NIW–balanced flow asymptotic models in recent times.
Slow-balanced energy time series for the barotropic and baroclinic modes, plotted along with total balanced energy during the time interval
 $t=5000$
–10 000 for the SW case. The purple and green curves correspond to those shown in figure 5(a). Observe that the slow barotropic energy represented by the red curve is smoother than the purple coloured total barotropic energy time series. For a similar comparison of the baroclinic balanced energy, only a few points of the slow energy are shown, by the red dots, since the slow and the total baroclinic balanced energies are indistinguishable from each other. For all three averaging windows (
 $\unicode[STIX]{x1D70F}=10$
, 25 and 50), we found that the slow-balanced energy was more than 98 % of the total balanced energy.

With the energy exchange pathways clarified, we ask – at what spatial scales do the above described transfers take place? Recall that wave energy dominates over balanced flow at large scales (see energy spectra in figure 4
c). The cross-over between wave and balanced energies take place approximately at
 $k=12$
once turbulence is fully developed, and changes only by a small amount after
 $t=5000$
. Given that the phenomenology observed in SW regime is primarily due to wave energy dominating over balanced flow, it is possible that the energy transfers described via figure 5 take place at large scales. We confirmed this hypothesis by computing all the transfer terms shown in (3.2) by restricting all the fields onto the large scales, i.e. by spectrally truncating all fields by setting
 $k\geqslant 12$
components to zero, thus retaining only large-scale dynamics,
 $k<12$
, of all fields. We did this by summing equations (3.1) from
 $k=0$
to
 $k=12$
to get the evolution equations at large scales. This was integrated over time to compute the energy change and exchanges at large scales. As seen from figure 8, the energy exchanges that occur at scales
 $k<12$
capture very well that obtained by summing over all
 $k$
. This demonstrates that all the energy exchanges seen in the SW regime takes place at large scales,
 $k<12$
, where the wave energy dominates over balanced energy and with negligible interactions taking place at smaller scales.
The energy decomposition in the SW case comparing the energy computed using all available wavenumbers (solid lines) with that using wavenumbers truncated to large scales,
 $k<12$
(dots). Panels (a–d) correspond to the four panels in figure 5, zoomed in over a short time interval from
 $t=10\,000$
to 11 000. Observe the exceptional agreement between the energy change computed using all wavenumbers and that computed using only large scales,
 $k<12$
.

Having examined the SW regime with
 $(E_{B}/E_{W})_{t=0}=Ro^{2}$
in sufficient detail, we examine two other strong wave cases: (i)
 $\text{SW}_{a}$
with
 $(E_{B}/E_{W})_{t=0}=Ro$
(initialized as
 $(E_{B})_{t=0}=0.4$
and
 $(E_{W})_{t=0}=4$
) and (ii)
 $\text{SW}_{b}$
with
 $(E_{B}/E_{W})_{t=0}=Ro^{3}$
(initialized as
 $(E_{B})_{t=0}=0.004$
and
 $(E_{W})_{t=0}=4$
). The balanced energy is respectively higher and lower in these two cases compared to the SW case we discussed before. The spatial structures of the PV fields at
 $t=30\,000$
and the energy transfers associated with these two cases are shown in figure 9, these being qualitatively similar to the SW case. In figure 9 we find small-scale features in the PV field along with waves transferring energy to the balanced flow. Comparing figures 9(c) and 5(a), we infer that energy transfer between balanced modes exceeds energy exchange between waves and balanced flow in the
 $\text{SW}_{a}$
case, relative to the SW case (notice that in figure 9(c) the separation between the red and the blue curves is smaller than that between the green and the purple curves). Since the
 $\text{SW}_{a}$
regime is sandwiched between the CW and SW regimes, we infer that the transition from the CW to SW regime is a gradual one, rather than an abrupt bifurcation, with the
 $\text{SW}_{a}$
case tending towards the SW case as the ratio
 $(E_{B}/E_{W})_{t=0}$
is decreased further. We also find that
 $\text{SW}_{a}$
case comprises of larger and more persistent coherent vortices compared with the SW case presented in figure 4. In contrast, more wave–balance energy exchange and disruption of coherent vortices is observed in the
 $\text{SW}_{b}$
regime, as can be inferred from figure 9(d–f). Although the energy transfer details in
 $\text{SW}_{a}$
and
 $\text{SW}_{b}$
regimes are qualitatively similar to the SW case (figures equivalent to figure 5
b–d are not shown, but energy transfers are quantified in the fifth and sixth rows of table 1), there is an important difference. In the
 $\text{SW}_{a}$
case, as was the case in the SW regime, the baroclinic balanced flow loses net energy, since the energy it transfers directly to the barotropic mode exceeds its energy gain from the waves and the barotropic mode, i.e.
 $\unicode[STIX]{x0394}E_{TGG}>\unicode[STIX]{x0394}E_{GTW}$
(notice the drop in the green curve in figure 9
c, similar to that in figure 5
a). In contrast, the baroclinic balanced flow gains more energy from waves and the barotropic mode in the
 $\text{SW}_{b}$
case, than the amount of energy it transfers directly to the barotropic flow, i.e.
 $\unicode[STIX]{x0394}E_{TGG}<\unicode[STIX]{x0394}E_{GTW}$
, resulting in an increase in its energy (observe the growth in the green curve in figure 9
f).
Top row shows the spatial structure of (a)
 $\unicode[STIX]{x1D701}_{T}$
and (b)
 $q_{C}$
, both at
 $t=30\,000$
, and (c) energy transfer time series for the
 $SW_{a}$
case. (d–f) Shows the same quantities for the
 $SW_{b}$
case.

Our investigation of the energy transfers in the CW,
 $\text{SW}_{a}$
, SW and
 $\text{SW}_{b}$
regimes motivate a unified view of these different parameter regimes. Consider a scenario where the flow is initialized with no balanced mode at all, i.e.
 $(E_{B}/E_{W})=0$
. Waves would feed the balanced flow and increase the
 $(E_{B}/E_{W})$
ratio. As the flow evolves, the
 $(E_{B}/E_{W})$
ratio would keep increasing, the flow thereby passing through different regimes we examined:
 $\text{SW}_{b}$
, SW and
 $\text{SW}_{a}$
. Eventually, the balanced flow would accumulate enough energy to reach the CW regime,
 $(E_{B}/E_{W})\sim 1$
, halting the wave–balanced flow energy transfers. However, simulations must proceed to much longer time scales than we have attempted here to demonstrate such gradual transitions between regimes. For example, the change in the energies of wave and the total balanced flow does not seem to diminish in the
 $\text{SW}_{a}$
regime shown in figure 9(c), even on integrating up to
 $t=30\,000$
, which corresponds to almost 20 000 eddy turnover time scales. Although we did not observe such inter-regime transitions, even during our relatively long time stimulations, we note the recent detection of such a phenomenon in a small-scale laboratory experiment. Francois et al. (Reference Francois, Xia, Punzmann and Shats2013) observed that externally forced Faraday waves, with wavelengths of the order of a few milimetres, fed two-dimensional turbulence, leading to the formation of large-scale coherent vortices in a laboratory experiment. Of course, although there is a wide range of detailed differences between our problem set at oceanic mesoscales (hundreds of kilometres) and milimetre-scale Faraday waves in the experiment of Francois et al., the qualitative phenomenology is similar: fast waves transferring energy to the slow vortical field and generating large-scale vortices. Consequently, we may think of the laboratory experiment of Francois et al. as a small-scale set-up that achieves the inter-regime transitions we discussed above within a relatively short time scale.
We finally explored the effect of initialization wavenumber in the SW regime. All the simulations discussed so far were initialized with
 $k_{0}=6$
, a low-mode initialization which gave us a range of wavenumbers for which wave energy dominated over balanced energy in the SW regime (recall figure 4
c where the wave spectrum (red) dominates over balanced spectrum (black) at large scales). Typical oceanic observations indicate a broadband distribution of wavenumbers corresponding to specific tidal frequencies (see for example Ray & Mitchum (Reference Ray and Mitchum1997) and Zhao, Alford & Girton (Reference Zhao, Alford and Girton2012) for observational data on the broad-banded spectral distribution of the
 $M_{2}$
tidal component). However, there is no generic quantitative estimate for the spectral breadth of the wavenumbers for a fixed-frequency wave field, this of course being sensitive to multiple factors, including the geographic location. Consequently, for completeness, we simulated the SW case with
 $k_{0}=3$
(
 $\text{SW}_{c}$
) and
 $k_{0}=12$
(
 $\text{SW}_{d}$
), thereby decreasing and increasing the range of wavenumbers for which wave energy exceeds balanced energy. On doing so we found the same qualitative phenomenology observed so far, with only quantitative changes in the magnitude of energy transfer. For example, in the
 $\text{SW}_{c}$
regime we found less overall energy transfer compared to the SW case, and vice versa in the
 $\text{SW}_{d}$
regime. Based on our examination of
 $\text{SW}_{c}$
and
 $\text{SW}_{d}$
cases, we infer that the energy transfer from waves to balanced flow is proportional to the range of scales for which wave energy dominates over balanced flow. Additionally, similar to the difference between
 $\text{SW}_{a}$
and
 $\text{SW}_{b}$
regimes discussed before, we found that
 $\unicode[STIX]{x0394}E_{TGG}>\unicode[STIX]{x0394}E_{GTW}$
in the
 $\text{SW}_{c}$
regime, resulting in the baroclinic balanced flow losing energy with time, while the opposite scenario,
 $\unicode[STIX]{x0394}E_{TGG}<\unicode[STIX]{x0394}E_{GTW}$
, leading to net increase in baroclinic balanced energy, was seen in the
 $\text{SW}_{d}$
regime. The energy transfers for these two cases are quantified in the seventh and eighth rows of table 1.
Based on the simulation results presented so far, and several other simulations we performed with slight change in parameter values, we conclude that, except for quantitative changes in the magnitudes of energy transfer, the following phenomenology is robustly observed in all regimes where wave energy dominates over balanced flow energy, i.e.
 $E_{B}/E_{W}\ll 1$
: The total balanced flow energy increases in all cases (
 $\unicode[STIX]{x0394}E_{B}>0$
), this being due to transfer from waves (
 $\unicode[STIX]{x0394}E_{W}<0$
). The barotropic energy was seen to increase in all regimes, since the energy it extracts directly from waves and baroclinic balanced flow (
 $\unicode[STIX]{x0394}E_{TWW}>0$
,
 $\unicode[STIX]{x0394}E_{TGG}>0$
) exceeds its energy loss to the baroclinic balanced flow (
 $\unicode[STIX]{x0394}E_{TGW}<0$
). Waves on the other hand were observed to lose energy in all regimes, to the barotropic and baroclinic balanced flow (
 $\unicode[STIX]{x0394}E_{WTW}<0$
,
 $\unicode[STIX]{x0394}E_{WTG}<0$
). The baroclinic balanced energy was seen to decrease or increase depending on whether it transfers more energy to the barotropic mode than the amount of energy it receives from waves and barotropic mode (
 $\unicode[STIX]{x0394}E_{TGG}>\unicode[STIX]{x0394}E_{GTW}$
) or vice versa. This phenomenology of the net transfers between the two balanced modes and the waves is summarized in the schematic shown in figure 10 and the simulations and the estimates of various energy transfers we reported in this paper so far are given in detail in table 1.
Energy flow pathways in SW regimes based on our investigation. The blue arrow, as in figure 1, shows direct energy transfer from baroclinic balanced flow to the barotropic balanced flow (
 $E_{GTG}$
), this being the only energy transfer that exists in freely evolving quasi-geostrophic turbulence. In SW regimes, waves transfer energy to the barotropic (
 $E_{WTW}$
) and the baroclinic balanced flow (
 $E_{WTG}$
), as shown by the two red arrows that start on the wave box. The baroclinic balanced flow extracts energy from the barotropic flow (
 $E_{TGW}$
), this being mediated by waves, and is shown by the red arrow that starts on the barotropic box. Overall, the total balanced flow gains energy while waves lose energy. The barotropic mode also gains energy whereas the baroclinic balanced flow may gain or lose energy depending on whether the energy it extracts from waves and the barotropic flow (
 $E_{GTW}=E_{WTG}+E_{TGW}$
) exceeds the energy it loses directly to the barotropic mode (
 $E_{GTG}$
) or vice versa.

4 Discussion
Traditionally, in oceanography the balanced flow was thought to be decoupled from fast propagating inertia–gravity waves, particularly so at mesoscales characterized by rapid rotation and strong stratification. Consequently, geostrophic eddies and inertia–gravity waves, such as NIWs and internal tides, are often considered to be part of separate energy budgets, with insignificant interactions between the two. Baroclinic instabilities that break up basin-scale flow into smaller scales are a major energy source of mesoscale eddies with bottom drag acting as their major energy sink (Wunsch Reference Wunsch1997; Ferrari & Wunsch Reference Ferrari and Wunsch2010). On the other hand, large-scale NIWs and low mode internal tides are thought to generate higher modes via various wave–wave interactions and thus a cascade to smaller scales and eventually dissipation by wave breaking (Garrett & Kunze Reference Garrett and Kunze2007; Alford et al. Reference Alford, MacKinnon, Simmons and Nash2016).
However, recent theoretical and numerical investigations are beginning to demand a reconsideration of above pathways. Various energetic interactions between balanced flows and inertia–gravity waves have been uncovered, at
 $O(1)$
Rossby numbers (Gertz & Straub Reference Gertz and Straub2009; Taylor & Straub Reference Taylor and Straub2016; Barkan et al.
Reference Barkan, Winters and McWilliams2017; Thomas Reference Thomas2017 and references therein) and asymptotically small Rossby numbers (Wagner & Young Reference Wagner and Young2015; Xie & Vanneste Reference Xie and Vanneste2015; Rocha et al.
Reference Rocha, Wagner and Young2018). Nevertheless, these investigations have focused primarily on high baroclinic mode NIWs. Low baroclinic mode internal tides are an important wave field and seem to have been majorly overlooked. Additionally, as discussed in the introduction, recent oceanic observations and global simulations indicate that the first baroclinic mode inertia–gravity wave energy can dominate over balanced flow at mesoscales in several parts of the ocean, inspiring this work.
Taking motivation from oceanic observations that indicate significant amounts of energy of balanced flow and internal tides in low baroclinic modes, we vertically truncated the hydrostatic Boussinesq equations to the barotropic and the first baroclinic modes to obtain an idealized model for our investigation. The two-mode quasi-geostrophic equations were seen to form a subset of our model, in the absence of inertia–gravity waves. We investigated freely evolving turbulent interactions between waves and balanced flows in the small Rossby number regime taking advantage of the two vertical mode idealized two-dimensional model. Our primary goal was in identifying the key features of the geophysical turbulence phenomenology and energy flow pathways in small balance-to-wave energy regimes, specifically in comparison to the quasi-geostrophic phenomenology.
On examining regimes with varying wave energy at large scales, we found that the balanced flow evolved according to the two-mode quasi-geostrophic dynamics even when wave energy was comparable to the balanced flow. In contrast, in regimes where balance-to-wave energy ratio was small, waves were seen to transfer energy to the balanced flow, with the balanced flow field consisting of active small-scale structures. The total balanced flow, consisting of barotropic and baroclinic components, was seen to gain energy while waves lost the same amount of energy. The barotropic mode was seen to gain energy whereas the baroclinic balanced energy could increase or decrease. The resulting energy flow pathways are represented in the schematic shown in figure 10, where the blue arrow represents balanced flow interactions alone captured by QG dynamics, whereas the red arrows represent interactions involving waves. We may therefore consider figure 10 as a more generic version of freely evolving small Rossby number geophysical turbulence phenomenology involving the interaction of a barotropic and a single baroclinic mode. A subset of this phenomenology would be freely evolving QG turbulence, consisting only of the energy transfer from baroclinic balance to barotropic balance flow. Our investigation therefore points out that inertia–gravity waves would form an important component of the geophysical turbulence phenomenology in oceanic regions with small balance-to-wave energy ratio.
An alternate interpretation of our results would be a statement on loss of balance. As seen in the physical fields of balanced components, the formation of small-scale features and disruption of coherent vortices is a persistent feature of wave-dominant regimes. This is an example of a loss of balance mechanism, i.e. the description of the flow by balanced models such as QG fails, accompanied by waves transferring energy to balanced flow, rather than extracting energy from balanced flow. Such a transfer of energy from waves to balanced flow has been observed in several previous investigations. Rainville & Pinkel (Reference Rainville and Pinkel2006) is an example that involves internal tides. On adopting a a ray tracing approach to capture long distance propagation of low-mode internal waves, Rainville & Pinkel found that the waves lost energy to mesoscale eddy field over the propagation distance. On the other hand, several studies have observed NIWs transferring energy to balanced flows. Gertz & Straub (Reference Gertz and Straub2009), for example, on examining the dynamics of wind forced oceanic gyres, found that in regions of the gyre where the balanced flow was weak, particularly at large scales, the balanced flow extracted energy from waves. In a different configuration, investigating strongly nonlinear interactions between NIWs and fronts, Thomas & Taylor (Reference Thomas and Taylor2014) found that NIWs transferred energy to geostrophic currents, this being catalyzed by parametric subharmonic instability. Finally, Nagai et al. (Reference Nagai, Tandon, Kunze and Mahadevan2015), within the framework of numerical simulations of non-hydrostatic Boussinesq equations, found that spontaneously generated NIWs transferred energy to the Kuroshio front.
The mechanism we have found in the present idealized investigation, i.e. waves transferring energy to balanced flow in low balance-to-wave energy regimes, is a new addition to the above list of examples. In addition to being a new loss of balance mechanism, the present study also shows that the balanced flow can act as a potential energy sink for low vertical mode inertia–gravity waves, such as internal tides. Although the magnitude of wave energy loss was relatively small in our simulations (notice from table 1 that the maximum loss in wave energy was 4 % observed in the
 $SW_{d}$
case), this could be important depending on other mechanisms at play. Popularly known mechanisms that lead to a down-gradient flux of low-mode internal tidal energy are scattering off oceanic bottom topographic ridges (see Johnston & Merryfield Reference Johnston and Merryfield2003; Kunze & Llewellyn Smith Reference Kunze and Llewellyn Smith2004; Lamb Reference Lamb2004 and references therein) and nonlinear wave interactions, which include parametric subharmonic instability and self-interaction of a single wave (see MacKinnon & Winters Reference MacKinnon and Winters2005; Sutherland Reference Sutherland2016; Wunsch Reference Wunsch2017 and references therein), leading to the generation of smaller-scale wave fields and ultimately resulting in dissipation. Of course, within the idealization of our set-up, which ignores topography and other wave modes, we are unable to estimate the relative importance of this new mechanism compared to other mechanisms mentioned above. A more complete three-dimensional set-up that can capture nonlinear interactions between waves, balanced flows and topography is inevitable to investigate this in great detail.
We conclude by reminding the reader the restrictions of our present set-up and the potential differences we anticipate in a fully three-dimensional investigation of SW regimes. Our investigation significantly benefited from the usage of an idealized two-dimensional model, equation (2.6), obtained by truncating the primitive equations on to a barotropic and a single baroclinic mode. The two-mode quasi-geostrophy equations formed a subset of this model. Consequently, we were able to examine how high energy inertia–gravity waves would modify the well-established quasi-geostrophy phenomenology in two dimensions. However, just like two-mode quasi-geostrophic equations, which miss important small-scale dynamics (since they allow only two vertical modes, see Vallis Reference Vallis2006), our two vertical mode system would miss key small-scale dynamics. For instance, the small-scale features that form in the balanced flow in the SW regimes could develop three-dimensional submesoscale instabilities, thereby generating smaller scales and eventually get dissipated. Such three-dimensional instabilities and small-scale energy cascades of the balanced flow are well beyond the reach of our idealized two vertical mode system.
Similarly, the truncated two-vertical-mode system, as in the case of rotating shallow water models (in the absence of shocks), lack an active forward cascade of wave energy in the weakly nonlinear (small Rossby and Froude number) regime, due to the specific form of the dispersion relationship of waves. The dispersion relationship of waves,
 $\unicode[STIX]{x1D714}=\sqrt{1+k^{2}}$
, does not allow resonant wave triads (Babin, Mahalov & Nicolaenko Reference Babin, Mahalov and Nicolaenko1997; Majda Reference Majda2002), contrary to the case in three dimensions (McComas & Bretherton Reference McComas and Bretherton1977). Additionally, as demonstrated by Ward & Dewar (Reference Ward and Dewar2010), scattering of waves by balanced modes does not change the scale of the waves, whereas in three dimensions the balanced flow can efficiently scatter waves to smaller scales (Lelong & Riley Reference Lelong and Riley1991; Bartello Reference Bartello1995). Both these mechanisms, i.e. triadic interactions among waves and scattering of waves by the balanced flow, promote a forward cascade of wave energy in three dimensions. The reduced model (2.6) lacking a forward wave energy cascade in the weakly nonlinear regime helped us in maintaining a prescribed amount of wave energy at large scales in all of our experiments (i.e. without having to externally force waves). As seen in figures 3, 5 and 9, total wave energy is insignificantly affected by small-scale dissipation – all the energy lost by wave field is gained by the balanced flow, almost entirely conserving the total energy of the system.
Above mentioned features constitute the fundamental differences between the two-dimensional turbulence phenomenology we have examined in this paper with an idealized two-vertical-mode model and the phenomenology that would be exhibited by solutions of three-dimensional Boussinesq equations. Our preliminary low-resolution simulations of the Boussinesq equations clearly demonstrate this – although we observed waves transferring energy to the balanced flow in SW regimes, as we found in the present work, wave and balanced energy cascades to smaller dissipative scales. We hope to undertake high-resolution three-dimensional wave–balanced flow interaction experiments in SW regimes and report the findings in the near future.
Acknowledgement
J.T. thanks the Postdoctoral Scholar Program at the Woods Hole Oceanographic Institution with funding provided by the Ocean Frontier Institute and the J. Seward Johnson Fund. R.Y. thanks National Science Foundation postdoctoral fellowship award AGS-1624203. The authors acknowledge high-performance computing support from Cheyenne (Computational and Information Systems Laboratory 2017) provided by NCARs Computational and Information Systems Laboratory, sponsored by the National Science Foundation.
Appendix A. Absence of shocks
The reduced model (2.6) obtained by truncating the primitive equations was not seen to develop shock-like discontinuities in the wave field, typical of shallow water models, in any of the of the simulations we examined. We have not succeeded in developing a mathematical proof to demonstrate that the gradients of the wave field would remain bounded uniformly in time, and our arguments below for the absence of shocks closely follow the discussion in Lindborg & Mohanan (Reference Lindborg and Mohanan2017).
We note that on restricting (2.6) to a single dimension (
 $x$
or
 $y$
), all the advective terms in (2.6b
) and (2.6c
) vanish, making
 $\boldsymbol{v}_{C}$
and
 $p_{C}$
evolve according to linear RSW equations. Thus in one dimension, the baroclinic field is unaffected by the barotropic field and can be exactly solved for a given initial condition. This feature is expected to play a major role in preventing shocks, since as waves begin to steepen leading to a shock formation, locally the steep wave front is approximately one-dimensional. The baroclinic equations (2.6b
) and (2.6c
) becoming linear in one dimension implies that such a steep nonlinear wave cannot be maintained by (2.6). This observation is complemented by examining the baroclinic divergence field obtained by integrating (2.6) with arbitrary initial conditions. A generic example divergence field, obtained by integrating (2.6) up to
 $t=10\,000$
with randomly chosen initial conditions for all fields, is shown in figure 11, with figure 11(a) showing the two-dimensional structure and figure 11(b) showing a cross-section through the centre of the domain. Observe that the divergence field looks continuous and smooth. In contrast, the divergence field would consist of sharp gradients and steep negative dips in a model that would develop shocks (see for example figure 8(a) in Lindborg & Mohanan (Reference Lindborg and Mohanan2017), figure 9 in Lahaye & Zeitlin (Reference Lahaye and Zeitlin2012a
) or figure 15(a) in Polvani et al. (Reference Polvani, McWilliams, Spall and Ford1994)). We did not observe such features present in shock forming models, such as RSW, in any of our simulations. These features point in the direction of potential lack of shock waves in the reduced model (2.6), although we emphasize that our conclusion is based on exhaustive exploratory numerical simulations rather than a rigorous mathematical proof.
(a) Spatial structure of the baroclinic divergence field,
 $\unicode[STIX]{x1D735}\boldsymbol{\cdot }\boldsymbol{v}_{C}$
, and (b) a cross-section of the same divergence field taken at
 $y=\unicode[STIX]{x03C0}$
.

Appendix B. Defining balance in the SW regime
Throughout this work, we separated wave and balanced fields by using an orthogonal decomposition based on the linear equations given in (2.8) and (2.12). This straightforward decomposition has the advantage that it separates wave and balanced flow in a mathematically unambiguous way, splitting the total energy, for example, into an exact sum of wave and balanced energy. This decomposition is unambiguous in the CW regime, where balanced and wave energies are of comparable strength and do not exhibit any energetic interactions. There is no confusion with regards to the balanced flow or the wave field in such regimes. In contrast, in the SW regimes, balanced flow is weaker than waves, and therefore nonlinear wave interaction terms would project on the PV field and consequently the balanced flow. Thus, although the linear wave–balance decomposition generates a ‘balanced flow’ that is strictly orthogonal to the linear wave field, this balanced component is significantly influenced by inertia–gravity waves, unlike the case in the CW regime.
The linear wave–balance decomposition may be contrasted with the linear wave–Lagrangian mean balanced flow decomposition used in asymptotic models, presented in Wagner & Young (Reference Wagner and Young2015), Xie & Vanneste (Reference Xie and Vanneste2015) and most recently by Rocha et al. (Reference Rocha, Wagner and Young2018), denoted by XV, WY and RWY respectively hereafter in this section. All these models are set in the SW regime, and therefore it is instructive to examine them in the light of our observations noted above. XV’s model captures the interaction of asymptotically small Burger number NIWs with a Lagrangian balanced flow, a reduction of which was simulated by RWY. WY further derived an evolution equation for the Lagrangian balanced flow, without restricting the wave field to NIWs. As in our case, the wave field is linear in these asymptotic models, implying that the wave energy, for instance, is the sum of linear wave kinetic and potential energies. On the other hand, by the usage of two-time-scale asymptotic expansions, a Lagrangian mean flow is derived in these models, this being the balanced field that couples with the linear wave field. It is important to observe that the Lagrangian balanced flow derived in these asymptotic models contain wave contributions, i.e. resonant quadratic wave–wave interaction terms form part of the balanced flow, justifying the term ‘wave-averaged Lagrangian balanced flow’ by WY. Therefore, the balanced flow in these asymptotic models is also affected by wave activity, similar to the balanced flow that emerges from the linear wave–balance decomposition.
We note two caveats associated with such asymptotic Lagrangian balanced flows. First, the Lagrangian mean flow is in general unbalanced. Thomas, Bühler & Smith (Reference Thomas, Bühler and Smith2018) derives the unbalanced Lagrangian mean flow for different sets of wave fields, these being tested with direct numerical simulations. Given that the asymptotic models used in XV, WY and RWY have not been tested against parent models using numerical simulations, it remains uncertain whether a Lagrangian-averaged balanced mean flow, derived using two-time-scale asymptotic analysis, would hold in general. Furthermore, for turbulent wave–balanced flow interactions described in this work, there is no guarantee that one would be able to develop a wave-averaged Lagrangian balanced flow, as in the asymptotic models of XV, WY and RWY, that would agree with the results of numerical simulations.
Second, such approximate balanced flows derived by the usage of two-time-scale asymptotics need not hold for many eddy turnover time scales. For example, our experiments were run up to several thousand eddy turnover time scales, presumably well beyond the reach of simplified two-time-scale asymptotic models. Due to these limitations, we did not pursue a linear wave–Lagrangian balanced flow decomposition in our simulations. Instead, we persisted with the straightforward and mathematically unambiguous linear wave–balance decomposition, similar to the popularly used linear wave–vortex decomposition in stratified turbulence investigations (see for example Waite & Bartello Reference Waite and Bartello2006) and the linear wave–balance decomposition of atmospheric and oceanographic observations and global-scale simulation outputs (Bühler et al. Reference Bühler, Callies and Ferrari2014; Callies, Ferrari & Bühler Reference Callies, Ferrari and Bühler2014; Rocha et al. Reference Rocha, Chereskin, Gille and Menemenlis2016).