I. INTRODUCTION
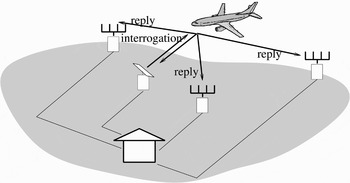
Originally denominated “Identification Friend or Foe” (IFF) during the Second World War, the secondary surveillance radar (SSR) operates on an interrogation–reply basis (while primary radars are based on echo-location). The radar emits an interrogation, eliciting from the air-planes in the illuminating beam a reply generated by an on-board SSR transponder and emitted by an omni-directional antenna. The interrogation and the reply are modulated, finite-length signals at carrier frequencies of 1030 and 1090 MHz [Reference Stevens1]. Two operational protocols currently co-exist: previously unaddressed mode A/C and newer mode S, in which the ground station selectively addresses the aircraft and permits short data communications between the ground interrogating station and the aircraft [Reference Trim2]. This new standard is intended to reduce the reply rate and will ultimately replace the mode A/C. Recently, a distributed network of receive-only stations may be added to the conventional SSR system [Reference Bezousek3, Reference Gatati4], which permits multilateration and enhanced message detection; see Fig. 1.
The distributed SSR system (from [Reference Petrochilos and van der Veen5]).

However, with distributed systems there is a dramatic increase of received replies per unit time, causing overlapping between replies and/or unsolicited replies called “squitters”. In such conditions, very often the message transmitted by the aircraft is corrupted and cannot be recovered by conventional decoders, nor can the aircraft be located and identified.
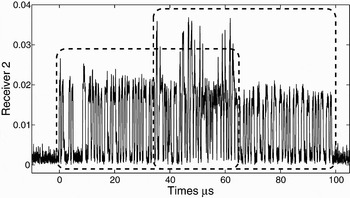
Source separation can be based on an array response matrix [Reference Roy and Kailath6], high-order statistics [Reference Comon7, Reference Petrochilos and Comon8], deterministic properties [Reference van der Veen and Tol9, Reference Petrochilos and van der Veen10] that involve joint diagonalization of a collection of symmetrical third-order tensors [Reference Petrochilos and Comon11], or the usage of the sparsity of sources [Reference Petrochilos, Galati, Mené and Piracci12, Reference Petrochilos, Galati and Piracci13]. Sparsity refers to algorithms that use the fact that a source may in fact be off a substantial percentage of time: either in the time domain or after a transformation (Fourier, wavelets, etc.) [Reference Zibulevsky, Pearlmutter, Bofill and Kisilev14–Reference Bofill and Zibulevsky16]. In [Reference Petrochilos, Galati and Piracci13], due to different times of arrival for the sources, sparsity arises at the beginning and the end of the data batch under investigation. Figure 2 presents a typical case of mixed replies, where actually two mode S (in boxes) and one mode A/C (not visible) are present.
A record overlapped replies (case W5).

But sparsity also arises when the two sources are over-lapping; indeed all SSR sources are off half the time by design. Therefore, we propose two different algorithms based on sparsity: The first algorithm is a global one that behaves roughly as a generalized Hough transform [Reference Hough17], as it attempts to map every sample over a parameter space. The second algorithm estimates and stores the parameters of interest in an inline fashion for a group of consecutive samples, and then by clustering identifies the right ones. We will demonstrate its effectiveness on a set of real data acquired by an experimental platform that we designed in TU Delft.
Section II recalls the SSR model, whereas Section III introduces the sparsity concept and how it applies to SSR. In Section IV the global algorithm is presented, and in Section V the inline one is shown, Section VI analyzes the results of the algorithms on experimental data, before concluding in Section VII.
II. DATA MODEL
We consider the reception of d independent source signals on an m-element antenna array (of arbitrary response). The baseband antenna signals are sampled at frequency 1/T S greater than the signal bandwidth and stacked in vectors x[n ] (size m). After collecting N samples, the observation model is

where X = [x[1], … , x[N]] is the m × N received signal matrix. S = [s[1], … , s[N]] is the d × N source matrix, where s[n] = [s1[n], … , sd[n]]T is a stacking of the d source signals (superscript T denotes transpose). N is the m × N noise matrix, whose elements are temporally and spatially white. M is the m × d mixing matrix that contains the array signatures and the complex gains of the sources. We assume that the replies are independent; hence E{s is j*} = 0 for i ≠ j. Independently of their protocol, mode A/C or S, the sources. s i[n], ∀i ∈ {1, … , d}, consist of a binary sequence, b i[n] with alphabet {0, 1}, modulated by a complex exponential due to a residual carrier frequency, f i:

Moreover, the two reply modes, i.e. mode A/C or S, are packet-wise of different lengths, resp. 21.7 and 64/120 µs. Therefore, it is always possible to isolate a data batch that contains the sources (see Fig. 2).
III. THE SPARSITY CONCEPT AND OUR PROPOSED METHODOLOGY
A source is sparse if either in the time domain or after a transformation, it has a significant probability to be equal to zero. Such sources can produce a mixture needing to be separated, as in, for instance, music, speech, and seismic data [Reference Zibulevsky, Pearlmutter, Bofill and Kisilev14–Reference Bofill and Zibulevsky16].
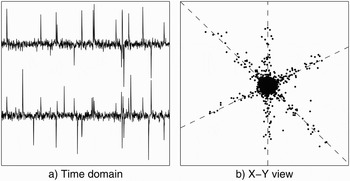
A typical problem, such as the one presented in Fig. 3, is the case of several sources with possibly less sensors (so an undetermined problem). Indeed, here we have only two sensors for three sources. Because the sources are sparse, in the X–Y domain, we can actually visually separate them. Several algorithms can then cluster and assign each source (see [Reference O'Grady, Pearlmutter and Rickard18] for a survey).
Mixture of three sparse sources onto two sensors {X, Y}: (a) time domain, and (b) X–Y domain.

Because mode S replies have a Manchester modulation, we are assured that within any time interval we take at least half of the time the source is off. For mode A/C, this ratio is even bigger by construction. So the SSR sources are naturally sparse.
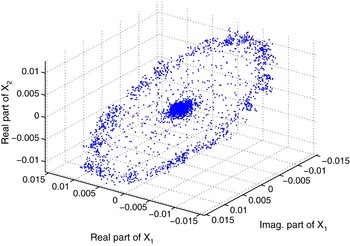
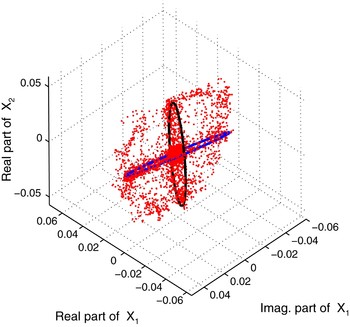
Figure 4 represents in three dimensions the I and the Q channel of the first antenna as x and y (real and imaginary parts), and the I channel of the second antenna as z of a mode S reply.
One SSR mode S reply in cartesian coordinates.

We observe that, up to the noise, the points are included in a two-dimensional subspace, i.e. a plane in a three-dimensional space. First, for an m-element array antenna, the data from a single reply are always included in a two-dimensional subspace, over a real 2m-dimensional space. Indeed let
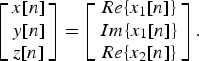
Replacing x i[n] in the noiseless case using Equations (1–2) and simplifying,

Choosing a pair {a, b} such as
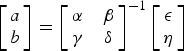
yields z = ax+by, which is a plane equation containing the origin.
Second, the measured data are consistent with the sparsity assumption: we have two clouds of data, the outer ring when the source is emitting a pulse, and the central cloud that is noise only. Note that the distribution of the absolute value of the reply is almost bi-modal, except for the leading and the trailing edge of the pulses.
Figure 5 presents the synthetic mixture of two mode S replies, q10 and s21. Given that the two sources impinge from different directions of arrival, their samples, when alone, lie on two different planes (the proof is trivial, and skipped for lack of space).
Two sources mixed, q10 and s21, in cartesian coordinates. Circles represent the positions of their outer rings alone.

Concept of the algorithms: We want to detect the direction of each plane on which the replies lie, in order to be able to separate them.
Unlike the algorithms described in [Reference Zibulevsky, Pearlmutter, Bofill and Kisilev14–Reference Bofill and Zibulevsky16, Reference O'Grady, Pearlmutter and Rickard18], which are designed for real-valued sources and detection of lines in a two-dimensional space, the most important improvement of our proposition is the ability to work with complex sources that lie on a two-dimensional plane in a 2m-dimensional space.
In this paper, we restrict ourselves to the three-dimensions case, i.e. three real dimensions over 2m, for several reasons: (1) sake of space and simplicity, (2) the global algorithm is computationally intensive to work with three dimensions in which we have to calculate a two-dimensional cost function, (3) {x, y, z} is graphically simple to visualize, so it helps to better understand the algorithm and the problem, and (4) we can take advantage of the well-known parameterization of the subspace.
But it is not a limitation; indeed the, second algorithm can be extended over more dimensions at a relatively low cost.
IV. THE GLOBAL ALGORITHM
Idea: For every possible plane in {x, y, z} space, we compute the number of samples that might belong to it, above the noise. Later, we keep as potential source plane, the ones with the highest count.
We can parameterize the planes with two angles: the polar angle and the azimuth angle, which define a vector  . As we use a space of dimension 3, the orthogonal subspace to this vector is a plane; therefore we can define any plane by its orthogonal vector
 . So counting for each possible plane means to discretize the parameter pair {θ, φ} defining
 , and calculating the count of the samples on all the pairs of this grid.
The noise may displace some samples out of their correct plane of interest, and the discretization may be too crude. Therefore, we rather do a “soft-counting” via a cost function

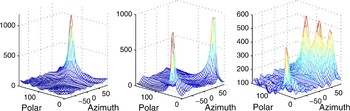
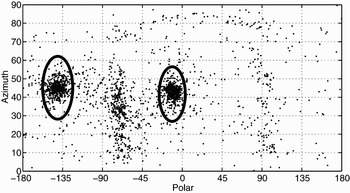
where x p[n] is the projection of the sample x[n] on the plane with normal vector in the direction (θ, φ), and σα is the accepted error on ∠(.) between the projection and the initial sample. One example of the cost function is presented in Fig. 6, where we can observe the cost function associated to each source and their mixture. One can observe already the main problem, which is the creation of spurious peaks.
Cost function for the case s21, q10, and their mixture.

The algorithm follows the steps below:
(1) Perform a singular value decomposition (SVD) on the raw data.
(2) Select the real and imaginary parts of the first component, and the real part of the second component of the data.
(3) Evaluate C(θ, φ) for each {θi, φj}.
(4) Search for the d+1 maximum values C(θ, φ).
(5) Collect the samples belonging to each plane, and use it to derive an array signature vector.
(6) By some statistical decision method, decide the d directions to be preserved.
(7) Project the data onto the directions of each plane.
Step (1) reduces the complexity of the data (we had four sensors) and whitens the data.
Step (2) is arbitrary in the choice of the components.
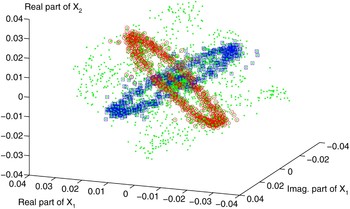
Step (5): first, for each estimated maximum of C(θ, φ), we collect the samples that exactly lie on this plane in Xi, the sub-matrix of X that contains these samples. Figure 7 draws the full set of samples, and X1, X2 as circles or squares for both sources.
Two sources mixed, q10 and s30 in cartesian coordinates: the dots are the full set of samples, whereas the squares and the circles represent the set of samples lying on the two main planes.

Next, the main eigenvector of the SVD of Xi, is the source array signature vector: mi (see for instance [Reference Petrochilos, Galati, Mené and Piracci12, Reference Petrochilos, Galati and Piracci13].
Step (6): several tests exist to decide if the detected planes are artifact or real:
• Probability distribution.
• Kurtosis equal to zero [Reference Petrochilos and Comon8].
• Bimodal distribution of the absolute value.
• Test on the eigenvalues of the previous SVD.
In this paper, we choose to keep the two directions that produce the smallest condition number for the matrix M = [mi,mj].
Step (7) is done by a Moore–Penrose pseudo-inversion:

V. INLINE ALGORITHM
The inline algorithm aims at reducing the computational cost by assuming that if a sample contains only a source, consecutive samples may also contain only the same source: let their number be L. Therefore the parameters of the plane containing these samples can be derived (see Fig. 8), and later compared.
Plane detection for the s24 case alone with L = 4.

The algorithm follows the following steps:
(1) Perform an SVD on the raw data.
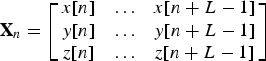
(2) For all n ∈ {1, … , N – L}, gather the sub-matrix
and evaluate the pair {θi, φj} of this plane.
(3) Perform a cluster analysis to get the most significant directions.
(4) Statistically, decide the d directions to preserve.
(5) Project the data onto the directions of each plane.
Steps (1), (4), (5): same as the global algorithm.
Step (2) is done by an SVD; indeed the orthogonal vector to the plane is the last eigenvector of the SVD (only true in {x, y, z} space). The {θi, φj} of the vector are the ones of the plane.
Step (3) is the source of computational improvement over the global solution. Indeed, step (3) of the global solution needs to discretize the parameter space of a possible plane: as the dimension increases, so does the needed number of points discretize the parameter space (in fact the number of samples is directly proportional to twice the number of samples in one dimension to the power of the number of dimensions). Conversely, adding dimensions to the clustering step is just changing the definition of the distance (between two pairs), which is just linear with the number of dimensions.
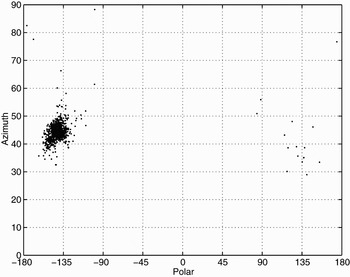
An example of the output of step (3) can be seen in Fig. 9, where the pairs calculated by step (2) are shown. Moreover, the result of the clustering is symbolized by two circles.
Plane detection for the (s24, s21) case with L = 4, and the detected clusters.

VI. EXPERIMENTAL RESULTS
A) Setup and conditioning of the data
In this seminal study, we only investigated the mixture of two mode S replies. Preliminary studies performed at TU Delft on the earlier prototypes have shown that the receivers are linear for the used dynamic range. Consequently, it is acceptable to consider the addition of two different time slots containing different mode S replies as an almost real case. The use of these semi-synthesized cases of overlapping mode S replies allows us to perform a general performance analysis of any algorithm (without being just simulations). In this experiment, we used pairs with the best initial signal to noise ratio (SNR); we mixed them so that the sources are equipowered and with a ratio to the noise of 20 dB (SNR). Thus they have an input signal to interference plus noise ratio (SINR) slightly below 0 dB (note that for one source, the other is an interference; hence the ratio is below 0 dB). We varied the time delay between the leading and the trailing reply on the range [0, 10] µs. We left the remaining frequency shift unchanged
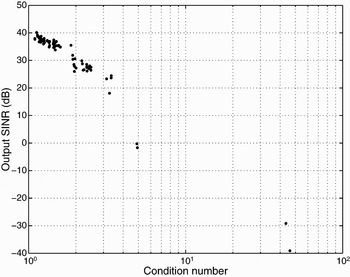
Given the different time of execution, we only used 72 pairs for the global algorithm. We first had to remove, out of these 72 pairs, four pairs that had a mixing matrix M ill-conditioned. i.e. with a bad condition number. Physically, it means that the two sources were coming from directions of arrival too near to be separated. Figure 10 presents the average replies output SINR for the global algorithm as a function of their condition number for the case of 10 µs delay; note the presence of four outliers. As this delay is large enough to ensure that there will be enough non-overlapped samples for each source, it is a measure of how well the algorithm can perform in the best condition. To compare. the PA [Reference Petrochilos, Galati and Piracci13] also works very well in such conditions.
Global algorithm: output SINR (dB) of the sources as a function of their condition number for 10 µs delay.

For the inline algorithm, we could use 42 of our recorded signals. Therefore, we had 1722 potential pairs, of which we kept the 1000 that had the best condition number.
Note that if the condition number is below 5, all sources have an output SINR well above 10 dB, which is the limit usually accepted to decode a reply, and for which the decoding will be most likely achieved.
B) Experiment with a time delay
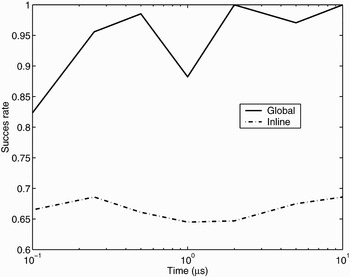
Figure 11 presents the success rate, i.e. the fraction of cases when a reply is detected and decoded, of the algorithm as a function of the delay between replies. Note that due to the log scale, it was not possible to show that the success rate is 71% for no delay. With increasing delay, the probability success improves, which is explained by the fact that there are more samples that are only with one source, and therefore with an improved estimation of the array signature vectors. At 2 µs the rate becomes acceptable for aircraft surveillance for the global one, but then the algorithm is directly in competition with the PA. Note that the MDA [Reference Petrochilos and van der Veen10] is still better for no delays. The inline version with only 65% cannot be accepted yet, but as we think it has some potential, let us note that at least the success is delay independent.
Success rate of the algorithm as a function of the delay between replies.

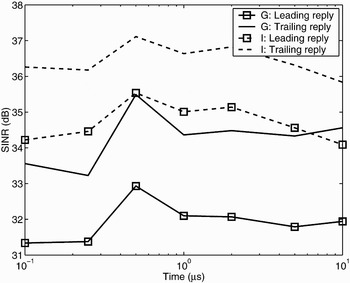
Figure 12 presents the output SINR as a function of the delay. The SINR is estimated as the ratio between the norm of projection of the unmixed signal on the source sub-space over the norm of orthogonal remaining. The average value is high enough to provide an error-free decoding. We may observe that between the trailing and leading replies, there is up to 2 dB difference; we note as well that the inline version has a 2 dB advantage over the global version.
Output SINR (dB) of the sources as a function of the delay between the replies (G: global; I: inline).

VII. CONCLUSION AND PERSPECTIVES
We proposed in this article a novel concept to separate SSR replies. The method is novel to the area of the SSR digital array, and it is also novel to the area of sparsity-based algorithms due to its ability to process complex-valued data. We have investigated the case of a mixture of two mode S replies, in which the result is very encouraging. Nevertheless, in future research, we will implement the inline algorithm over the full 2m dimensions. Also, we will study the behavior of the algorithm with both protocols, mode A/C and mode S, mixed. Like other sparsity-based algorithms, this method yields the potential to separate the under-determined problem, i.e. more sources than sensors.
 Nicolas Petrochilos received his bachelor's degree in 1994 at “Ecole Normale Supérieure de Lyon”, and obtained a Master of Science in Signal and Image Processing of E.N.S.E.A in Cergy-Pontoise in 1996, co-promoted by the E.N.S. Lyon. In 1997, he obtained the “Agregation” in Physics. In December 2002, he obtained a Ph.D. degree from Technical University Delft, Netherlands, and University of Nice, France. Throughout 2003 till 2004, he was assistant professor at ISTASE (University of Saint-Etienne, FR) and visited the University of Tor Vergata in the RADARLAB laboratory. At present, he is an assistant professor at the University of Reims, on sabbatical leave at the Queen's Hospital, HI. His research interests are algebraic methods for array signal processing and biomedical application of signal processing (MRI, heartbeat monitoring). He has co-authored 40 articles, and is a reviewer for several journals.
 Gaspare Galati received the Dr. Ing. Degree (Laurea) in 1970. From 1970 till 1986 he was with the company Selenia (now Selex S.I), where he was involved in radar systems analysis and design. From 1984 to 1986 he headed the System Analysis Group of Selenia. At the same time, he was appointed Italian Representative at the Working Groups of NATO, Eurocontrol, ICAO. From March 1986 he was associate professor of Radar Theory and Techniques at the Tor Vergata University of Rome. From November 1996 he was full professor of Radar Theory and Techniques at the Tor Vergata University of Rome, where he also teaches Probability, Statistics and Random Processes. He is senior member of the IEEE, member of the IEE, and of the Associazione Italiana per l ICT, AICT. Within the AICT he chairs the Remote Sensing and Guidance Group. He is chairman of the Signal Processing and Aerospace and Electronic Systems Chapter of the IEEE Italy and member of the Managing Committee of the Italy Section of the IEEE. His main interests are in radar theory and techniques, detection and estimation, Navigation and Air Traffic Management. He is author/co-author of over 200 papers, 16 patents, and many internal reports on these topics. He is editor of the following books: Advanced Radar Techniques and Systems, published in 1993 by Peter Peregrinus/IEE, and Tecniche e Strumenti per il Telerilevamento Ambientale, two volumes, Monografie Scientifiche del CNR (National Council of Research), 2000–2002.
 Emilio Piracci received his telecommunication engineering M.S. degree in 2005 from the University of Rome Tor Vergata, where he is actually working toward the completion of his PhD. His main interests are radar signal processing, detection and estimation, and air traffic management.