Introduction
The spatial and temporal distribution of species is typically non-random, resulting from various processes, such as biotic and abiotic factors, operating at multiple scales (Menge and Olson Reference Menge and Olson1990; Whittaker Reference Whittaker1972). These processes acting together or isolated create patterns of species distribution in space and time, which can be described by analysing species diversity measures. Based on this, species diversity can be partitioned into gamma (regional diversity), alpha (local diversity), and beta components (Whittaker Reference Whittaker1972). The latter characterises variations in species composition among sites and has been widely utilised to investigate community assembly mechanisms (Baselga Reference Baselga2010; Whittaker Reference Whittaker1972).
To depict the factors that shape communities, beta diversity can be partitioned into two components: turnover and nestedness (Whittaker Reference Whittaker1972). Turnover represents the rate of species replacement between sites, while nestedness captures dissimilarities in species gains or losses among sites (Baselga et al. Reference Baselga, Gómez-Rodríguez and Lobo2012; Legendre Reference Legendre2014). Although turnover is commonly linked to spatial species replacement driven by environmental gradients and niche filtering (Brejão et al. Reference Brejão, Hoeinghaus, Roa-Fuentes, Pérez-Mayorga, Ferraz and Casatti2021), it can also reflect selective colonisation and local extinction events when these processes cause differences in species composition among sites. In other words, both nestedness and turnover can be influenced by colonisation–extinction dynamics, depending on whether the processes result in ordered species loss (nestedness) or actual replacement by other species (turnover).
The relative importance of turnover and nestedness components in beta diversity depends on the underlying community mechanisms and processes. Studies linking beta diversity to environmental variables (e.g., climate and habitat structure) help to disentangle these mechanisms by revealing whether community differences are primarily structured by abiotic filtering, species’ niche differences, or dispersal limitations. Such analyses enhance our understanding of community assembly by showing how environmental heterogeneity, in combination with historical and biotic factors, drives both species replacement and species loss across landscapes (Ceron et al. Reference Ceron, Santana and Valente-Neto2020).
Despite the regional patterns that shape communities, such as nestedness or turnover, it can be challenging to determine the specific sites or species that contribute the most to regional beta diversity. Local Contribution of Beta Diversity (LCBD) provides a quantification of the ecological uniqueness of a site compared to others within the region (Legendre and De Cáceres Reference Legendre and De Cáceres2013). Additionally, the Species Contribution to Beta Diversity (SCBD) allows us to assess the relative importance of individual species to beta diversity across sites (Legendre and De Cáceres Reference Legendre and De Cáceres2013). Understanding the contributions of sites and species to regional beta diversity is valuable for guiding conservation efforts (Socolar et al. 2016), as it enables the identification of keystone sites and species that have a disproportionately positive impact relative to their abundance within the metacommunity (Mouquet et al. Reference Mouquet, Gravel, Massol and Calcagno2013). In the context of the Brazilian Atlantic Forest, known for its megadiversity and high endemism (Marques et al. Reference Marques, Trindade, Bohn, Grelle, Marques and Grelle2021; Mittermeier et al. Reference Mittermeier, Turner, Larsen, Brooks, Gascon, Zachos and Habel2011), it becomes even more crucial to unravel the factors shaping beta diversity.
With approximately 600 amphibian species, of which 77.6% are endemic to the region (Rossa-Feres et al. Reference Rossa-Feres, Garey, Camaraschi, Napoli, Nomura, Bispo, Brasileiro, Thomé, Sawaya, Conte, Cruz, Nascimento, Gasparini, Almeida, Haddad, Monteiro-Filho and Conte2017), amphibians in the Atlantic Forest are particularly vulnerable due to their limited dispersal capabilities, habitat dependence throughout their life cycle, and sensitivity to environmental and spatial factors (Duellman and Trueb Reference Duellman and Trueb1994; Toledo Reference Toledo, Neumann-Leitão and El-Dier2009; Vences and Wake Reference Vences, Wake and Heatwole2007; Wells Reference Wells2010). This vulnerability is mainly due to the high endemism and severe habitat loss in the Atlantic Forest, which is one of the most degraded biomes worldwide. The remarkable habitat heterogeneity within this biome, on the other hand, contributes to its high rates of amphibian species richness and endemism (Rossa-Feres et al. Reference Rossa-Feres, Garey, Camaraschi, Napoli, Nomura, Bispo, Brasileiro, Thomé, Sawaya, Conte, Cruz, Nascimento, Gasparini, Almeida, Haddad, Monteiro-Filho and Conte2017).
While many studies predominantly focus on the taxonomic component of diversity to explain beta diversity in amphibians (e.g., Moreno et al. Reference Moreno, Caldéron-Patrón, Martín-Regalado, Marínez-Falcón, Ortega-Martínez and Rosas2018; Mori et al. Reference Mori, Isbell and Seidl2018), it is important to recognise the significant differences in functional traits exhibited by amphibian species (Petchey & Gaston Reference Petchey and Gaston2002; Webb et al. Reference Webb, Ackerly, McPeek and Donoghue2002). These variations in morphology, physiology, and ecology directly influence amphibians’ dispersal abilities and their ability to occupy environments with different characteristics (Richter-Boix et al. Reference Richter-Boix, Llorente and Montori2007), reflecting their roles in ecological interactions and thus in ecosystem services. While studies focusing solely on taxonomic diversity or composition can capture strong biodiversity responses, it is essential to consider the attributes associated with ecosystem functioning, as they provide valuable insights into species contributions. For example, functional traits can reveal the degree of ecological redundancy among species, identify functionally unique or irreplaceable taxa, and detect changes in community roles that may not be apparent from taxonomic data alone (e.g., Strauß et al. Reference Strauß, Reeve, Randrianiaina, Vences and Glos2010; Tsianou and Kallimanis Reference Tsianou and Kallimanis2016). This allows us to evaluate how species replacements or losses influence ecosystem processes, such as nutrient cycling, energy flow, or trophic interactions (Lescano et al. Reference Lescano, Miloch and Leynaud2018). Therefore, integrating taxonomic components with functional traits is crucial for a better understanding of mechanisms driving amphibian beta diversity patterns along space (Dalmolin et al. Reference Dalmolin, Tozetti and Pereira2019). This integrated approach also facilitates the development of more effective conservation strategies, as the loss of functionally distinct species can have significant impacts on ecosystem processes (Dalmolin et al. Reference Dalmolin, Tozetti and Pereira2019; Nakamura et al. Reference Nakamura, Vicentin, Súarez and Duarte2020).
Given the wide range of environments in the northern region of Rio de Janeiro state, and taking into account the limited ability of amphibians to disperse, our study seeks to understand the patterns and drivers of taxonomic and functional beta diversity in amphibians, focusing on (a) the interplay of turnover and nestedness components and (b) the influence of species and vegetation types on SCBD and LCBD partitions and the impact of climatic variables on the patterns of beta diversity in amphibians. Based on this, we expect that (a) the turnover component might play a more significant role than the nestedness component in shaping the overall patterns of beta diversity in amphibians across the study area, once vegetation types are distributed along a altitudinal gradient, which can filter species distributions, (b) different species and vegetation types might influence SCBD and LCBD partitions differently, once species present different abundance and traits along vegetation types, and (c) climatic variables might have a substantial impact on the patterns of beta diversity in amphibians, influencing the composition and distribution of species across the environmental gradients, once abiotic factors have a greater impact on the distribution of anuran species (Silva et al. Reference Silva, Almeida-Neto and Arena2014).
Methods
Study area
Within the Atlantic Forest, certain areas exhibit a remarkable variety of vegetation types within a small geographic scale, such as the northern region of the Rio de Janeiro State, located in the Paraíba do Sul River delta (Fundação SOS Mata Atlântica and INPE 2021; Veloso et al. Reference Veloso, Rangel-Filho and Lima1991). This region lies entirely within the Atlantic Forest domain in southeastern Brazil, which encompasses a diverse range of habitats, including restinga, various forest environments, and altitudinal fields (Costa et al. Reference Da Costa, Fidalgo, Santos, Rocha, Metzger, Vicens, Tanizaki-Fonseca, Bohrer, Bergallo, Fidalgo, Rocha, Uzêda, Costa, Alves, Sluys, Santos, Da Costa and Cozzolino2009). The remarkable habitat variation within this ecoregion supports a rich diversity of fauna and flora, with areas characterised by high ecological amplitudes that undoubtedly contribute to regional diversity (Dorigo et al. Reference Dorigo, Vrcibradic and Rocha2018).
Field surveys of amphibian communities were conducted in 16 sites ( Figure 1) located in the north of the state of Rio de Janeiro, Brazil, covering different vegetation types of the Atlantic Forest domain, such as Montane Ombrophilous Forest (MOF), Submontane Ombrophilous Forest (SOF), Restinga (RES), Tabuleiro (TAB), and Lowland Forest (LOW) (Appendix 1). The vegetation types were classified based on the system proposed by Veloso et al. (Reference Veloso, Oliveira-Filho, Vaz, Lima, Marquete and Brazão1992), which considers, among other factors, the differences between seasonality and altitude (Appendix 2). The regional climate is tropical, with a dry winter, showing an average temperature of 23.6ºC with annual precipitation of 1,252 mm (Köppen Reference Köppen1900).
Map showing the studied areas along the northern region of the state of Rio de Janeiro. MOF = Montane Ombrophilous Forest. SOF = Submontane Ombrophilous Forest. LOW = Lowlands. RES = Restinga. TAB = Tabuleiro.

We sampled two sites in TAB, three in MOF, three in SOF, three in RES, and five sites in LOW. All surveys were conducted exclusively during the rainy season, between December 2021 and February 2022. The minimum distance among sites was 900 m between LOW1 and LOW2. The remaining sites were more than 1 km apart from each other, and the maximum distance among sites was 145 km between LOW3 and TAB1. Each site was surveyed only once by two people using the active search method (Scott et al. Reference Scott, Crump, Zimmerman, Jaeger, Inger, Corn, Woodward, Dodd, Scott, Shaffer, Alford, Richards, Altig, Heyer, Donnelly, McDiarmid, Hayek and Foster1994), and visual and acoustic encounters, and by conducting time-limited transects (Zimmerman Reference Zimmerman, Heyer, Donnely, McDiarmid and Foster1994), starting at 6 pm and ending at 10 pm, totaling 4 hours of sampled effort per site. The species and their abundance along vegetation types were registered.
Functional traits
For each species found during the survey, we characterised the following functional traits: body size, period of activity (diurnal and nocturnal), habit (aquatic, arboreal, cryptozoic, terrestrial, rheophilic, and fossorial), habitat (forested areas and open areas), reproductive mode (from 1 to 74, according to Nunes-de-Almeida et al. Reference Nunes-De-Almeida, Haddad and Toledo2021), calling site (puddle, swamp, lake, stream, forest floor, bromeliad, river, and rocky wall), and toxicity (moderate, toxic, and non-toxic). Functional traits were obtained directly from collected specimens of the studied areas deposited in scientific collections and from scientific literature records (e.g., Haddad et al. Reference Haddad, Toledo, Prado, Loebmann and Gasparini2013; Nunes-de-Almeida et al. Reference Nunes-De-Almeida, Haddad and Toledo2021) (see Appendices 3 and 4).
Climatic variables
For each sample site, we extracted 19 climatic variables (Appendix 5) from the BioClim database (Fick and Hijmans Reference Fick and Hijmans2017), with 30 arc-second resolution, approximately 1 km², using the software QGIS (QGIS 2020). These variables comprehend climate data for 1970–2000, covering the temperature and precipitation variation in the region.
Data analyses
We calculated species richness for each vegetation type by averaging the total number of species observed per site within each vegetation category (mean richness per vegetation type).
Turnover and nestedness
In order to access the values of the total beta diversity, we used a matrix of presence and absence. Then, we decomposed the total beta diversity (i.e., betasor), calculated by the Sorensen index, into turnover (i.e., betasim), here represented by the Simpson index, and nestedness (i.e., betasne), represented by the difference between betasor and betasim within taxonomic and functional components (Baselga Reference Baselga2010; Legendre Reference Legendre2014) using the function beta.multi in the betapart package (Baselga and Orme, Reference Baselga and Orme2012) for each site in the R environment (R Core Team 2024).
Local and species contributions
We first calculated the total variation of taxonomic beta diversity (BD) using beta.div function in ‘adespatial’ package (Legendre and De Cáceres Reference Legendre and De Cáceres2013). Then, we partitioned BD into species contribution (taxonomic SCBD: degree of variation of individual species across the study area) and local contribution (taxonomic LCBD: comparative indicators of the ecological uniqueness of the sites). To access functional beta diversity (hereafter functional BD), we computed the pairwise functional distances between species using the mixed-variables coefficient of distance (i.e., a generalisation of Gower’s distance), which quantifies the functional dissimilarity between all species pairs based on the suite of assessed traits (Pavoine et al. Reference Pavoine, Vallet, Dufour, Gachet and Daniel2009). A functional distance matrix was obtained using ktab.list.df and dist.ktab functions of ade4 R package (Dray and Dufour Reference Dray and Dufour2007). We partitioned functional BD into species (functional SCBD) and local (functional LCBD) contributions using the method developed by Nakamura et al. (Reference Nakamura, Vicentin, Súarez and Duarte2020). We also used multiple linear regression models to test the relationships between taxonomic and functional SCBD and LCBD components.
Climatic drivers
Using the 19 climatic variables previously obtained from the BioClim database (see Climatic variables section), we evaluated their influence on the taxonomic and functional composition of anuran communities. For this purpose, we calculated mean pairwise distances between sites. For the functional component, we used the ‘comdist’ function of the picante R package (Kembel et al. Reference Kembel, Cowan, Helmus, Cornwell, Morlon, Ackerly, Blomberg and Webb2010) based on the trait distance matrix. For the taxonomic component, we calculated mean pairwise distances using the Bray–Curtis index implemented in the vegan R package (Oksanen et al. Reference Oksanen, Simpson, Blanchet, Kindt, Legendre, Minchin, O’Hara, Solymos, Stevens, Szoecs, Wagner, Barbour, Bedward, Bolker, Borcard, Carvalho, Chirico, De Caceres, Durand, Evangelista, FitzJohn, Friendly, Furneaux, Hannigan, Hill, Lahti, McGlinn, Ouellette, Ribeiro Cunha, Smith, Stier, Ter Braak, Weedon and Borman2025). We also investigated the effect of climatic variables on taxonomic and functional matrices using a permutation-based multivariate analysis of variance (PERMANOVA) implemented in the vegan R package (Oksanen et al. Reference Oksanen, Simpson, Blanchet, Kindt, Legendre, Minchin, O’Hara, Solymos, Stevens, Szoecs, Wagner, Barbour, Bedward, Bolker, Borcard, Carvalho, Chirico, De Caceres, Durand, Evangelista, FitzJohn, Friendly, Furneaux, Hannigan, Hill, Lahti, McGlinn, Ouellette, Ribeiro Cunha, Smith, Stier, Ter Braak, Weedon and Borman2025). The analysis was performed with 999 permutations using Bray–Curtis dissimilarities. Subsequently, we assessed correlations between beta diversity dissimilarities (taxonomic and functional) and climatic dissimilarity using Mantel tests. We used Moran’s I correlograms to evaluate the degree of spatial autocorrelation of the richness in relation to the matrix of geographic distances among sites within ‘ape’ package (Paradis et al. Reference Paradis, Claude and Strimmer2004). Although the focus of the study is on changes in taxonomic and functional composition, we chose to assess spatial autocorrelation for richness as an initial synthesis metric, aiming to detect potential large-scale spatial patterns that could indirectly influence composition metrics. Given that no significant spatial autocorrelation was detected (see Results), we assumed that spatial effects would not bias subsequent analyses of beta diversity. The matrix of environmental heterogeneity was generated by calculating the mean pairwise distance among sites based on the value of the 19 bioclimatic variables per site using Euclidean distance in ‘vegan’ package (Oksanen et al. Reference Oksanen, Simpson, Blanchet, Kindt, Legendre, Minchin, O’Hara, Solymos, Stevens, Szoecs, Wagner, Barbour, Bedward, Bolker, Borcard, Carvalho, Chirico, De Caceres, Durand, Evangelista, FitzJohn, Friendly, Furneaux, Hannigan, Hill, Lahti, McGlinn, Ouellette, Ribeiro Cunha, Smith, Stier, Ter Braak, Weedon and Borman2025). The final product consisted of three distance matrices, with two of them describing taxonomic and functional beta diversity patterns and another the environmental heterogeneity. Thus, we used two Mantel tests to examine the correlation of beta diversity dissimilarities (taxonomic and functional) against environmental heterogeneity (climatic variables) using ‘vegan’ package (Oksanen et al. Reference Oksanen, Simpson, Blanchet, Kindt, Legendre, Minchin, O’Hara, Solymos, Stevens, Szoecs, Wagner, Barbour, Bedward, Bolker, Borcard, Carvalho, Chirico, De Caceres, Durand, Evangelista, FitzJohn, Friendly, Furneaux, Hannigan, Hill, Lahti, McGlinn, Ouellette, Ribeiro Cunha, Smith, Stier, Ter Braak, Weedon and Borman2025). Residuals were checked by visual inspection using histograms in R.
Results
A total of 1087 individuals, representing 62 species of anurans, were registered in 16 sites. The richness varied among vegetation types. For example, RES showed a higher richness (
 $\overline{\rm X} = 17.67$
), followed by LOW (
 $\overline{\rm X} = 12$
), MOF (
 $\overline{\rm X} = 10,67$
), TAB (
 $\overline{\rm X} = 9,0$
), and SOF (
 $\overline{\rm X} = 8$
). Except for TAB, all the other vegetation types showed exclusive species (Table 1): 13 in MOF, 10 in LOW, seven in RES, and four in SOF.
Species occurrences by vegetation type in the studied region. Lowland (LOW), Montane Ombrophilous Forest (MOF), Submontane Ombrophilous Forest (SOF), Restinga (RES), and Tabuleiro (TAB).

The total beta diversity of sites (betasor) was 0.892. Most of the differences between anuran communities’ compositions were explained by species turnover (betasim = 0.862). The values of the beta diversity components were 0.72 for beta taxonomic and 0.32 for beta functional (Figure 2A). In the taxonomic component, turnover was clearly the dominant process, whereas in the functional component, turnover and nestedness contributed almost equally, with turnover slightly higher (Figure 2B). There was no relationship between taxonomic and functional SCBD and LCBD components (p > 0.05).
A. Values of taxonomic and functional beta diversity components. B. Values of beta diversity components among vegetation types. LOW = Lowland, MOF = Montane Ombrophilous Forest, SOF = Submontane Ombrophilous Forest, RES = Restinga, and TAB = Tabuleiro.

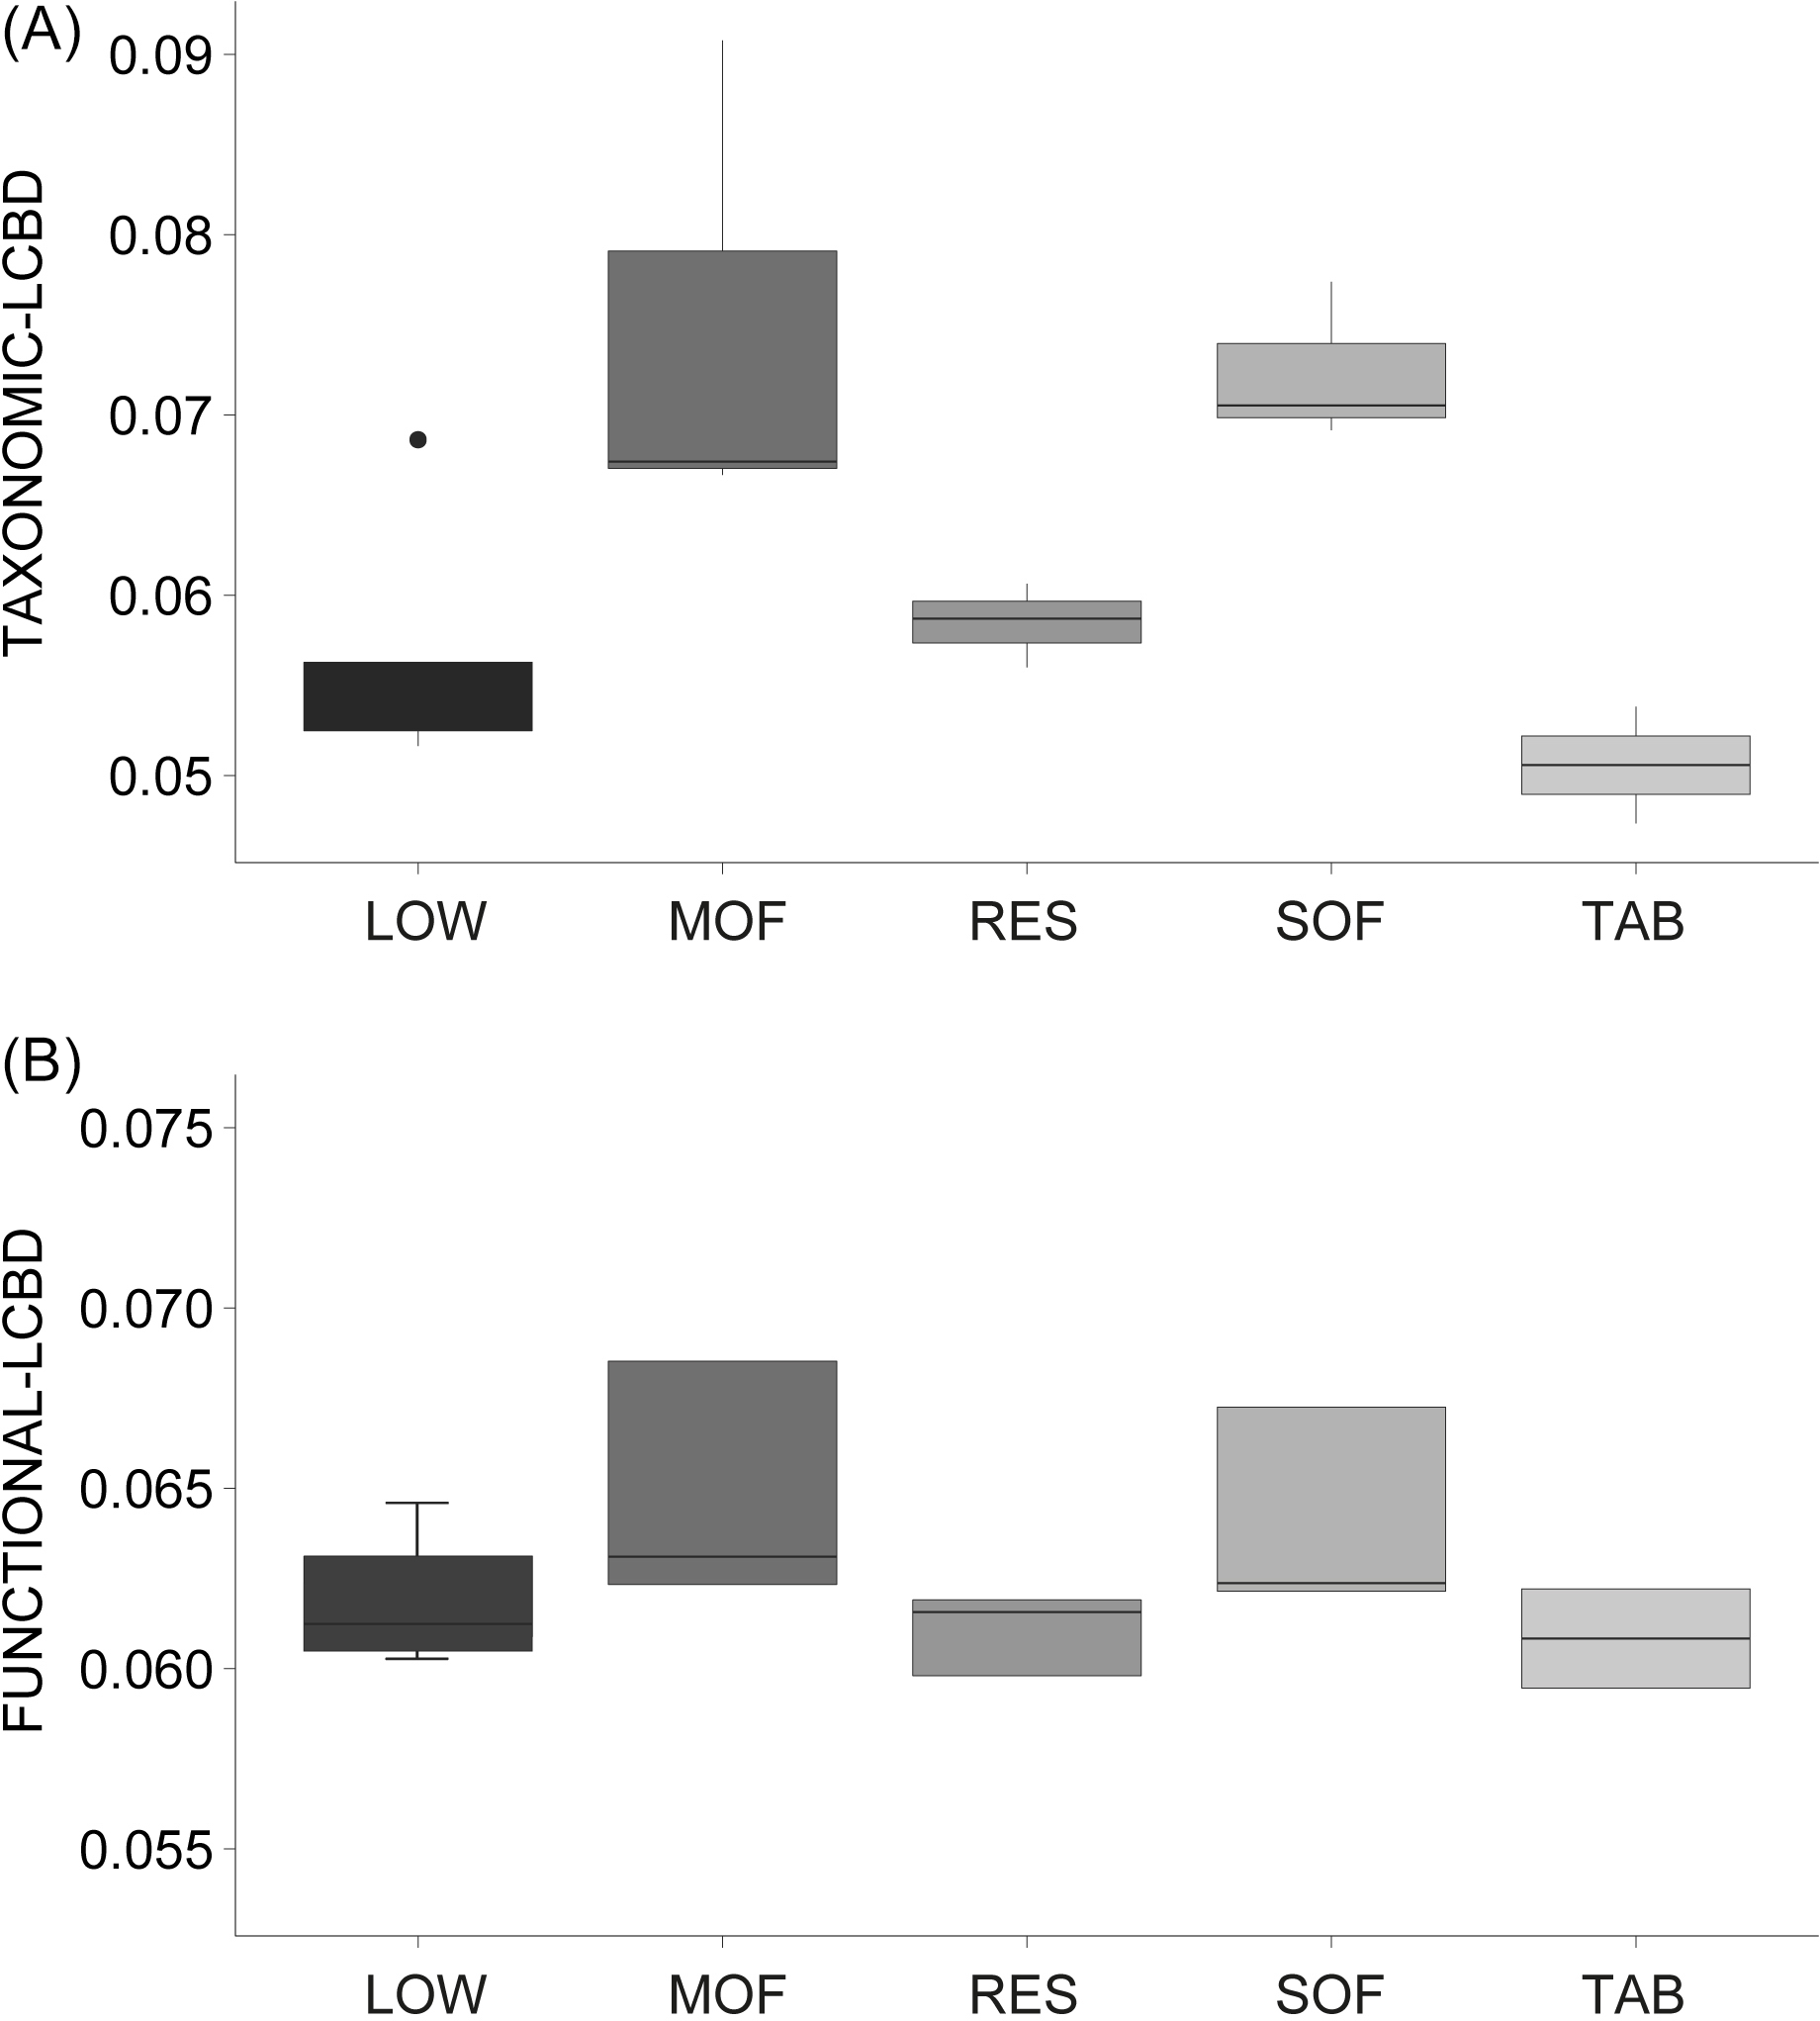
Species contribution varied among taxonomic SCBD and functional SCBD. For taxonomic SCBD, the most important species was Haddadus binotatus, followed by Thoropa miliaris and Physalaemus signifer (Figure 4A). For the functional SCBD, the most important species was Brachycephalus herculeus, followed by Hylodes sp. and Euparkerella aff. robusta (Figure 4B). The contribution of local communities to beta diversity (LCBD) ranged from 0.036 to 0.106 of the total variation in community dissimilarity for taxonomic LCBD and from 0.059 to 0.068 for functional LCBD, respectively. For taxonomic LCBD and functional LCBD, the vegetation types that most contributed were MOF and SOF, respectively (Figure 3A and 3B). There was no spatial correlation among sites (Moran’s I = −0.15). The PERMANOVA indicates that climatic variables had a highly significant effect on taxonomic (F11,4 = 4.60, p < 0.001, R² = 0.927) and functional (F11,4 = 1.21, p < 0.007, R² = 0.770) community composition, indicating that 92.7% and 77% of the variation in taxonomic and functional composition, respectively, were explained by the measured climatic predictors. In addition, taxonomic LCBD and functional LCBD were positively correlated with the climate heterogeneity, since sites with similar climatic characteristics had similar diversity values (Appendix 6).
A. Local contributions to beta diversity (taxonomic LCBD) from the five vegetation types sampled (LOW = Lowlands, MOF = Montane Ombrophilous Forest, RES = Restinga, SOF = Submontane Ombrophilous Forest, and TAB = Tabuleiro). B. Local contributions to beta diversity (functional LCBD) from the five vegetation types sampled (LOW = Lowlands, MOF = Montane Ombrophilous Forest, RES = Restinga, SOF = Submontane Ombrophilous Forest, and TAB = Tabuleiro).

A. Taxonomic SCBD shows Haddadus binotatus and Thoropa miliaris as the most important species for beta diversity. Each point in the graphic represents a species. B. Functional SCBD shows Brachycephalus herculeus as the most important species for beta diversity. Each point in the graphic represents a species. The other two most important species are Hylodes sp. and Euparkerella aff. robusta.

Discussion
We found that the variation in anuran species composition along the north of the Rio de Janeiro state can be predominantly explained by turnover in the taxonomic component, whereas in the functional component turnover and nestedness contributed almost equally. Different vegetation types exhibit distinct patterns of amphibian species richness and composition, contributing differently to LCBD. These patterns of taxonomic and functional beta diversity are driven by climatic variables and appear to be shaped by species replacement, but in the functional dimension, nestedness also plays a substantial role.
Although the number of sampling sites varied among vegetation types, all sites were sampled under a standardised and equivalent effort. However, because LCBD and SCBD metrics are derived from variance-standardised components of total beta diversity, possible differences in the number of sampled sites are unlikely to bias the estimation of these metrics (Legendre & De Cáceres Reference Legendre and De Cáceres2013). Overall, we interpret comparisons among vegetation types with caution, as uneven spatial representation can influence the detectability of compositional heterogeneity, potentially affecting turnover or nestedness values at broader scales.
Following Baselga et al. (Reference Baselga, Gómez-Rodríguez and Lobo2012), areas at low latitudes in the present climate suffered less variation in temperature during glaciation cycles, thereby maintaining a high number of species and representing centres of speciation, triggering high endemism and allowing higher species turnover. In fact, the coastal portion of the Atlantic Forest is recognised by the high endemicity of anurans, which can be related to the climatic stability of these areas during the last ages (Carnaval and Mortiz Reference Carnaval and Moritz2008). These findings are consistent with those described by Lourenço-de-Moraes et al. (Reference Lourenço-de-Moraes, Campos, Ferreira, Beard, Solé, Llorente and Bastos2019), who reported a replacement of anuran species along altitudinal gradients.
However, for the functional beta diversity, turnover and nestedness contributed almost equally, with turnover being only slightly higher. This finding implies that the functional pattern of anuran metacommunities is shaped not only by the replacement of species with different traits but also by the loss or gain of traits due to environmental filtering or physiological constraints. Such dual influence may result from both abiotic factors (e.g., climate-driven habitat suitability) and biotic interactions (e.g., competition for resources), making the functional dimension more complex than the taxonomic one. In seasonal environments, ecological interactions, such as competition, can play a pivotal role in shaping the structure of amphibian communities (Martins et al. Reference Martins, Roque, Santos, Ferreira, Stüssmann and Tomas2015). Therefore, these results suggest that different mechanisms may be driving species turnover and nestedness in different types of vegetation.
Regarding the contributions of species and vegetation types to beta diversity, we found that the functional LCBD and taxonomic LCBD had higher values in the same vegetation types. MOF and SOF contributed significantly more to functional LCBD and taxonomic LCBD due to the presence of unique community composition with unique functional traits. Despite Restinga and Lowland vegetation having the highest species richness, they share a high number of species with other vegetation types, decreasing the LCBD values, as shown by Szabó et al. (Reference Szabó, Lengyel, Padisák and Stenger-Kovács2019).
This negative relation between species richness and LCBD values was previously reported for several types of organisms, such as microbial communities (Teittinen et al. Reference Teittinen, Wang, Strömård and Soininen2017), invertebrates (da Silva et al. Reference Da Silva, Hernández and Heino2018), vertebrates (Heino and Grönroos Reference Heino and Grönroos2017; Legendre and Cáceres Reference Legendre and De Cáceres2013), and plant communities (Qiao et al. Reference Qiao, Qianxi, Qinghu, Junmeng, Franklin, Tang, Qinggang, Zhang, Bao, Yili, Liu, Xu and Jiang2015), mainly in studies that used presence and absence data (Heino and Grönroos, Reference Heino and Grönroos2017). In the northern region of the state of Rio de Janeiro, MOF and SOF are located in the mountain chain of the Serra do Mar, one of the most important areas for amphibian diversity in southeastern Brazil. These areas reveal a strong congruence of ecological and evolutionary patterns of amphibian biodiversity (Campos et al. Reference Campos, Lourenço-de-Moraes, Llorente and Solé2017). In addition, the Serra do Mar region boasts a high richness of small-ranged species and is classified as a distinct biogeographic domain for anurans (Vasconcelos et al. Reference Vasconcelos, Prado, Da Silva and Haddad2014).
On the other hand, Restinga and Lowlands had a high number of widespread species. A similar pattern of congruent taxonomic and functional LCBD values has been found in bird communities in Mediterranean olive groves (García-Navas et al. Reference García-Navas, Martínez-Núñez, Tarifa, Molina-Pardo, Valera, Salido, Camacho and Rey2021). For invertebrates such as ants in drylands, Frasconi Wendt et al. (Reference Frasconi Wendt, Ceia-Hasse, Nunes, Verble, Santini, Boeiro and Branquinho2021) also observed simultaneous effects on both dimensions of beta diversity. Commonly, complex environments with water availability tend to have higher taxonomic beta diversity, with functional beta diversity not always responding in the same way (Rosas-Espinoza et al. Reference Rosas-Espinoza, Peña-Joya, Álvarez-Grzybowska, Godoy-González, Santiago-Pérez and Rodríguez-Zaragoza2022).
The SCBD partitions were influenced by different species. For taxonomic SCBD, the most important species were Haddadus binotatus (found in MOF, SOF, and TAB) and Thoropa miliaris (found in MOF and SOF). Despite being common, the species that most contributed to taxonomic SCBD were not those found in the largest number of sites or vegetation types. In fact, these species are in an intermediate position of site occupation and vegetation types. Similar findings were presented by Pozzobom et al. (Reference Pozzobom, Heino, Brito and Landeiro2020) in a study about macrophyte beta diversity, where the species that most contributed to beta diversity were those that occurred at approximately half of the surveyed sites. The same pattern was also observed for insects (Heino and Grönroos Reference Heino and Grönroos2017) and amphibians from a subtropical Atlantic Forest (Mariotto Reference Mariotto2020).
On the other hand, for functional SCBD, the most important species were Brachycephalus herculeus, Hylodes sp., and Euparkerella aff. robusta, all found only in one site and one vegetation type (MOF) but exhibited infrequent functional traits among amphibians found in the studied area. For example, Hylodes sp. is one of the few species in the study area that exhibits diurnal behaviour and is the only one that deposits its eggs in subaquatic chambers (De Sá et al. Reference De Sá, Canedo, Lyra and Haddad2015). In turn, Brachycephalus and Euparkerella species are small, present direct development, and in general are microendemic, occurring on specific mountaintops (Hepp et al. Reference Hepp, Carvalho-E-Silva, Carvalho-E-Silva and Folly2015; Ribeiro et al. Reference Ribeiro, Bornschein, Belmonte-Lopes, Firkowski, Morato and Pie2015). Despite their restricted distribution, these species together influence only 2.06% of the taxonomic SCBD, reinforcing that the ecological role of rare species may go unnoticed when SCBD is not partitioned into taxonomic and functional components, as demonstrated by Pozzobom et al. (Reference Pozzobom, Heino, Brito and Landeiro2020).
Regarding the influence of climatic variables, we found that taxonomic LCBD and functional LCBD were positively correlated with climatic variables through PERMANOVA and Mantel tests. The different requirements among species can lead to some differences in community responses to environmental variables when dispersal is limited (Leibold et al. Reference Leibold, Holyoak, Mouquet, Amarasekare, Chase, Hoopes, Holt, Shurin, Law, Tilman, Loreau and Gonzalez2004). In this sense, climatic constraints can act as a biological filter to the establishment of species, creating different patterns of species distributions along a gradient of vegetation types and climate, where similar abiotic variables result in similar composition. An analogous result was found by Wang et al. (Reference Wang, Legendre, Soininen, Yeh, Graham, Stegen, Casamayor, Zhou, Shen and Pan2019), where LCBD of stream bacteria, diatoms, and macroinvertebrates was linked to site temperature, indicating a high sensitivity of this metric to environmental constraints.
Finally, our surveys were conducted exclusively during the rainy season, with a single sampling event per site. Because of this, we did not account for potential seasonal differences in our analyses. Future studies including temporal replication would allow a more comprehensive evaluation of seasonal beta diversity dynamics and the temporal stability of community composition.
Our integrated analysis of taxonomic and functional beta diversity reveals that different ecological processes shape anuran community assembly in the northern Atlantic Forest of Rio de Janeiro. While taxonomic patterns were dominated by turnover, functional patterns were shaped almost equally by turnover and nestedness, indicating that both species replacement and trait loss/gain influence community structure. This dual perspective provides a more complete understanding of the mechanisms driving biodiversity patterns, highlighting the value of incorporating functional attributes into beta diversity assessments to better inform conservation planning in threatened biomes such as the Atlantic Forest.
Conclusion
This study revealed that amphibian diversity among different vegetation types is primarily attributed to turnover across all evaluated partitions. In the functional component, however, nestedness contributed almost equally, indicating that both species replacement and the gain or loss of traits shape community patterns. This highlights the importance of species replacement as the main mechanism driving both taxonomic and functional beta diversity patterns in the region.
Our results emphasise that preserving different vegetation types is crucial for maintaining the diversity of amphibians, as different vegetation types contribute differently to taxonomic and functional beta diversity. MOF and SOF played a central role as areas of ecological uniqueness, hosting species with restricted distributions and distinctive functional traits, while Restinga and Lowland areas were richer in widespread species, contributing less to LCBD.
Furthermore, our study highlights the importance of considering both taxonomic and functional diversity to understand the distribution of amphibians and develop effective conservation strategies. This dual perspective reveals underlying ecological processes that would remain undetected if only one biodiversity dimension were assessed, providing a more mechanistic understanding of community assembly. By partitioning beta diversity, we were able to detect the disproportionate contribution of functionally unique or microendemic species that might be overlooked in analyses based solely on taxonomic richness.
Preserving not only species richness but also functional diversity, which is related to ecological processes, is essential for the long-term conservation of amphibian communities. Additionally, understanding the different mechanisms driving species turnover and nestedness in different types of vegetation can serve as a valuable basis for developing conservation strategies aimed at preserving amphibians and their habitats.
Future research could further explore the ecological implications of these findings, particularly regarding how functional traits mediate species responses to environmental change. Patterns of species turnover and trait distribution may help predict the vulnerability of communities under scenarios of habitat loss or climate shifts.
Overall, our study provides valuable insights into the distribution and conservation of amphibians in the Atlantic Forest, demonstrating that integrating taxonomic and functional beta diversity metrics can improve our ability to identify priority areas and processes for conservation. It highlights the importance of preserving all forest remnants in the state of Rio de Janeiro, which, despite being exploited and anthropised, has areas with great diversity, supporting the presence of unique species in almost all studied vegetation types, new species for science, and the occurrence of new species for the state.
Supplementary material
The supplementary material for this article can be found at https://doi.org/10.1017/S0266467425100382.
Acknowledgements
The authors thank C.A.C. Braga, F. Valente-Neto and R.V. Granzotti for suggestions on a previous version of the manuscript. The authors are also grateful to the reviewers for their constructive comments, which greatly improved the quality of this work. CHON thanks Fundação Coordenação de Aperfeiçoamento de Pessoal de Nível Superior for his master’s scholarship (CAPES – Finance Code 001). KC and DJS thanks Conselho Nacional de Desenvolvimento Científico e Tecnológico for their research fellowships (CNPq 444240/2024-1 and 311284/2023-0, respectively).
Financial support
This study was supported by the Coordenação de Aperfeiçoamento de Pessoal de Nível Superior (CAPES) (C.H.O.N., Finance Code 001) and the Conselho Nacional de Desenvolvimento Científico e Tecnológico (CNPq) (K.C. grant 444240/2024-1; D.J.S., grant 311284/2023-0).