Speakers' use of manual gestures are strongly linked with speech in many ways (McNeill, 1992). Gestures are usually produced at the same time as similar-meaning speech (Krauss, Morrel-Samuels, & Colasante, 1991; McNeill, 1992). For example, someone talking about “rolling down” might make a rolling gesture that moves slightly downward (Kita & Özyürek, 2003). Researchers have not yet reached a consensus about the function of gestures. Some researchers have suggested that gestures are a pathway to lexical meaning (e.g., Krauss et al., 1991), whereas others have argued that gestures are involved in the conceptual packaging of messages (e.g., Kita, 2000). Others have suggested that people gesture to provide substantive information to listeners (see Goldin-Meadow, 2003; Kendon, 1994) or help listeners decode unusual word combinations (Beattie & Shovelton, 2000). From the variety of suggested functions it is possible to infer that gesture, like speech, fulfills multiple functions (Goldin-Meadow, 2000).
Of particular interest to the present study is the growing evidence that gestures play an important role in accessing language, particularly when tasks are cognitively difficult or complex (Kita, 2000; Krauss & Hadar, 1999). The effect of task difficulty or complexity might be because of speakers searching among different possible ways of phrasing their message (Kita, 2000). Some studies have shown that gestures are more likely to be used with difficult tasks than easy ones, and that gestures may even help people find solutions in tasks (Alibali, Kita, & Young, 2000; Goldin-Meadow, Nusbaum, Kelly, & Wagner, 2001; Kita, 2000). For example, Alibali et al. (2000) reported that children were more likely to use gestures when solving a difficult Piagetian problem than when simply describing the experimental display, even though the language used in both situations was fairly similar. In another study, Frick-Horbury and Guttentag (1998) showed that participants who were in a tip of the tongue state were more likely to find the sought-for word when allowed to gesture than when not allowed to gesture (see also Ravizza, 2003). Other researchers have shown positive correlations between adult speakers' gesture rate and the number of scenes from a story they retell (Nicoladis, Pika, & Marentette, 2007). These researchers suggest that retelling a long story is a complex task, which is why there is an increase of gesture use with the number of scenes.
In discussing the link between gesture use and task difficulty or complexity, researchers have considered whether there might be some kinds of gestures that are particularly helpful in accessing language. Some researchers have argued that the link might be particularly strong with iconic gestures, gestures that resemble the referent in some way (McNeill, 1992). For example, a speaker might gesture the form of a beak opening and closing to refer to a bird. Iconic gestures might help access difficult concepts particularly when the concepts are concrete (e.g., Bub, Masson & Bukach, 2003). Iconic gestures may be particularly helpful in accessing conceptual or linguistic information that has a visuospatial component (Hadar & Butterworth, 1997; Krauss & Hadar, 1999; McNeill, 1992). However, in the above studies, other kinds of manual movement have been linked to aiding language access, including pointing (see Alibali et al., 2000) and tapping (Ravizza, 2003). It is possible, then, that the gestures aid language access not so much through shape resemblance but through movement. The question as to whether there is a particular kind of gesture that is helpful to language access remains to be resolved.
The link between gesture use and task difficulty or complexity might lead one to expect that bilinguals or second language (L2) learners would use more gestures in their weaker or L2 (see Krauss & Hadar, 1999). However, the results of studies to date do not unambiguously support this expectation. Adult L2 learners tend to use more deictic gestures (i.e., pointing or other gestures indicating a stable location) in their second or weaker language than their first or stronger (Gullberg, 1999; Marcos, 1979; Sherman & Nicoladis, 2004). The results with iconic gestures are less straightforward. One study with intermediate French–Swedish bilinguals showed that more iconic gestures were used with their first language (L1) than their L2 (Gullberg, 1999). However, Marcos (1979) showed that the rate of representational movements of Spanish–English bilinguals with a clear dominant language did not differ significantly when they were speaking their nondominant and dominant languages. In a study with advanced Spanish–English bilinguals, adults used iconic gestures at equal rates in both their L1s and L2s (Sherman & Nicoladis, 2004). Taken together, the results of all these studies do not unambiguously support the idea that bilinguals gesture more in their L2. Although bilinguals use more deictic gestures in their L2, they do not use more iconic gestures in their L2.
It is possible that gesture use is not linked directly to bilinguals' proficiency in a language but rather to the task that the speaker undertakes in each language. Robinson (2001) argued that it is important to distinguish between task complexity, or the cognitive variables such as attention and memory required to do a task, and task difficulty, or the learners' attributes such as proficiency, prior knowledge, and affective state. According to this distinction, a bilingual could perform the same task in his/her two languages but find the task more complex in his/her weaker language. It seems likely that task complexity and difficulty interact. If so, then the inconsistent results with adult bilinguals' gestures might be because of the bilinguals' proficiency in interaction with the task they are asked to perform. Studies with bilingual children could shed some light onto why the results with adults are variable. French–English bilingual preschoolers produced longer utterances when using iconic gestures than when using deictic gestures or no gestures (Nicoladis, 2002; Nicoladis, Mayberry, & Genesee, 1999). The same pattern held for the children's dominant and nondominant languages, although the utterances in the nondominant language were shorter than in the dominant language. These results suggest that there is a connection between gesture use and production of more complex language (as measured in these studies by length of utterance). Researchers in the studies with adult bilinguals have not attempted to measure or control for task complexity.
In the present study, the primary purpose was to test if intermediate bilinguals used more gestures in their L1 or L2. We also explore the possibility that gesture use corresponds to task difficulty and complexity. To analyze task difficulty, we compared participants' gesture use in their L1 and their L2, under the assumption that the same task would be more difficult for speakers in their less proficient L2 (Robinson, 2001). We measured task complexity in this study by counting the number of scenes participants recalled. Story recall is known to be a challenging task, involving first the creation of visuospatial schemas and then sequencing the events in a coherent order (Gibbons, Anderson, Smith, Field, & Fischer, 1986; Rubin, 1995). We assumed that the more scenes that people included in their retelling, the more attention and memory demands they had taken on in this task (following Nicoladis et al., under review). As a general rule, researchers tend to assume that the more information that is to be recalled, the harder the task (e.g., Signorella & Liben, 1984). Another purpose of this study was to explore the possibility of gender differences. Before turning to possible predictions about gender and gesture use, we briefly review evidence for gender differences in language acquisition and gesture use.
GENDER DIFFERENCES IN LANGUAGE ACQUISITION AND GESTURE USE
A number of studies have reported gender differences in both L1 and L2 proficiency. In L1 acquisition, girls sometimes score higher than boys on a variety of measures of linguistic ability, including vocabulary, syntactic, and pragmatic measures (e.g., Bauer, Goldfield, & Reznick, 2002; Bornstein, Hahn, & Haynes, 2004; Maccoby & Jacklin, 1974; Thompson & Moore, 2000; Tse, Kwong, Chan, & Li, 2002). These differences are usually small but can be fairly stable between 1 and 7 years of age (Bornstein et al., 2004). Six-year-old girls also show a tendency to tell longer stories than boys, both in Chinese and English (Wang & Leichtman, 2000).
Gender differences have also been reported in many aspects of L2 learning (Nykios, 1990; Wen & Johnson, 1997; see Ekstrand, 1980, for a review). For instance, one study reported that Chinese L1 males outperformed females on an L2 vocabulary recognition task (Boyle, 1987; see also Ho, 1987). For production tasks, research has generally shown a female advantage. For example, female English as a first language (EFL) students in Hong Kong outperformed males on a production task (Ho, 1987). For Chinese EFL students, females modified their pronunciation in such a way to make their speech more comprehensible to their listener while males did not (Lin, 2003).
Explanations of these gender differences in first and L2 acquisition have tended to focus on why there is a female advantage in verbal tasks, even though not all studies have shown a female advantage (see discussion in Bornstein et al., 2004). Some researchers attribute the difference to women being more socially interactive and/or sensitive than males in their L1 (e.g., Bacon, 1992; Lin, 2003). Other researchers have attributed the difference to cognitive style (Nykios, 1990; Wen & Johnson, 1997), as well as hemispheric lateralization and language socialization patterns (Boyle, 1987). However, most researchers assume that biological, psychological, and cultural variables generate a melting pot for the development of gender differences (e.g., Tse et al., 2002).
In addition to the gender differences observed in language acquisition, some gender differences have been observed in adults' nonverbal communication. For example, one study showed that men tended to make more body movements when interacting with women than did women (Bente, Donaghy, & Suwelack, 1998). Those body movements were not necessarily meaningful, communicative attempts. When examining only the meaningful gestures used in retelling a story in English, Hostetter and Hopkins (2002) found that women gestured more than men. The greater use of meaningful gestures by women could be related to a more general facility with nonverbal communication. Analyzing several previous studies, Hall (1979) showed that women showed a small but reliable advantage over men in encoding and decoding nonverbal expressions of emotion. Hall (1979) considered several possible reasons for gender differences and could not reach a strong conclusion. Hostetter and Hopkins (2002) argued that women might be more expressive in their storytelling styles than men.
Gender differences have been observed both in language acquisition and in nonverbal communication. Given the connection between speech and gesture use (e.g., McNeill, 1992), we could expect that women would use more gestures than men in their L2, as has been found for L1 use (Hostetter & Hopkins, 2002).
THIS STUDY
We posed three research questions. Does gesture use correspond to task difficulty, specifically proficiency? In this study, we compared the participants' gesture use in L1 and L2, with the assumption that they were more proficient in their L1. Note that there have been divergent findings in the literature, with some studies showing a greater use of iconic gestures in L1 (Gullberg, 1999) and others showing no difference (Marcos, 1979; Sherman & Nicoladis, 2004). All of these studies showed that bilinguals used more noniconic gestures in their L2.
Does gesture use correspond to task complexity? As we noted earlier, we operationalized task complexity for this study as the length of the stories participants chose to tell. We measured the length both in terms of word tokens they used and in terms of the number of scenes from the cartoon they included in their retelling. We assumed that telling a story would be more difficult in L2 than in L1, and that the greater number of scenes included within a language would correspond to greater task complexity. If gesture use corresponds to task complexity, the participants' gesture use would be correlated with the number of scenes they included as well as the number of word tokens they produced. We assumed that task complexity would interact with task difficulty so that we expected these correlations to hold within each language.
Are there gender differences in gesture use, in either L1 or L2? Gender differences have been reported for monolingual English-speaking adults (Hostetter & Hopkins, 2002), so we might find gender differences in L1. Before analyzing the results of gesture use in L2, it is important to check if women tell longer stories than men in their L2, as a gender difference in story length has been reported for L1 acquisition (Wang & Leichtman, 2000). If so, then the gender differences in gesture use might be more pronounced in L2 than has been found for L1 (Hostetter & Hopkins, 2002).
METHODS
Sixteen adults whose L1 was Chinese and whose L2 was English participated in this study. On the basis of their speech prior to the recordings as well as the speech during the recordings, all of the participants were judged as intermediate speakers of English by the first author, who has worked extensively with L2 learners in a research capacity. The average age of all participants was 33.1 years (SD = 3.5). All had grown up in Mainland China and moved to an English-speaking country in late adolescence or early adulthood. All participants spoke Mandarin Chinese, and many spoke an additional local dialect of Chinese. On average, they had lived for 4.6 years (SD = 3.4) in an English-speaking country. Most of the participants were graduate students at the University of Alberta and had passed the TOEFL test,1
The minimum entrance score on the TOEFL at the University of Alberta is 237 (computer based) or 580 (paper based).
Eight of the participants were male and eight were female. There was no difference (t<1) in age between the two groups; the men averaged 33.0 years (SD = 3.2) and the women 33.6 years (SD = 4.5 years). On average, the men had lived in an English-speaking country slightly longer (M=5.7 years, SD = 3.0) than the women (M=3.5 years, SD = 3.6), but this difference did not reach significance, t(10)=1.34, p=.20.
Procedure
All participants watched the same 6 min of a Pink Panther cartoon, which consisted of two separate stories. We chose this task because people often gesture when retelling a cartoon (McNeill, 1992). To be consistent with two other recent analyses (Marentette et al., 2007; Nicoladis et al., 2007), the present study focuses on part of the first story, titled “In the Pink of the Night.” In this cartoon, the Pink Panther tries a variety of ways to get rid of a noisy cuckoo bird but ends up making friends with the bird.
Participants were told that we were interested in how people with different linguistic backgrounds and from different cultures retell stories. They were asked to watch the cartoons carefully, because they would later retell the stories to someone who had never seen it. After viewing both stories, the participants described what they had seen to a listener who pretended to be unfamiliar with the cartoons. The participants told the stories in English to a native speaker of English and in Chinese to a native speaker of Mandarin Chinese. The retelling of the stories was videotaped. The two language sessions were on two different days, usually separated by at least a week, with the order of the languages counterbalanced.
Transcription of speech
For the English sessions, a native English speaker transcribed the speech on the videotapes in normal English orthography. For the Chinese sessions, a native Chinese speaker transcribed the speech on the videotapes in Pinyin (a Roman alphabetic script used by Chinese speakers to write Chinese). Compound words were written as one word. The Chinese was glossed into English, following Wang and Leichtman (2000).
Coding of gestures
To code the different kinds of gestures participants used, we followed the taxonomy developed by McNeill (1992). Gestures were therefore classified according to the following three categories: iconic gestures, deictic gestures, and conventional gestures.
Conventional gestures are established by the conventions of specific communities, and can usually be understood without speech. For example, the “thumb-up gesture” is used in some cultures to signal “okay.” One of the most common conventional gestures we observed in this study was a flipped-hands gesture meaning “I don't know” or “all gone.”
Deictic gestures create locations in gesture space for abstract concepts or relationships, for example, an index finger pointing to the imaginary location of the Pink Panther's house.
For the purposes of analysis, we collapsed the conventional and deictic gestures as “noniconic” gestures. We did this for two reasons. First, with rare exceptions (e.g., Pika, Nicoladis, & Marentette, 2006), conventional and deictic gestures are often used in similar ways. For example, bilingual children used conventional and deictic gestures (but rarely iconic gestures) in the absence of speech to communicate with someone who spoke their weaker language (Nicoladis, 2002). Another example comes from Krauss and Hadar (1999), who argue that deictic and conventional gestures might function primarily for communication while iconic gestures might function primarily for helping the speaker access words. Second, another reason to collapse these two gesture categories is that, in a storytelling situation, speakers typically use few of these gestures, as we have defined them here (see, e.g., Pika et al., 2006; Sherman & Nicoladis, 2004).
Iconic gestures resemble the referent in some form and manner, such as pressing thumb and index finger together and performing a circling movement to indicate tying a string around the beak of the cuckoo bird. We included as iconic, gestures that are abstractly related to the referent, sometimes called metaphoric gestures (McNeill, 1992). For example, a circling movement of the index finger to indicate “time passing” would literally indicate a clock. We included metaphoric gestures as iconic gestures because there is no evidence that speakers use concrete iconic and metaphoric gestures differently (Krauss & Hadar, 1999); other categorization schemes collapse across this distinction (e.g., Marcos, 1979) and rates of interrater reliability between these categories have been low in our lab.
Note that we also coded for beat gestures, repetitive gestures often used for emphasis (McNeill, 1992), but did not include these in the analyses because they have not yet been linked with linguistic access. Gestures that could not be classified into one of the above included categories (i.e., conventional, deictic, iconic, or beats) were classified as “unknown” and discarded from any further analysis. There were few gestures classified as unknown in either English (M=0.7, SD = 1.0) or in Chinese (M=0.5, SD = 0.9). There were no significant differences in the number of gestures used by men and women that were classified as unknown in either English (men, M=0.5, SD = 0.8; women, M=0.8, SD = 1.2) or Chinese (men, M=0.7, SD = 1.2; women, M=0.3, SD = 0.5), F(1, 10)=1.08, ns.
To check for interrater reliability of the gesture codes, two randomly chosen transcripts were coded for gestures by a second coder. One of the transcripts happened to be in Chinese and the other in English. The two coders were in 100% agreement for when the two speakers gestured and what kind of gesture the speakers used for the kinds of gestures included in the analyses.2
In other words, in this case, the two coders disagreed on the number of beats used by the two speakers. The first coder saw none at all and the second coder saw many.
Gesture rate
Previous research has shown correlations between the number of word tokens people use and the number of gestures (e.g., Sherman & Nicoladis, 2004). In order to control for individual differences in length of stories (following Marcos, 1979; Pika et al., 2006; Sherman & Nicoladis, 2004), we divided the number of gestures people used by the total number of word tokens they used to tell the story and multiplied by a hundred. This manipulation results in the percentage of word tokens accompanied by gestures. We refer to this measure as the gesture rate.
Word tokens
In counting word tokens in both English and Chinese, we excluded all repetitions and one- to two-word reformulations.
Chinese is traditionally written in characters, with most characters being roughly equivalent to a word (or morpheme). Chinese also uses a lot of compound or two- to three-character words (Huang, 1998; Li & Thompson, 1981). If we counted the number of characters used to tell the story, it is possible that the number would exceed an English version of the story (see Wang & Leichtman, 2000). The gesture rate in Chinese might be lower than in English simply because we had not counted equivalent token numbers. To get around this problem, we did two things. First, the Chinese stories were transcribed in Pinyin, with compound words written as a single word. Second, loosely following Wang and Leichtman (2000), we compared the number of word tokens in the English gloss of the Chinese stories and the number of Chinese (Pinyin) word tokens. The mean number of word tokens in Chinese was 373.4 (SD = 141.5); for the English gloss, the mean was 355.7 (SD = 121.9). There was no significant difference between these two counts t(15)=1.16, ns. The correlation between the two counts was highly significant, r(14)=.947, p< .01. We also tried analyzing the results using both the Chinese tokens and the glossed tokens. The same pattern of results was observed on all of our dependent measures. For these reasons, we decided to use the Chinese tokens in the analyses we have presented below.
Counting scenes
We coded the cartoon for possible scenes that could be included in a retelling. A scene could be described in a single clause (e.g., The Pink Panther stuffs the bird in the clock; the clock falls from the bridge). The part of the cartoon we analyzed comprised 37 scenes (Marentette et al., 2007). In our past research, we have found that speakers include around 15–20 scenes when retelling this part of the story in their L1 (e.g., Nicoladis et al., 2007). The number of scenes included by each participant was judged by a fluent English speaker based on the English transcripts and the English glossed version of the Chinese story.
Order of language sessions
Eight participants were tested in Chinese first (5 females, 3 males) and eight in English first. The age of the participants and the number of years in an English-speaking country did not differ significantly by order tested. The order of testing had no significant effect on the number of scenes in English or Chinese, the word tokens used in English or Chinese, or the gesture rate in English or Chinese.
RESULTS
We first present the analyses comparing the participants' story length and gesture use in their L1s and L2s. We then compare the men and the women on the same variables.
L1 versus L2
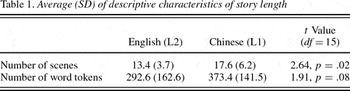
The length of the stories was measured both in terms of number of scenes and in terms of number of word tokens used to tell the stories. The averages and standard deviations for these measures for each language are summarized in Table 1. As can be seen in the table, the participants told longer stories in their L1, although this difference reached significance only for the number of scenes.

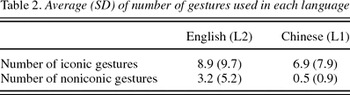
The average number of gestures participants used in each language is summarized in Table 2. As noted earlier, we did not perform any statistical analyses on these numbers because the number of gestures can be influenced by how much the speakers talked.

We next examined the participants' gesture rate in their L1 and L2. Figure 1 summarizes the averages (and standard deviations) of the gesture rate by language, for both iconic and noniconic gestures. We analyzed these results with a 2 × 2 (Gesture Type × Language) repeated measures analysis of variance (ANOVA). There was a main effect for gesture type, F(1, 15)=27.04, p < .01, with participants using more iconic gestures than noniconic gestures. There was a main effect for language, F(1, 15)=7.60, p=.015, with participants using more gestures in English than in Chinese. There was no interaction effect (F < 1).

The average gesture rate by language. Error bars indicate thestandard deviation. [A color version of this figure can be viewed online at www.journals.cambridge.org]
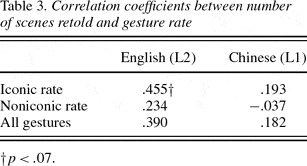
Finally, we correlated the gesture rate with the number of scenes the participants retold. Table 3 summarizes these correlations. The only correlation that neared significance was the correlation between the rate of iconic gestures and the number of scenes in English.

Gender differences
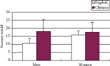
The men used an average of 232.8 (SD = 132.0) word tokens to retell their stories in English and 334.0 (SD = 121.9) in Chinese. The women used an average of 400.2 (SD = 173.6) word tokens to retell their stories in English and 458.2 (SD = 153.9) in Chinese. We analyzed these results with a 2 × 2 (Gender × Language) ANOVA, with language as a repeated measure. There was no main effect for gender on the number of tokens used, F(1, 14)=2.74, p=.12. There was a trend for a main effect of language, F(1, 14)=3.45, p=.084, but no interaction effect between language and gender (F < 1). These results show that all participants tended to use more words to tell the stories in Chinese than in English.
Figure 2 shows the number of scenes retold in each language by gender. We analyzed these data with a 2 × 2 (Gender × Language) ANOVA, with language as a repeated measure. This analysis showed a main effect for language, F(1, 14)=8.63, p=.011. The main effect for gender was not significant (F < 1). The interaction effect just missed significance, F(1, 14)=4.56, p=.051. These results show that both men and women retold more scenes in their L1 than in their L2. As can be seen in Figure 2, the trend toward an interaction effect is largely because of the men retelling fewer scenes in English than the women.

The average number of scenes retold. Error bars indicate thestandard deviation. [A color version of this figure can be viewed online at www.journals.cambridge.org]
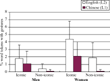
Figure 3 shows the average rate of men and women's gesture, both iconic and noniconic. We analyzed these data with a 2×2×2 (Language × Gesture Type × Gender) ANOVA with the first two variables as repeated measures. The results revealed significant main effects for language, F(1, 14)=7.85, p=.014 and gesture type, F(1, 14)=23.38, p < .01, as well as a trend toward a main effect for gender, F(1, 14)=3.44, p=.085. None of the interaction effects reached significance.
As for the entire group, we correlated the number of scenes with the rate of gestures for both men and women. None of these correlations reached significance.

The average gesture rate. Error bars indicate the standard deviation. [A color version of this figure can be viewed online at www.journals.cambridge.org]
DISCUSSION
This study was centered around three research questions. We consider how the results bear on each of these questions in turn.
We first asked if gesture use corresponds to task difficulty, assuming greater proficiency in the participants' L1 than their L2. Previous studies had shown that bilinguals used more noniconic (particularly deictic) gestures in their L2 (Gullberg, 1999; Marcos, 1979; Pika et al., 2006; Sherman & Nicoladis, 2004). The results with iconic gestures from previous studies differed by study; either bilinguals used more iconic gestures in their L1 (Gullberg, 1999) or used the same rate in both languages (Marcos, 1979; Sherman & Nicoladis, 2004).
In this study, the Chinese–English bilinguals used more gestures in their L2, both iconic and noniconic (i.e., there was no interaction between language and gesture type). These results with the noniconic gestures are consistent with the idea that noniconic gestures are somewhat separable from speech and can be used to compensate for difficulties with speech (Nicoladis, 2002). The results with the iconic gestures are consistent with the idea that iconic gestures can be used to aid language access (Krauss & Hadar, 1999). In other words, the use of iconic gestures is greater when task difficulty is greater. However, the results with the iconic gestures in this study are novel. No other study has reported bilinguals using more iconic gestures in their L2 than their L1. Taken together with the results of previous studies, we can conclude that there is no simple relationship between proficiency and iconic gesture use (cf. Nicoladis et al., 1999). That is, gesture use may depend less on how well a speaker can speak the language and more on what a speaker is doing with language at a particular time. One possible reason for the inconsistent findings with regard to proficiency is that our study, like other previous studies (e.g., Marcos, 1979), assumed that the speakers were more proficient in their L1. In this study, that assumption corresponded to our impressions of the speakers' proficiency as represented on the videotapes. However, future studies could take more systematic measures of proficiency, to see if they correlate with speakers' gesture use. It could also be interesting to measure other measures of task difficulty (see Robinson, 2001), such as anxiety and confidence about using an L2.
If this interpretation is correct, then we would like to identify what it is about what a speaker is doing with language that leads to increased gesture use. One possibility we considered here was implicit in our second research question. We asked if gesture use corresponded to task complexity. We found only weak evidence consistent with the idea that increased task complexity leads to increased gesture use (Kita, 2000). We predicted that the participants' gesture use would correlate with the number of scenes they included in their retelling. This was true for iconic gestures of the participants' L2 English but not of their L1 Chinese. One possibility is that the gesture use does not correlate with the number of scenes in the participants' L1 because they were telling as many scenes as people typically remember in this task (i.e., there were ceiling effects). In other studies we have done with this cartoon, speakers typically retell about 15–20 of the possible 37 scenes in their L1 (Nicoladis et al., 2007), corresponding to the participants' number of scenes in Chinese in the present study. It is also possible that we have a poor measure of task complexity. One way to design a study that would more directly test the effects of task complexity would be to ask participants to simply describe a scene in front of them and to remember a scene that was presented to them (roughly analogous to the methodology in Alibali et al., 2000), once in their L1 and once in their L2. Until such a study is done, we can only conclude that we have only weak evidence in support of the idea that increased task complexity leads to increased gesture use in L2 (cf. Kita, 2000).
Our third research question focused on whether there are gender differences in gesture use in L2. Hostetter and Hopkins (2002) found that monolingual women gestured more than men when retelling a story, a finding that they attributed to gender based differences in nonverbal expressivity. In the present study, we found a trend for women to gesture more than men, the difference being particularly striking in their L2 (see Figure 3). Hostetter and Hopkins (2002) appeal to expressivity to explain the gender difference in their study. To explain the present data, one must also explain why the trend for a gender difference is more striking in L2. Some research has shown that bilingual speakers show differences in personality traits depending upon the language they are using during testing (Hull, 1996; Marian & Kaushanskaya, 2004). It is possible that the higher rate of gesture produced by Chinese women is a result of expressivity that is called forth only when the task is conducted in English. That is, our present results could be because of an interaction between culture and gender (Riggio & Freedman, 1986). LaFrance and Hecht (2000) put forward the expressivity demand theory in which they argue that the degree of expressivity demonstrated at any particular point in time is a combination of gender and situational norms. Although their theory was devised around smiling rather than gestural behavior, other researchers have found general principles of expressivity to apply to gesture (Hall, 1984). Further studies will have to resolve the issue of how generalizable the gender differences in gesture use are and to what extent they are influenced by cultural variables.
In this study, the trend toward a gender difference in gesture use corresponded with a trend toward a gender difference in story length. That is, the women tended to use more scenes to tell their stories, particularly in their L2. Number of scenes retold is a variable we have used as an index of task complexity. It is possible that the women decided to take on a slightly more complex task in their L2 (for unknown reasons), and that this decision resulted in a higher gesture rate in their L2. Again, a study that controls for task complexity could resolve this issue.
CONCLUSION
In sum, these results suggest that gesture use is not related in a simple way to proficiency in a L2. Research should focus on what exactly speakers are doing with language when they produce gestures. We have considered the possibility that task complexity, perhaps in interaction with task difficulty (see Robinson, 2001), could explain the variable results. Naturally, task complexity and difficulty do not exhaust the possible reasons that may underlie why L2 learners produce gestures. In any case, these results suggest that using a L2 may not be facilitated by verbal means alone.
We are grateful for funding from the SSHRC to the first and fourth authors. An earlier version of this paper was presented at the Language, Culture and Mind Conference in Paris in July 2006.