Vitamin D (25(OH)D) is a fat-soluble vitamin, also known as a prohormone, and its active form 1,25(OH)2D (calcitriol) participates in the regulation of calcium and phosphate, influencing bone formation. Its deficiency during pregnancy can compromise fetal growth and development(Reference Ryan and Kovacs1). When hydroxylated by CYP27B1 in the kidneys, the major circulating metabolite, 25(OH)D, is converted to 1,25(OH)2D, the most active form. During pregnancy, 25(OH)D is transferred to the fetus through the placenta. Nonetheless, 1,25(OH)2D does not easily cross the placental barrier and is made available to the fetus through the expression of CYP27B1(Reference Shin, Choi and Longtine2). In the maternal and fetal circulation, 1,25(OH)2D concentrations increase by 100–200 % after the first trimester; however, the immediate bioavailability of 1,25(OH)2D is limited because most of it is bound to vitamin D-binding protein(Reference Hossein-Nezhad and Holick3).
Studies have reported inverse associations between 25(OH)D concentrations and markers of obesity(Reference Bennour, Haroun and Sicard4) and adiposity(Reference Fu, Xu and Shu5,Reference Hyppönen and Boucher6) . However, this relationship may be influenced by residual confounding and reverse causality, since higher adiposity can reduce circulating 25(OH)D concentrations through volumetric dilution and sequestration in adipose tissue and can also increase vitamin D requirements(Reference Drincic, Armas and Van Diest7,Reference Vimaleswaran, Berry and Lu8) . Furthermore, prospective studies have identified low 25(OH)D concentrations as predictors of the onset of obesity(Reference González-Molero, Rojo-Martínez and Morcillo9,Reference Gagnon, Lu and Magliano10) . 1,25(OH)2D plays a role in adipose tissue remodelling through calcium (Ca2+) apoptotic signalling. The removal of mature adipocytes by calcitriol/Ca2+-mediated apoptosis may contribute to maintaining body weight and promoting weight loss(Reference Sergeev11,Reference Sergeev12) .
Within this context, according to the Developmental Origins of Health and Disease theory, intrauterine growth is one of the most important determinants of health throughout life, with intrauterine growth restriction potentially increasing the risk of chronic non-communicable diseases in childhood and adulthood(Reference Barker13). Thus, indicators of fetal growth and body composition, such as estimated fetal weight (EFW) and measures of adiposity, are valuable tools for understanding the influence of maternal factors, including 25(OH)D, on fetal programming(Reference Salomon, Alfirevic and Da Silva Costa14–Reference Ikenoue, Waffarn and Sumiyoshi16).
Studies evaluating the relationship between maternal 25(OH)D and fetal biometry indicated a possible influence of 25(OH)D concentrations on head circumference (HC)(Reference Miliku, Vinkhuyzen and Blanken17), biparietal diameter (BPD)(Reference Lee, Ryu and Han18) and length-for-gestational age z-score(Reference Beck, Blue and Silver19). Only one study conducted in Japan explored the effects of 25(OH)D on estimated fetal adiposity(Reference Akita, Ikenoue and Tamai20) and found no association between these two variables after adjusting the model for confounding factors. Although observational evidence remains limited, findings from randomised controlled trials and meta-analyses of vitamin D supplementation during pregnancy have provided insights into potential causal effects on fetal growth outcomes, including birth weight and length; however, the results are inconsistent across studies(Reference Roth, Leung and Mesfin21,Reference Bi, Nuyt and Weiler22) .
Given the lack of prospective epidemiological cohort studies exploring the relationship between maternal 25(OH)D and fetal growth and adiposity, the aim of this study was to evaluate the association of maternal 25(OH)D concentrations with fetal biometry and adiposity at three periods of pregnancy.
Methods
Study design and participants
This prospective cohort study is part of the Araraquara Cohort Study(Reference Victor, Teles and Aires23). Participants were recruited between August 2022 and August 2024, and those with a gestational age of ≤19 weeks who attended the thirty-seven Basic Health Units and the Araraquara Special Health Service (Serviço Especial de Saúde de Araraquara) in the municipality of Araraquara, São Paulo, Brazil, were included. To the best of our knowledge, there is only one study in the literature that evaluated the relationship between maternal vitamin D concentrations and fetal adiposity(Reference Akita, Ikenoue and Tamai20), which shows that maternal 25(OH)D concentrations at 24 weeks were associated with estimated fetal adiposity at 36 weeks r = –0·234; p = 0·028). Considering the results of this study, a two-sided α level of 0·05 and 80 % statistical power, the estimated minimum sample size for our study was 141 participants(Reference Bonett and Wright24).
The participants were followed up during pregnancy until delivery, which took place at the Gota de Leite Municipal Maternity Hospital. All participants were users of the Brazilian Unified Health System (Sistema Único de Saúde (SUS)), which mainly attends low-income families. Pregnant women with diabetes mellitus, cardiovascular, renal or hepatic diseases, and multiple pregnancies were excluded from the study. The study was approved by the Ethics Committee on Research Involving Humans of the School of Public Health, University of São Paulo (CAEE: 67483517.6.0000.5421). The participants or their guardians signed two copies of the free informed consent form, consistent with the principles outlined in the Helsinki Declaration.
Maternal 25(OH)D concentrations as main exposure
The concentrations of 25(OH)D were measured in serum samples obtained during prenatal care at three different periods of pregnancy: first period (≤19 weeks), second period (20–28 weeks) and third period (≥30 weeks). After fasting for 12 h, 4 ml of venous blood was collected into EDTA tubes, centrifuged for 15 min at 3500 rpm for the separation of plasma. Serum 25(OH)D concentrations were measured by chemiluminescence immunoassay (ADVIA Centaur® Vitamin D Total, Siemens Health Care Diagnostics), with an analytical range of 4·2–150 ng/ml, limit of detection of 3·2 ng/ml and intra- and inter-assay coefficients of variation ≤8 and ≤12 %, respectively, with calibration and quality control performed according to the manufacturer’s instructions. The 25(OH)D status was categorised according to the clinical cut-off points proposed by Holick et al. (Reference Holick25): sufficiency (≥75 nmol/l), insufficiency (50–74·9 nmol/l) and deficiency (<50 nmol/l).
Fetal outcomes
Fetal outcomes were assessed longitudinally during pregnancy and included indicators of fetal growth and adiposity. The following growth parameters were assessed: femur length (FL, cm), abdominal circumference (AC, cm), HC (cm), BPD (cm) and EFW (g). The adiposity parameters assessed in the second and third periods included abdominal subcutaneous adipose tissue thickness (AST, mm), total thigh area (TTA, cm3), thigh muscle area (TMA, cm3), thigh fat area (TFA, cm3), arm muscle area (AMA, cm3) and arm fat area (AFA, cm3).
Two experienced and previously trained professionals performed the ultrasound examinations at the Gota de Leite Maternity Hospital using the Toshiba® ultrasound machine (model TUS-A300). Standardised protocols were followed during all measurements.
Maternal covariates
Sociodemographic, lifestyle and obstetric history variables were collected by well-trained interviewers, using a validated questionnaire(Reference Rondó, Ferreira and Nogueira26), administered during the three gestational periods. Anthropometric measurements were taken using standardised protocols, including weight measured by the Tanita MC180 electrical bioimpedance (Tanita®) and height measured using a wall-mounted stadiometer (Seca®). Serum total cholesterol, HDL-cholesterol and TAG were measured using automated enzymatic colorimetric assays on a Beckman Coulter AU680 analyser (Beckman Coulter), following the manufacturer’s instructions, with routine calibration and internal quality control procedures. LDL-cholesterol concentrations were estimated using the Friedewald equation: LDL-cholesterol = total cholesterol – HDL-cholesterol – TAG/5(Reference Friedewald, Levy and Fredrickson27).
Statistical analysis
Categorical variables were reported as absolute (n) and relative frequencies (%), while continuous variables were expressed as median and interquartile range (p25–p75), given the asymmetric distribution pattern identified by the Shapiro–Wilk test. Comparisons between 25(OH)D exposure groups (sufficiency, insufficiency and deficiency) were performed using the Kruskal–Wallis test for continuous variables and the χ 2 test or Fisher’s exact test for categorical variables, as appropriate. Correlations between maternal 25(OH)D concentrations and fetal outcomes were assessed using Spearman’s test.
To assess the association between maternal 25(OH)D concentrations and fetal growth and adiposity outcomes throughout pregnancy, generalised estimating equation (GEE) models were applied(Reference Ballinger28–Reference Liang and Zeger30), which consider the intraindividual correlation between repeated measurements. The specified statistical family was Gaussian, appropriate for continuous quantitative outcomes. The specified correlation structure was first-order autoregressive, assuming a higher correlation between observations close in time. The general GEE model can be written as follows:
 ${Y_{ij}} = {\beta _0} + {\beta _1}*Vit{D_{ij}} + \sum\limits_{k = 2}^p {{\beta _k}} {\rm{ }}*{X_{ijk}} + {\epsilon _{ij}}$
where Yij is the fetal outcome for individual i at time j, VitDij is the maternal vitamin D concentration at time j, Xijk is the k th covariate for individual i at time j, ∈ij is the error with a first-order autoregressive correlation structure and p represents the total number of covariates included in the model.
The models were adjusted for confounding factors identified by a directed acyclic graph, using the DAGitty software, version 3.0 (Reference Textor, Zander and Gilthorpe31) (Supplementary Figure 1). The selection of covariates was guided by graphical criteria to reduce confounding bias(Reference Shrier and Platt32,Reference Hernán and Robins33) . The following variables were included in the adjusted models: age, education, parity, pre-pregnancy BMI, per capita income, smoking, alcohol consumption, physical activity, gestational diabetes, gestational hypertension and LDL-cholesterol.
The results were expressed as beta coefficients (β) of exposure and their respective 95 % confidence intervals (95 % CI). The outcomes evaluated included fetal growth (FL, AC, HC, BPD and EFW) and adiposity measures (AST, TTA, TMA, TFA, AMA, and AFA). A statistical significance level of p < 0·05 was adopted. Interaction terms between maternal 25(OH)D concentrations and vitamin–mineral supplementation were included in the GEE models to assess potential effect modification.
To assess the robustness of the findings, two sensitivity analyses were performed. First, the GEE models were re-estimated after excluding women who reported vitamin–mineral supplement use during pregnancy. Second, the analyses were also repeated after excluding women with gestational diabetes and/or gestational hypertension. The same modelling strategy, adjustment structure and autoregressive correlation matrix adopted in the primary analyses were maintained whenever applicable.
Model adequacy and assumptions were evaluated through residual diagnostics, including inspection of residuals v. fitted values, normal Q–Q plots and scale–location plots. All analyses were performed using the ‘GEE package’ of the R software (version 4.1.0; R Foundation for Statistical Computing).
Results
Maternal and fetal characteristics throughout pregnancy
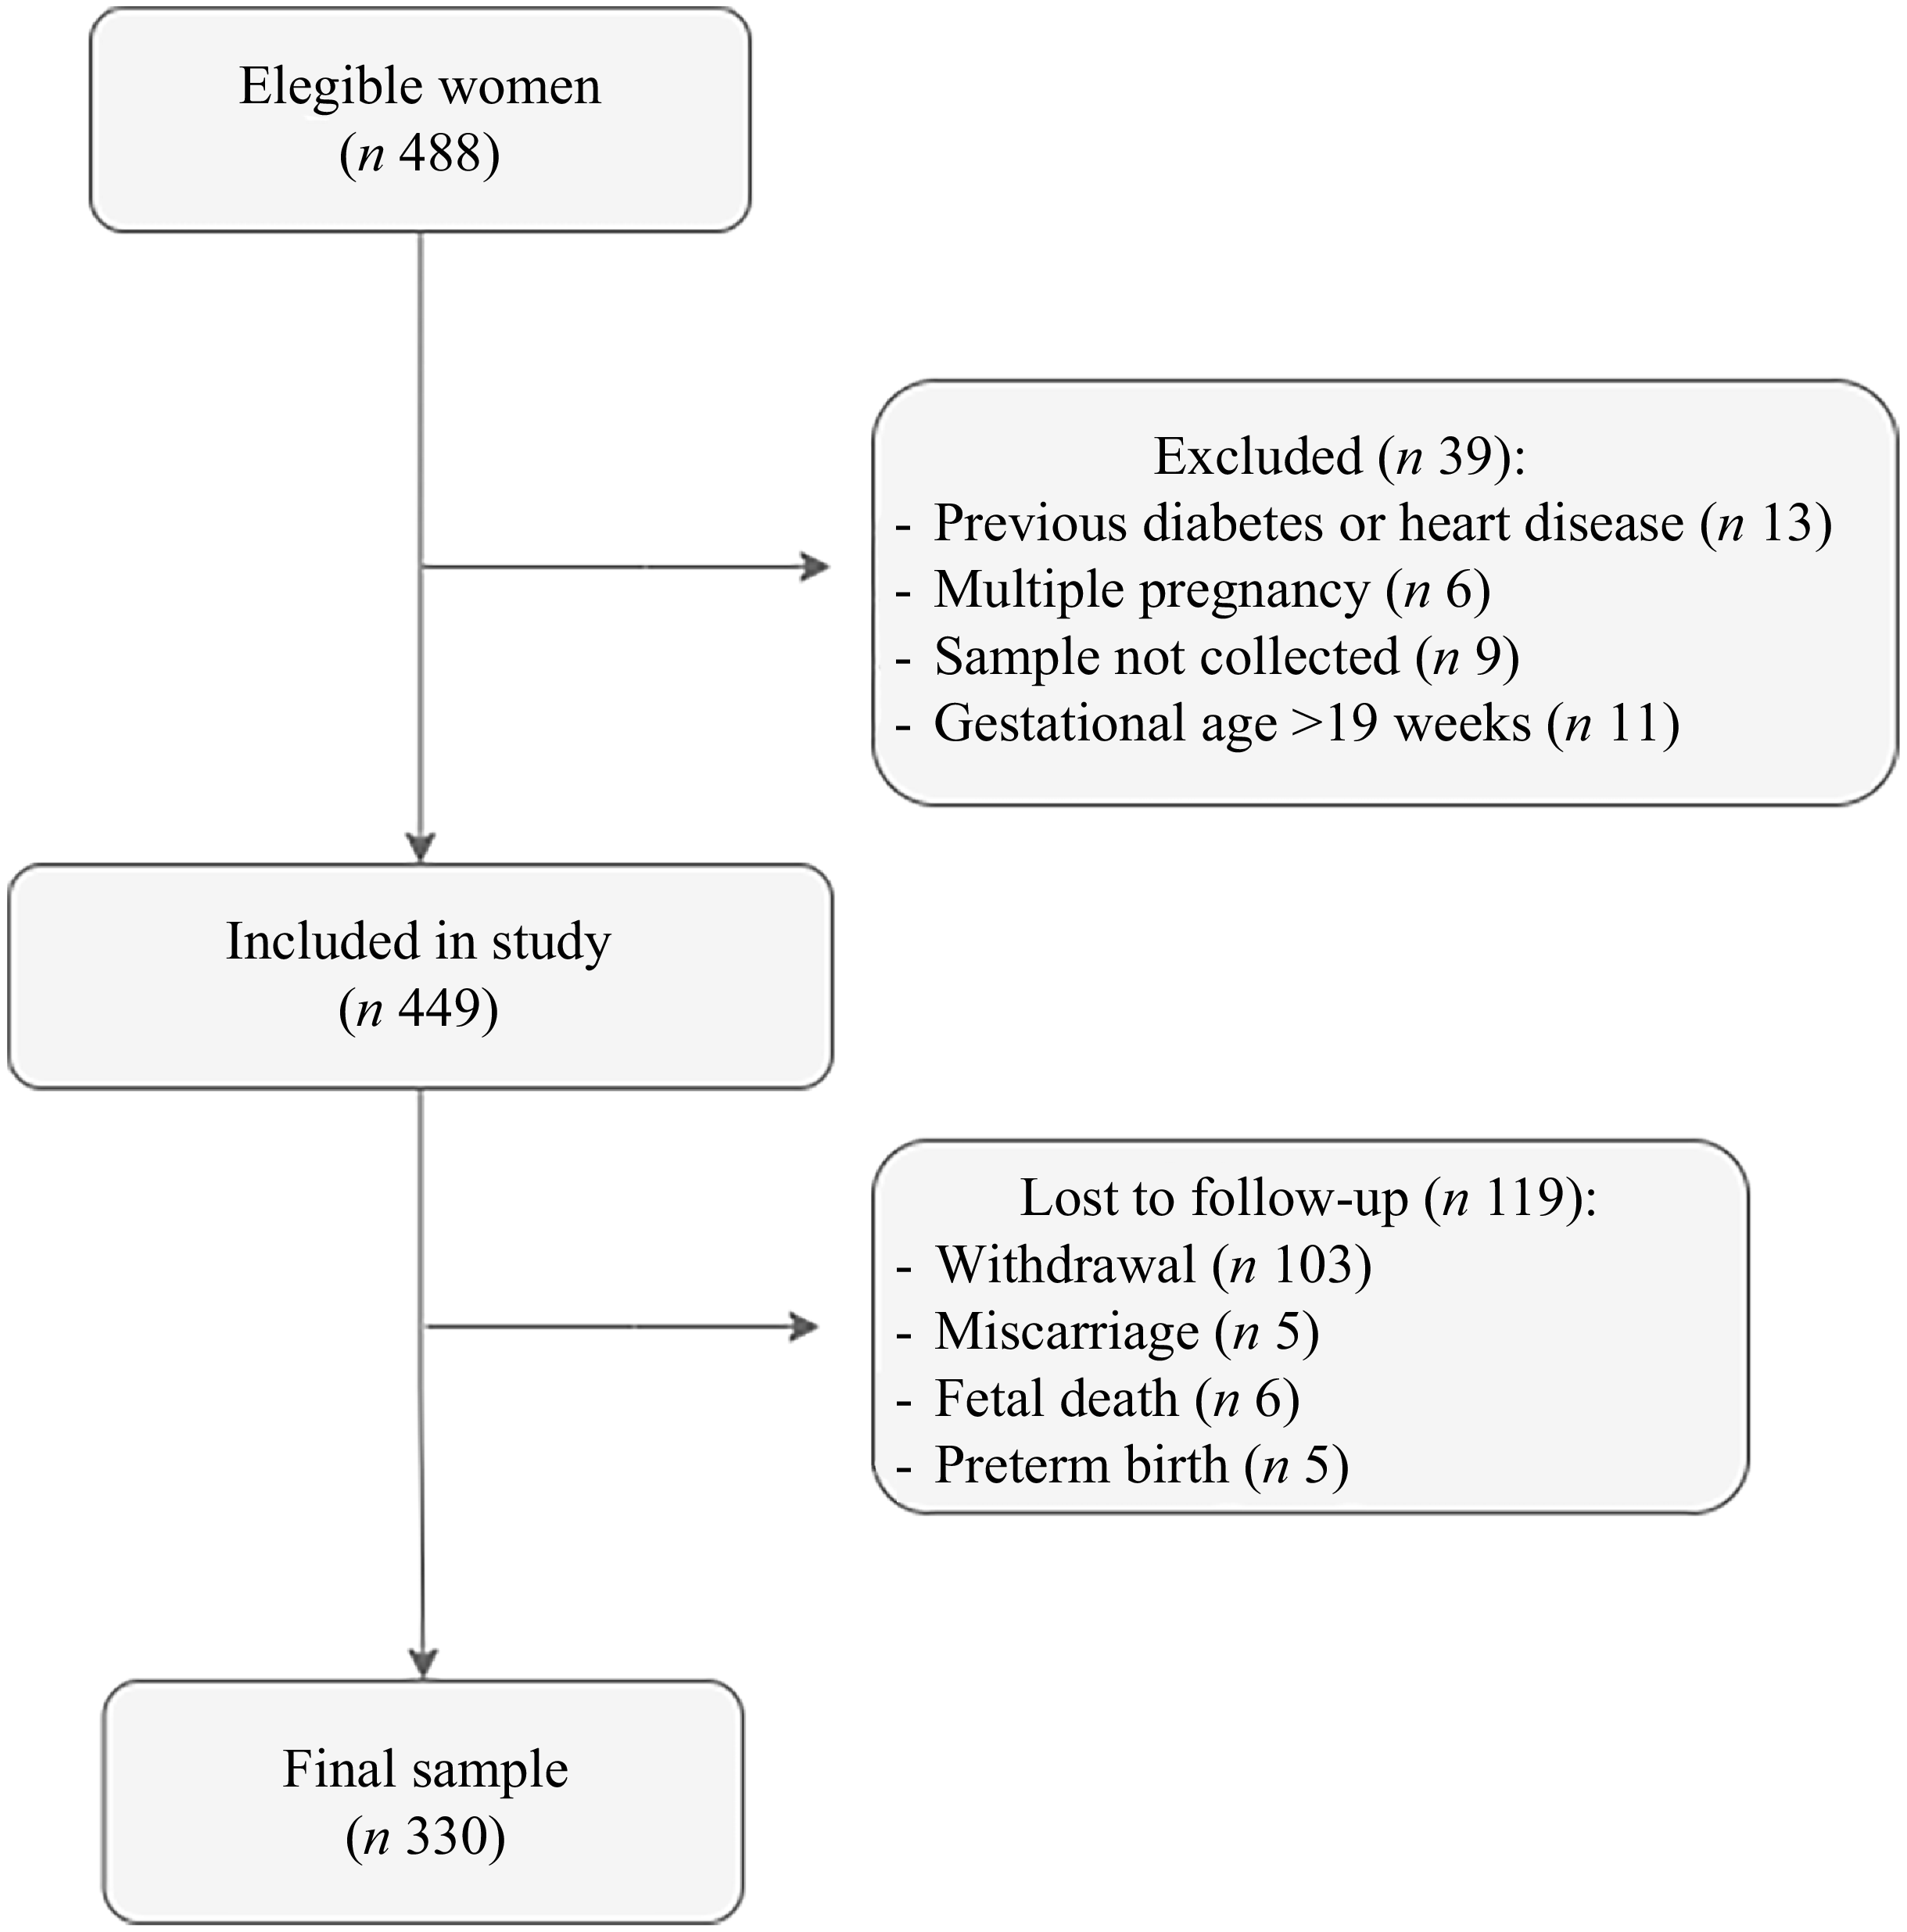
According to the flow chart in Figure 1, 488 women were enrolled to participate in the study. For the 25(OH)D analysis, thirty-nine women were excluded according to the exclusion criteria (pre-existing diabetes mellitus or CVD, multiple pregnancy, blood sample not collected and gestational age > 19 weeks). Of the 449 eligible participants, 119 were lost to follow-up due to withdrawal, miscarriage, stillbirth and preterm birth (delivery occurring before the third period). Supplementary Table 1 presents some characteristics of the women included in the analysis and the ones who were lost to follow-up.
Follow-up of the study participants.

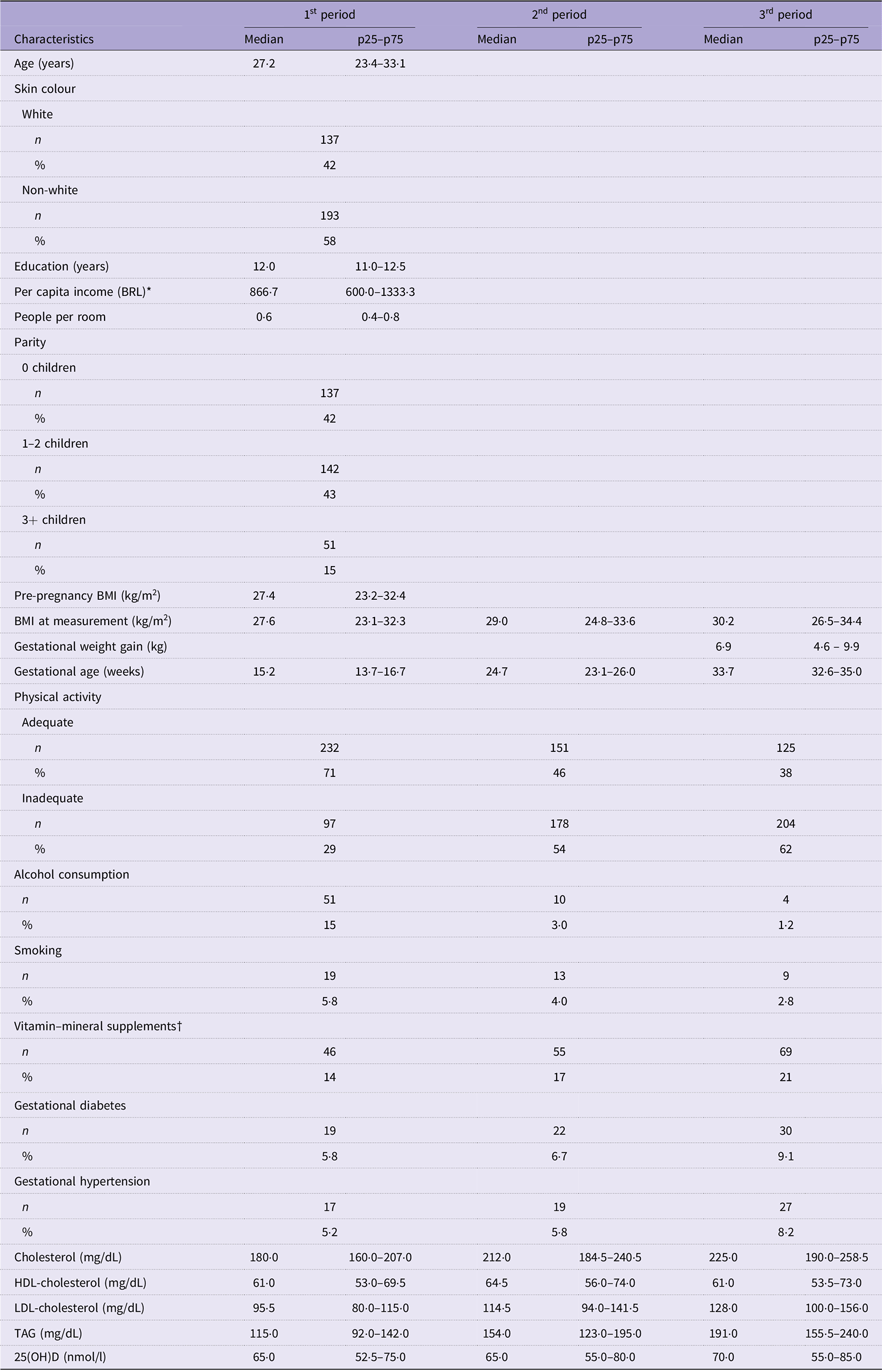
Participant characteristics are summarised in Table 1. Median maternal age, education and pre-pregnancy BMI were 27·2 years (IQR 23·4–33·1), 12·0 years (IQR 11·0–12·5) and 27·4 kg/m2 (IQR 23·2–32·4), respectively. BMI increased throughout gestation from 27·6 (23·1–32·3) in the 1st period to 30·2 kg/m2 (IQR 26·5–34·4) in the 3rd period), while physical activity and alcohol consumption decreased, respectively, from 71 to 38 % and from 15 to 1·2 %. The use of vitamin–mineral supplements and the prevalences of gestational diabetes and gestational hypertension increased throughout pregnancy, although the results did not reach significance. The median 25(OH)D concentration was 65 nmol/l (52·5–75·0) in the first period, 65 nmol/l (55·0–80·0) in the second period and 70 nmol/l (55·0–85·0) in the third period.
Maternal characteristics by the gestational periods investigated in the Araraquara Cohort Study (Numbers and percentage; median values and percentile range)

Table 1. Long description
A table comparing maternal characteristics across three gestational periods. The table has 25 rows and 7 columns. Column headers are Characteristics, 1st period Median, 1st period p25-p75, 2nd period Median, 2nd period p25-p75, 3rd period Median, 3rd period p25-p75. Row labels include Age (years), Skin colour (White and Non-white), Education (years), Per capita income (BRL), People per room, Parity (0 children, 1-2 children, 3+ children), Pre-pregnancy BMI (kg/m2), BMI at measurement (kg/m2), Gestational weight gain (kg), Gestational age (weeks), Physical activity (Adequate and Inadequate), Alcohol consumption, Smoking, Vitamin-mineral supplements, Gestational diabetes, Gestational hypertension, Cholesterol (mg/dL), HDL-cholesterol (mg/dL), LDL-cholesterol (mg/dL), TAG (mg/dL), 25(OH)D (nmol/l). Row 1: Age (years), 27-2, 234-33-1, 29-0, 24-8-33-6, 30-2, 26-5-34-4. Row 2: Skin colour White, n 137, 42, n 111, 35, n 101, 31. Row 3: Skin colour Non-white, n 193, 58, n 209, 65, n 229, 69. Row 4: Education (years), 12-0, 11-0-12-5, 12-0, 11-0-12-5, 12-0, 11-0-12-5. Row 5: Per capita income (BRL), 866-7, 600-0-1333-3, 866-7, 600-0-1333-3, 866-7, 600-0-1333-3. Row 6: People per room, 0-6, 0-4-0-8, 0-6, 0-4-0-8, 0-6, 0-4-0-8. Row 7: Parity 0 children, n 137, 42, n 111, 35, n 101, 31. Row 8: Parity 1-2 children, n 142, 43, n 151, 47, n 165, 51. Row 9: Parity 3+ children, n 51, 15, n 58, 18, n 64, 20. Row 10: Pre-pregnancy BMI (kg/m2), 27-4, 23-2-32-4, 27-6, 23-1-32-3, 29-0, 24-8-33-6. Row 11: BMI at measurement (kg/m2), 27-6, 23-1-32-3, 29-0, 24-8-33-6, 30-2, 26-5-34-4. Row 12: Gestational weight gain (kg), 6-9, 4-6-9-9, 6-9, 4-6-9-9, 6-9, 4-6-9-9. Row 13: Gestational age (weeks), 15-2, 13-7-16-7, 24-7, 23-1-26-0, 33-7, 32-6-35-0. Row 14: Physical activity Adequate, n 232, 71, n 151, 46, n 125, 38. Row 15: Physical activity Inadequate, n 97, 29, n 178, 54, n 204, 62. Row 16: Alcohol consumption, n 51, 15, n 30, 9, n 37, 11. Row 17: Smoking, n 19, 6, n 13, 4, n 9, 3. Row 18: Vitamin-mineral supplements, n 46, 14, n 55, 17, n 69, 21. Row 19: Gestational diabetes, n 19, 6, n 22, 7, n 30, 9. Row 20: Gestational hypertension, n 17, 5, n 19, 6, n 27, 8. Row 21: Cholesterol (mg/dL), 180-0, 160-0-207-0, 212-0, 184-5-240-5, 225-0, 190-0-258-5. Row 22: HDL-cholesterol (mg/dL), 61-0, 53-0-69-5, 64-5, 56-0-74-0, 61-0, 53-5-73-0. Row 23: LDL-cholesterol (mg/dL), 95-5, 80-0-115-0, 114-5, 94-0-141-5, 128-0, 100-0-156-0. Row 24: TAG (mg/dL), 115-0, 92-0-142-0, 154-0, 123-0-195-0, 191-0, 155-5-240-0. Row 25: 25(OH)D (nmol/l), 65-0, 52-5-75-0, 65-0, 55-0-80-0, 70-0, 55-0-85-0.
Continuous variables are presented as median (p25–p75) and categorical variables as n (%). P-values were obtained using Friedman tests for continuous repeated variables and Cochran’s Q tests for repeated binary categorical variables. Gestational periods investigated (≤19; 20–28 and 30–38 weeks).
* One minimum wage was equivalent to Brazilian reais (R$) 1320.00; (US$ 1.00 = R$ 6.08).
† Use of vitamin–mineral supplements or 25(OH)D alone.
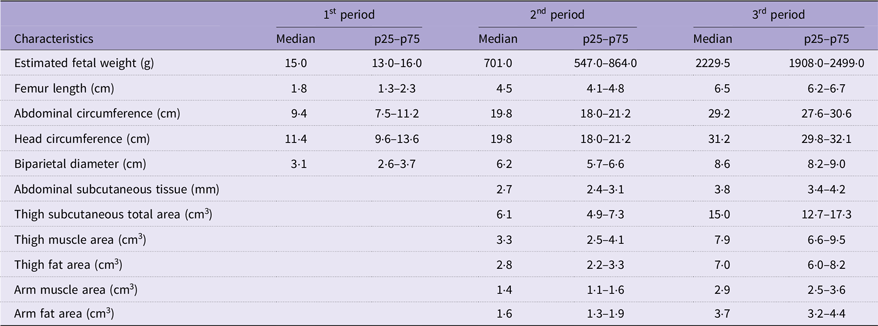
There was also a progressive increase in fetal biometric measures (Table 2). EFW increased from 15·0 g (IQR: 13·0–16·0) in the first period to 2229·5 g (IQR: 1908·0–2499·0) in the third period. FL, AC, HC and BPD also increased over the periods investigated. Regarding fetal adiposity measures assessed from the second period onwards, there was an increase in AST, TFA, TMA, AFA, and AMA.
Fetal growth and adiposity by the gestational periods investigated in the Araraquara Cohort Study (N 330) (Median values and percentile range)

Table 2. Long description
A table comparing fetal growth and adiposity measures across three gestational periods. The table has 11 rows and 7 columns. Column headers are Characteristics, 1st period Median, 1st period p25-p75, 2nd period Median, 2nd period p25-p75, 3rd period Median, 3rd period p25-p75. Row 1: Estimated fetal weight (g), 15.0, 13.0-16.0, 701.0, 547.0-864.0, 2229.5, 1908.0-2499.0. Row 2: Femur length (cm), 1.8, 1.3-2.3, 4.5, 4.1-4.8, 6.5, 6.2-6.7. Row 3: Abdominal circumference (cm), 9.4, 7.5-11.2, 19.8, 18.0-21.2, 29.2, 27.6-30.6. Row 4: Head circumference (cm), 11.4, 9.6-13.6, 19.8, 18.0-21.2, 31.2, 29.8-32.1. Row 5: Biparietal diameter (cm), 3.1, 2.6-3.7, 6.2, 5.7-6.6, 8.6, 8.2-9.0. Row 6: Abdominal subcutaneous tissue (mm), 2.7, 2.4-3.1, 3.8, 3.4-4.2. Row 7: Thigh subcutaneous total area (cm^2), 6.1, 4.9-7.3, 15.0, 12.7-17.3. Row 8: Thigh muscle area (cm^2), 3.3, 2.5-4.1, 7.9, 6.6-9.5. Row 9: Thigh fat area (cm^2), 2.8, 2.2-3.3, 7.0, 6.0-8.2. Row 10: Arm muscle area (cm^2), 1.4, 1.1-1.6, 2.9, 2.5-3.6. Row 11: Arm fat area (cm^2), 1.6, 1.3-1.9, 3.7, 3.2-4.4.
Continuous variables are presented as median (p25–p75). P-values were obtained using Friedman tests for variables measured at three gestational periods and Wilcoxon signed-rank tests for adiposity variables measured in the second and third gestational periods.
Maternal and fetal characteristics according to 25(OH)D nutritional status
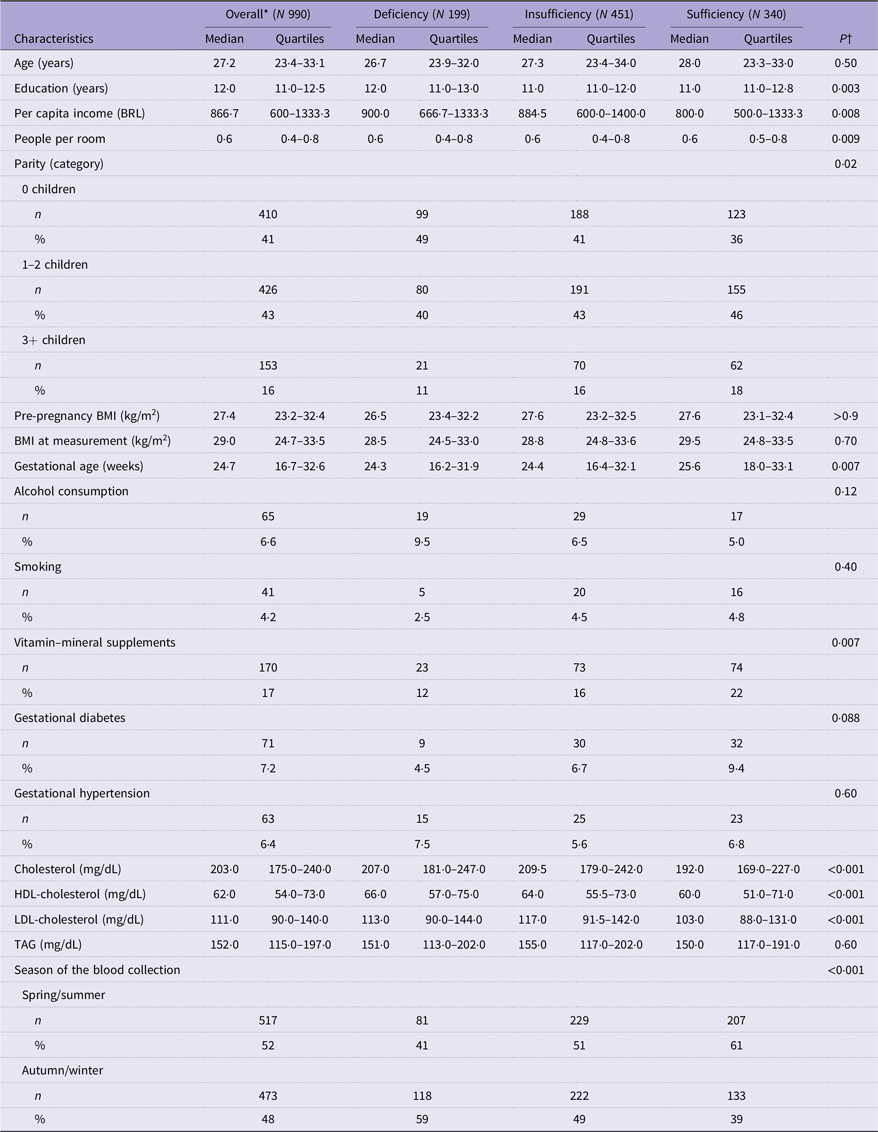
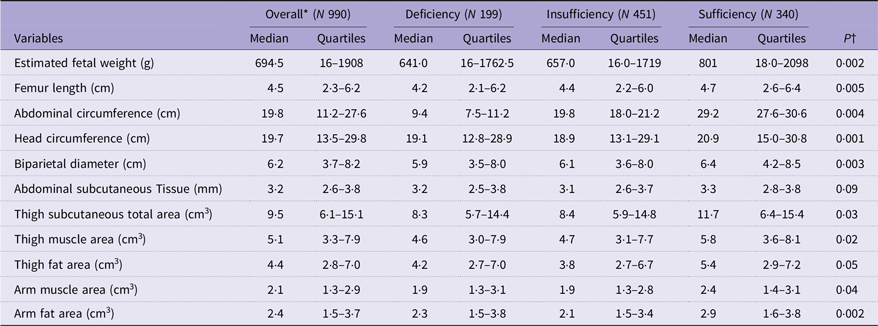
Table 3 shows the maternal characteristics according to 25(OH)D category. Women with sufficient 25(OH)D levels had lower median levels of education (p = 0·003) and per capita income (p = 0·008) and higher parity (p = 0·017), as well as a more advanced gestational age at the time of assessment (p = 0·007). Vitamin–mineral supplement intake was associated with 25(OH)D sufficiency (p = 0·007), and most women with 25(OH)D deficiency were diagnosed in the autumn/winter (p < 0·001). Lipid profiles differed between groups, with women with sufficient 25(OH)D having lower concentrations of total cholesterol, HDL-cholesterol and LDL-cholesterol (p < 0·001). Fetal growth indicators were higher among fetuses of mothers with sufficient 25(OH)D concentrations (Table 4). EFW (p = 0·002), FL (p = 0·005), AC (p = 0·004), HC (p = 0·001) and BPD (p = 0·003) were significantly greater in the group with sufficient 25(OH)D compared with the deficient and insufficient groups. TTA (p = 0·029), TMA (p = 0·024) and AMA (p = 0·044) were also greater among fetuses exposed to normal maternal 25(OH)D concentrations. Supplementary Figure 2 shows the correlations between maternal 25(OH)D concentrations and fetal biometric and adiposity measures.
Associations between maternal characteristics by maternal 25(OH)D status (deficiency, insufficiency and sufficiency) in the three gestational periods investigated (Median values and quartiles; median values and percentile range)

Table 3. Long description
A table comparing maternal characteristics by 25(OH)D status across different gestational periods. The table has 18 rows and 10 columns. Column headers are Characteristics, Overall (N 990), Deficiency (N 199), Insufficiency (N 451), Sufficiency (N 340), and PT. Row labels include Age (years), Education (years), Per capita income (BRL), People per room, Parity (category), Pre-pregnancy BMI (kg/m^2), BMI at measurement (kg/m^2), Gestational age (weeks), Alcohol consumption, Smoking, Vitamin-mineral supplements, Gestational diabetes, Gestational hypertension, Cholesterol (mg/dL), HDL-cholesterol (mg/dL), LDL-cholesterol (mg/dL), TAG (mg/dL), Season of the blood collection. Each row provides median values and quartiles for each category. Notable trends include variations in education, income, parity, gestational age, and lipid profiles across different 25(OH)D status groups.
BRL, Brazilian Real.
* The overall estimates represent the population-weighted average effects derived from generalised estimating equation models across the gestational periods.
† Kruskal–Wallis rank sum test; Pearson’s χ 2 test. Gestational periods investigated (≤19; 20–28 and 30–38 weeks).
Fetal growth and adiposity by 25(OH)D status in the three gestational periods investigated (Median values and quartiles)

Table 4. Long description
The table presents data on fetal growth and adiposity by 25(OH)D status across three gestational periods. It includes median values and quartiles for various variables. The table has 12 rows and 10 columns. Column headers are Variables, Overall (N 990) Median, Overall (N 990) Quartiles, Deficiency (N 199) Median, Deficiency (N 199) Quartiles, Insufficiency (N 451) Median, Insufficiency (N 451) Quartiles, Sufficiency (N 340) Median, Sufficiency (N 340) Quartiles, and P value. Row labels include Estimated fetal weight (g), Femur length (cm), Abdominal circumference (cm), Head circumference (cm), Biparietal diameter (cm), Abdominal subcutaneous Tissue (mm), Thigh subcutaneous total area (cm squared), Thigh muscle area (cm squared), Thigh fat area (cm squared), Arm muscle area (cm squared), and Arm fat area (cm squared). Each row provides median and quartile values for each 25(OH)D status category and the overall group, along with P values indicating statistical significance.
* The overall estimates represent the population-weighted average effects derived from generalised estimating equation models across the gestational periods.
† Kruskal–Wallis rank sum test. Gestational periods investigated (≤19; 20–28 and 30–38 weeks).
Association between maternal 25(OH)D concentrations and fetal outcomes
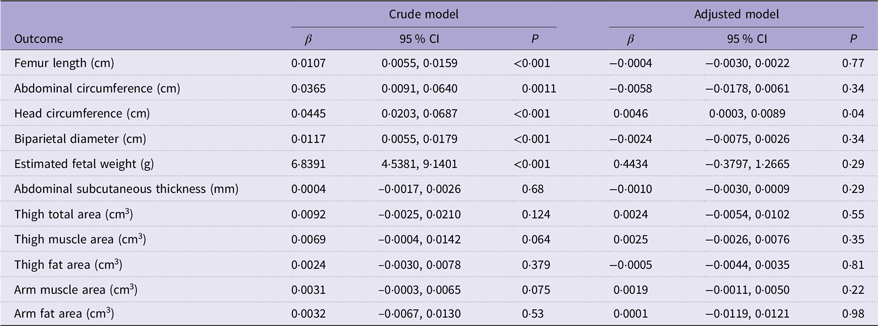
The effect estimates were generally attenuated after adjusting for potential confounding factors (Table 5). Although a statistically significant association was observed for HC in the adjusted model (p = 0·04), the magnitude of the effect was small (β = 0·0046; 95 % CI 0·0003, 0·0089). No consistent associations were observed for the other fetal biometric parameters after model adjustment. In the supplementary analysis using GEE models adjusted for interaction (Supplementary Table 2), vitamin D supplementation did not significantly modify the effects of 25(OH)D on fetal outcomes. Only TFA showed an interaction with supplementation (β = 0·0046 [95 % CI 0·0009, 0·0019]; p = 0·05).
Associations between maternal 25(OH)D concentrations and fetal outcomes across the gestational periods investigated (Coefficient values and 95 % confidence intervals)

Table 5. Long description
A table comparing the associations between maternal 25(OH)D concentrations and fetal outcomes across gestational periods. The table has 12 rows and 7 columns. Column headers are Outcome, Crude model β, Crude model 95 % CI, Crude model P, Adjusted model β, Adjusted model 95 % CI, and Adjusted model P. Row labels include Femur length (cm), Abdominal circumference (cm), Head circumference (cm), Biparietal diameter (cm), Estimated fetal weight (g), Abdominal subcutaneous thickness (mm), Thigh total area (cm³), Thigh muscle area (cm³), Thigh fat area (cm³), Arm muscle area (cm³), and Arm fat area (cm³). Each row provides values for the crude model and adjusted model, including β coefficients, 95 % confidence intervals, and P values. Notable trends include significant P values in the crude model for Femur length, Abdominal circumference, Head circumference, Biparietal diameter, and Estimated fetal weight, while the adjusted model shows a significant P value only for Head circumference.
Note: All models were fitted using generalised estimating equations with an autoregressive correlation structure and Gaussian family, adjusted for the following covariates: age, education, parity, pre-pregnancy BMI, per capita income, smoking, alcohol consumption, physical activity, gestational diabetes, gestational hypertension and LDL-cholesterol.
Sensitivity analyses demonstrated results consistent with those observed in the adjusted main model (Supplementary Table 3). The model excluding women who ingested vitamin–mineral supplements showed an association between maternal 25(OH)D concentrations and HC (β = 0·0048 [95 % CI 0·0000, 0·0096]; p = 0·05). Similarly, the model that excluded women with gestational diabetes, gestational hypertension and use of vitamin–mineral supplements produced similar results regarding the association between maternal 25(OH)D and fetal HC (β = 0·0053 [95 % CI 0·0004, 0·0102]; p = 0·03).
Residual diagnostics indicated an adequate model fit. Residuals were approximately normally distributed and centred around zero, with no clear evidence of major deviations from model assumptions. Minor departures from homoscedasticity were observed but were not considered to substantially affect the validity of the results (Supplementary Figure 3).
Discussion
In this study, unadjusted analyses showed that maternal 25(OH)D concentrations during the three periods of pregnancy were associated with several biometric parameters (FL, HC, BPD and EFW) and fetal adiposity measures (total, muscle and fat area of the thigh and muscle area of the arm). However, when adjusting the model for confounding variables, only HC remained significantly associated with maternal 25(OH)D concentrations. Although the effect was modest, this result indicates 25(OH)D as a marker of cranial growth since HC reflects both bone mineralisation and brain development(Reference Ryan and Kovacs1,Reference Saidi, Hammou and Sicard34) . Nevertheless, the association between 25(OH)D and HC should be interpreted with caution, given its borderline statistical significance and small effect size.
Studies evaluating the relationship between fetal biometry and 25(OH)D concentrations during pregnancy are scarce(Reference Miliku, Vinkhuyzen and Blanken17–Reference Beck, Blue and Silver19). Nevertheless, the available evidence suggests potential associations with fetal growth parameters, particularly HC. Miliku et al. (Reference Miliku, Vinkhuyzen and Blanken17) observed associations of maternal 25(OH)D concentrations in the second trimester (18·5–23·3 weeks) with EFW and HC. The authors concluded that lower quartiles of 25(OH)D (1·5–24·1 and 24·2–46·6 nmol/l) are associated with reduced HC growth from the second trimester of pregnancy onwards. Although that study had a robust sample size, it did not evaluate 25(OH)D concentrations in other periods of pregnancy.
A prospective Korean cohort of 245 mother–fetus pairs that assessed 25(OH)D concentrations at three gestational ages (12–14, 20–22 and 32–34 weeks) found no association between maternal 25(OH)D and fetal growth parameters, except for a positive association between 25(OH)D concentrations between 12–14 and 20–22 weeks and the growth rate of fetal BPD between 20–22 and 32–34 weeks(Reference Lee, Ryu and Han18). In contrast to our study, Lee et al.(Reference Lee, Ryu and Han18) reported an effect of maternal 25(OH)D only on BPD, although they also evaluated 25(OH)D during three periods of pregnancy. However, these authors did not use a specific method for longitudinal data analysis such as GEE applied in our study, which ensured higher accuracy in the prospective evaluation of 25(OH)D concentrations and fetal parameters.
Beck et al. (Reference Beck, Blue and Silver19) studied 351 nulliparous American pregnant women at two time points and observed that a 10-nmol/l increase in 25(OH)D in the first trimester (6–13 weeks) was associated with an increase of 0·05 (95 % CI 0·01–0·10) in the length-for-age z-score in the second trimester (16–21 weeks). However, the authors did not observe an association with EFW or HC. In this case, unlike our study and that of Miliku et al. (Reference Miliku, Vinkhuyzen and Blanken17), there was no association between 25(OH)D and HC. Furthermore, Beck et al. (Reference Beck, Blue and Silver19) used z-scores as an outcome of fetal growth. The inconsistency in the results of previous studies can be explained by methodological differences (time of 25(OH)D collection, statistical analysis, type of outcome: z-scores v. absolute measures) and contextual factors (race, diet, supplementation, latitude). It is worth noting that our study adds evidence from the Latin American context, which remains underrepresented.
To our knowledge, there is only one study that investigated the relationship between maternal 25(OH)D and fetal adiposity(Reference Akita, Ikenoue and Tamai20). In that study, the authors evaluated the relationship between maternal 25(OH)D and estimated fetal adiposity in eighty-nine Japanese pregnant women at different time points (10, 24, 30 and 36 weeks). Like our study, Akita et al. (Reference Akita, Ikenoue and Tamai20) also found significant associations between maternal 25(OH)D and fetal adiposity parameters in univariate analyses. However, when adjusting for multiple models, the associations between maternal 25(OH)D concentrations and fetal adiposity no longer persist. Taken together, these findings and those of the present study suggest that maternal 25(OH)D may have a greater influence on fetal structural mechanisms than on fetal adipose tissue accumulation, although further studies are needed to confirm this pattern.
The hypothesis underlying the relationship between 25(OH)D concentrations and HC may be related to fetal bone mineralisation, a process that is dependent on the active transport of calcium and phosphorus through the placenta, especially in the third trimester. Flat bones such as the skull depend on calcium for their formation through intramembranous ossification. 1,25(OH)2D regulates maternal calcium absorption and influences placental transporters such as calcium-dependent membrane ATPases, which are essential for fetal bone mineralisation. Vitamin D deficiency can compromise this transport, affecting especially bones of membranous ossification such as the skull. This process depends on placental calcium transport that is regulated by membrane ATPases, influencing the biometry of the fetal skeleton(Reference Ryan and Kovacs1,Reference Belkacemi, Bédard and Simoneau35,Reference Kovacs36) .
Supplementary analyses indicated that vitamin–mineral supplement intake did not significantly alter the association between maternal 25(OH)D concentrations and the fetal outcomes evaluated; only TFA showed a marginal interaction. A prospective cohort study conducted by Jakubiec-Wisniewska, Huras and Kolak(Reference Jakubiec-Wisniewska, Huras and Kolak37) compared the effects of 25(OH)D supplementation on fetal biometry between women with intrauterine growth restriction who ingested less than 500 IU and the recommended dose of 2000 IU. The authors found a significant increase in mean fetal weight gain at the dose of 2000 IU compared with doses lower than 500 IU (p = 0·001)(Reference Jakubiec-Wisniewska, Huras and Kolak37).
We found no clinical trials that evaluated the effects of 25(OH)D supplementation on fetal biometry or adiposity. In a randomised clinical trial conducted by Cooper et al. (Reference Cooper, Harvey and Bishop38) (Maternal Vitamin D Osteoporosis Study (MAVIDOS)), maternal supplementation with vitamin D 1000 IU/d did not lead to increased neonatal whole-body bone mineral content, birth weight, HC, crown-heel length, AC, fat and lean mass assessed within 2 weeks of birth. However, a pre-specified subgroup analysis showed greater bone mass in babies born in winter whose mothers received vitamin D supplementation compared with the placebo group of mothers. Subsequent follow-up studies of MAVIDOS demonstrated higher bone mineral density in children at 4 and 6–7 years, suggesting that prenatal vitamin D supplementation may have lasting effects on skeletal development(Reference Curtis, Moon and D’Angelo39,Reference Moon, D’ Angelo and Curtis40) .
Strengths of the study
We highlight the following strengths of the study: (1) the prospective cohort design that permitted to monitor the women over three different periods, as well as the use of standardised ultrasound protocols; (2) simultaneous use of classic fetal growth indicators and fetal adiposity measures (the latter were used for the first time in this type of study); (3) use of GEE modelling, which permitted to consider intraindividual correlations between repeated measures throughout pregnancy, ensuring greater robustness of the analyses; and (4) this is the first study that jointly analysed the relationship between 25(OH)D concentrations and fetal adiposity using GEE.
Limitations
The following limitations must be cited: (1) 25(OH)D concentrations were analysed by chemiluminescence, a technique prone to analytical variations when compared with the gold standard (HPLC–tandem MS); (2) although the statistical models were adjusted for confounding factors using directed acyclic graph, the possibility of confounding bias cannot be ruled out; and (3) the study population consisted of women using the Brazilian Unified Health System (SUS) in a particular municipality, a fact that may limit generalisation of the findings.
Conclusions
In this study, maternal 25(OH)D concentrations were associated with greater fetal HC. This finding suggests a role of this vitamin in cranial development, possibly related to its function in calcium regulation, which is important for cranial bone mineralisation. Despite the lack of consistent associations with fetal adiposity, the results may contribute to the body of evidence on the importance of 25(OH)D during pregnancy. Future studies with larger sample sizes that correlate maternal 25(OH)D with fetal body composition are needed to confirm and further explore these findings. Prenatal monitoring of 25(OH)D concentrations should be adopted as an important public health policy aimed at improving maternal and child health.
Supplementary material
For supplementary material/s referred to in this article, please visit https://doi.org/10.1017/S0007114526108289.
Data availability statement
The data are available from the corresponding author and the coordinator of the Araraquara Cohort (PHCR) upon reasonable request.
Acknowledgements
We would like to thank all professionals and undergraduate and postgraduate students who helped with the data collection. We are indebted to the Araraquara Special Health Service, ‘Gota de Leite Vovó Mocinha’ Municipal Maternity Hospital and Araraquara City Hall for providing the space for data collection.
This study was supported by the São Paulo Research Foundation (FAPESP; grant no. 2015/03333-6). IOA and AV received Doctoral scholarships from FAPESP (grants 2024/01014-0, 2023/07936-3). TRS and NPC received, respectively, Master and Postdoctoral scholarships from FAPESP (grants 2023/02404-3 and 2020/15365-8). FARM received a Doctoral scholarship from the Brazilian Coordination for the Improvement of Higher Education Personnel (Coordenação de Aperfeiçoamento de Pessoal de Nível Superior).
IOA, AV and PHCR contributed to conceptualisation of the study, formal analysis and methodology. AV and IOA were responsible for data curation. PHCR oversaw funding acquisition and supervision and handled project administration. IOA, FAMR, TRS, NPC, LAL and PHCR conducted the investigation. IOA, AV, LAL and PHCR were responsible for original draft preparation, visualisation and manuscript revisions. All authors read and approved the final version of the manuscript.
The authors declare no conflicts of interest.