





High-quality diets in line with food-based dietary guidelines, which consist predominantly of plant-based foods (e.g. vegetables, fruits, berries, whole grains, legumes, nuts) and limited intakes of red and processed meat and salt, can promote health and reduce the risk for diet-related non-communicable diseases(Reference Rockström, Thilsted and Willett1–Reference Dalwood, Marshall and Burrows4). A systematic review of twelve studies in adults found higher diet quality scores among lacto-ovo-vegetarians and vegans compared to omnivores in Western countries(Reference Parker and Vadiveloo5). The higher score is in part explained by lacto-ovo-vegetarians and vegans’ better adherence to the dietary recommendations for intakes of fruit, whole grain, plant-protein sources and sodium. Similar results were found in a study of Norwegian youth, where vegans, lacto-ovo-vegetarians, pescatarians and flexitarians had higher diet quality scores compared to omnivores(Reference Groufh-Jacobsen, Larsson and Van Daele6). Yet, regardless of dietary practice, youth in the Norwegian study had diet quality scores categorised as moderate, indicating suboptimal diets(Reference Groufh-Jacobsen, Larsson and Van Daele6). This suggests that youth face challenges in meeting food-based dietary guidelines, regardless of plant-based or omnivorous diet. To navigate the modern-day food environment, make informed food choices and adhere to healthy diets aligned with food-based dietary guidelines and nutrient recommendations (dietary recommendations), it is suggested that youth must be equipped with food literacy competencies(Reference Slater, Falkenberg and Rutherford7).
There are several definitions of ‘food literacy’ within the academic literature(Reference Thompson, Adams and Vidgen8–Reference Vidgen and Gallegos10). The most widely used is the one by Vidgen and Gallegos who define food literacy as ‘[…] a collection of inter-related knowledge, skills and behaviours required to plan, manage, select, prepare and eat food to meet needs and determine intake’(Reference Vidgen and Gallegos10). However, food literacy is recognised as a multidimensional concept that extends beyond individual knowledge, skills and behaviours needed to adhere to healthy diets(Reference Slater, Falkenberg and Rutherford7,Reference Truman, Lane and Elliott9,Reference Azevedo Perry, Thomas and Samra11) . Slater et al.(Reference Slater, Falkenberg and Rutherford7) identified several food literacy competencies, categorised as functional, relational or systems competencies, which are considered important for youth to be equipped with when they transition into adulthood and independent living. Functional competencies include the practical knowledge, skills and behaviours required for everyday food-related practices to achieve healthy, nutritionally adequate diets(Reference Slater, Falkenberg and Rutherford7). Relational competencies can support youth to develop a life-long positive relationship with food(Reference Slater, Falkenberg and Rutherford7). Systems competencies can help youth to understand factors that influence food systems and to critically engage with food systems(Reference Slater, Falkenberg and Rutherford7).
To achieve nutritionally adequate diets in line with dietary recommendations in everyday life, functional food literacy competencies (e.g. ‘have basic nutrition knowledge’, ‘have food preparation skills’, ‘have food budgeting skills’, ‘have the ability to critically think about and act on food and nutrition issues’) are considered important(Reference Groufh-Jacobsen, Larsson and Van Daele6,Reference Slater, Falkenberg and Rutherford7,Reference Vidgen and Gallegos10) . Studies among adolescents and young adults have found that having higher nutrition knowledge(Reference Groufh-Jacobsen, Larsson and Van Daele6,Reference O’Leary, Mooney and McCloat12,Reference Vaitkeviciute, Ball and Harris13) , higher frequency of food preparation at home(Reference Larson, Perry and Story14,Reference Laska, Larson and Neumark-Sztainer15) and cooking meals for oneself(Reference Thorpe, Kestin and Riddell16) are all associated with higher diet quality scores (or healthier food habits) and better adherence to some dietary recommendations. To the best of our knowledge, only one previous study has researched food literacy competencies and diet quality in youth adhering to plant-based diets(Reference Groufh-Jacobsen, Larsson and Van Daele6). This study aims to assess food literacy competencies and diet quality in youth adhering to vegan, lacto-ovo-vegetarian, pescatarian or omnivorous diets in Sweden and to investigate if, and which, food literacy competencies are associated with youths’ diet quality.
Methods
Study design, eligibility criteria and exclusion of participants
This cross-sectional study is part of an internationally collaborative research project named VeggiSkills. The project includes studies conducted in both Norway and Sweden, using parallel study designs and similar methods, enabling cross-cultural comparisons. The research described in this paper is part of the Swedish research project, VeggiSkills-Sweden, and was conducted 1 year after the study in Norway(Reference Groufh-Jacobsen, Larsson and Van Daele6).
In the present study, healthy youth were recruited by convenience and snowball sampling between December 2022 and January 2024 in Gothenburg, Sweden, and nearby municipalities. More details about the study design and recruitment methods have been published previously(Reference Mulkerrins, Medin and Groufh-Jacobsen17). As an incentive for participation, youth could receive their own health and dietary intake information after their study participation was complete. Participants who completed all on-site measurements as well as the three dietary assessments at home were eligible to enter a draw for grocery store gift cards (€25).
Eligibility criteria included ‘aged 16 to 24 years’, ‘healthy with no chronic or acute illness’, ‘not be pregnant, lactating, or have children’, ‘have adhered to their current dietary practice (vegan, lacto-ovo-vegetarian, pescatarian, omnivore) for a minimum of six months and not plan to alter their dietary practice’, ‘understand Swedish’, ‘live in Gothenburg, or nearby municipalities’ and ‘agree to physically visit a research facility at the University of Gothenburg once for measurements’.
A total of 244 participants were recruited to this study; however, nine participants were excluded during the data processing stage. Reasons for exclusion were dietary practice ineligibility (n 7) and completing only one out of four 24-h recalls (n 2). More details have been provided previously(Reference Mulkerrins, Medin and Groufh-Jacobsen17,Reference Mulkerrins, Medin and Groufh-Jacobsen18) .
Data collection and data processing
Web-based questionnaire
All participants visited a research facility at the University of Gothenburg once to complete several measurements on site. During the visit, they completed a 255-item questionnaire in a web-based platform (Webropol AB) while under supervision (by the first author). The questionnaire assessed dietary habits, food choice motives, food literacy competencies, health and lifestyle habits, and sociodemographics. Almost all questions required a response, with a response alternative such as ‘unsure’ available when appropriate, which limited missing data. Completion time was not recorded. The questionnaire was pilot-tested in two rounds (total n 25, mean age 21 years) prior to being used in this study.
Food literacy competencies
There is yet to be a consensus within the academic community about how food literacy should be measured(Reference Thompson, Adams and Vidgen8,Reference Carroll, Perreault and Ma19–Reference Thomas, Azevedo Perry and Slack21) . This is partly due to the recognition that food literacy is contextual(Reference Ares, De Rosso and Mueller22), and therefore tools used to measure food literacy need to be culturally appropriate and suitable for the age and life stage of the study population. Few available tools comprehensively measure food literacy specifically for youth, and no existing tools have been adapted to the Swedish context(Reference Carroll, Perreault and Ma19,Reference Groufh-Jacobsen and Medin20) .
To select which food literacy competencies to assess, we were guided by the conceptual food literacy framework for youth by Slater et al.(Reference Slater, Falkenberg and Rutherford7). Currently, no tool exists which measures all food literacy competencies outlined in the framework by Slater et al(Reference Slater, Falkenberg and Rutherford7,Reference Groufh-Jacobsen and Medin20) . In this study, we focused on some functional competencies, which are considered important for youth to be equipped with in their everyday life to be able to compose nutritionally adequate diets in line with dietary recommendations. More specifically, these were ‘have basic nutrition knowledge’, ‘be able to think critically about and act on food and nutrition issues’, ‘have food preparation skills’ and ‘have food budgeting skills’. In this study, the abovementioned food literacy competencies are operationalised as general nutrition knowledge (GNK), critical nutrition literacy (CNL), and food skills, and were measured using different tools and questions.
General nutrition knowledge
To measure GNK, an adapted and shortened version of the validated General Nutrition Knowledge Questionnaire-Revised (GNKQ-R)(Reference Kliemann, Wardle and Johnson23) was used. The adaptions made included translating the GNKQ-R to Swedish and modifying or replacing some of the questions and response alternatives to better suit the Swedish context and target population. Also, ‘Section 4: Diet and disease’ from the GNKQ-R was omitted since the questions do not align with Swedish guidelines for dietary intake and prevention of disease. This resulted in a total of twenty-nine questions (including multiple-item questions) categorised into three sections (Section 1: Dietary recommendations, Section 2: Food groups, Section 3: Healthy food choices). A description of the adaptions made are presented in Supplemental Table 1.
To code the responses, each correct answer was given one point and each wrong answer (including the response alternative ‘unsure’) was given zero points. For the total GNK score, the section scores were calculated (Section 1 = 0·0–18·0 points, Section 2 = 0·0–44·0 points, Section 3 = 0·0–10·0 points) and then summed together. There was a possible score of 0·0–72·0. A higher score is indicative of a higher GNK.
To descriptively describe youths’ level of GNK, Bloom’s cut-offs(Reference Bloom24) were used, categorising the total GNK score as ‘low’ (<60 %, i.e. 0–42 points), ‘moderate’ (60–79 %, i.e. 43–57 points) and ‘high’ (80–100 %, i.e. 58–72 points)(Reference Groufh-Jacobsen, Larsson and Van Daele6).
Critical nutrition literacy
To measure CNL, the ‘claims scale’ from the validated CNL instrument by Guttersrud(Reference Guttersrud, Dalane and Pettersen25) was used. The claims scale assesses the ability to ‘take a critical stance towards nutrition claims and their sources’(Reference Guttersrud, Dalane and Pettersen25). The original instrument consists of eleven statements, but in the present study Item 25 was removed, as recommended by the authors of the instrument due to the statement being a true/false statement(Reference Guttersrud, Dalane and Pettersen25). Participants were asked in the questionnaire to report how much they agreed (1 = Strongly disagree, 2 = Partly disagree, 3 = Neither agree nor disagree, 4 = Partly agree, 5 = Strongly agree, 6 = Unsure) with ten different Likert-scale statements (Supplemental Table 2). For four statements, a higher agreement indicated a higher level of CNL and were scored positively (1 = 1, 2 = 2, 3 = 3, 4 = 4, 5 = 5, 6 = 3). For six statements, a higher agreement indicated a lower level of CNL, and the statements were scored in reverse (1 = 5, 2 = 4, 3 = 3, 4 = 2, 5 = 1, 6 = 3). The score for each of the statements were summed together and then averaged, with a possible score of 1·0–5·0. A higher score is indicative of a higher level of CNL.
Food skills
To assess components of participants’ food skills, ten Likert-scale statements based on the validated food skills questionnaire by Kennedy et al.(Reference Kennedy, Kichler and Seabrook26) were used. These ten food skill statements were purposefully selected to assess youths’ self-perceived confidence in their ability to prepare, cook, and store foods; plan meals; budget for grocery shopping; follow and adapt recipes; and compose healthy, well-balanced meals; in this paper, this is referred to as ‘confidence in food skills’ (Supplemental Table 3). Participants were asked to respond, for each statement, with how confident (1 = Not at all confident, 2 = Slightly unconfident, 3 = Neither confident nor unconfident, 4 = Fairly confident, 5 = Very confident) they felt in their ability to perform the food skill. The scoring for each statement was positive (1 = 1, 2 = 2, 3 = 3, 4 = 4, 5 = 5). The scores for each of the statements were summed together and then averaged, with a possible score of 1·0–5·0. A higher score is indicative of a higher self-perceived confidence level in their ability to perform the food skills.
Furthermore, components of participants’ food skills were measured through additional questions. Participants were asked to report how often in the past 6 months they had cooked meals at home for themselves or others (‘less often than once a week’, ‘1 times/week’, ‘2–3 times/week’, ‘4–5 times/week’, ‘almost daily’) and how often they had eaten pre-made meals or take-away from restaurants, cafés, fast-food restaurants, convenience stores or food delivery services (‘never’, ‘less often than once a week’, ‘1 times/week’, ‘2–3 times/week’, ‘4–5 times/week’, ‘almost daily’). Moreover, they were asked to report if they did their own grocery shopping (‘yes’, ‘sometimes’, ‘no’), and if they had an interest in food and/or cooking (‘yes’ or ‘no’).
Sources used to get information about food/nutrition
A question was included to examine which sources youth used to get their information about food/nutrition. In the questionnaire, participants were asked to select if they used any of the eleven predefined options (Supplemental Table 4), with an open text box to specify if other sources were used.
Diet Quality Index score
Dietary intake data were obtained, for each participant, from repeated 24-h recalls (between 2 and 4) completed in a web-based dietary assessment programme (Nutrition Data Sweden AB). Additionally, consumption frequency of twenty-nine food groups was obtained using a revised, validated dietary screener included in the questionnaire(Reference Salvesen, Wills and Øverby27). The dietary assessment methods have been described in detail elsewhere(Reference Mulkerrins, Medin and Groufh-Jacobsen17,Reference Mulkerrins, Medin and Groufh-Jacobsen18) .
To assess diet quality, a Diet Quality Index (DQI) score was calculated based on usual intakes (estimated using the Multiple Source Method) of foods/food constitutes and nutrients (from foods only). Our approach of including intakes of both foods and nutrients in the DQI reflects diet quality as a measurement of both dietary composition and nutritional adequacy, and the DQI quantifies overall adherence to dietary recommendations by the Nordic Nutrition Recommendations 2023 (NNR2023). However, recommendations for dairy products, fish, red meat, and vitamin B12 were excluded from the DQI to ensure equal scoring potential across the dietary groups.
The total DQI score was based on three sections and consisted of thirty-four dietary components. The dietary components were scored either positively (i.e. intake/dietary recommendation) or negatively (i.e. an increased deduction of points with a larger deviation in intake compared to the dietary recommendation). Per dietary component, a maximum score of 1·0 was given if the individual intake aligned with the dietary recommendation. A description of the scoring system is provided in Supplemental Table 5. The NNR2023 recommend that pulses constitute a significant part of the diet but do not specify a recommended daily intake(Reference Blomhoff, Andersen and Arnesen28). Yet the 2021 Global Burden of Disease study define a diet low in legumes as intakes of <100 g/d(Reference Porschmann, Meier and Lorkowski2,29) . Therefore, 100 g/d was set as the criteria for achieving the maximum score for this dietary component.
For each participant, their section scores of the DQI were calculated, that is, food-based dietary guidelines (maximum score of 6·0), macronutrient recommendations (maximum score of 10·0) and micronutrient average requirements (maximum score of 18·0), and then summed together, resulting in a maximum possible DQI score of 34·0. A higher total DQI score reflects a higher overall alignment with the dietary recommendations by NNR2023.
Measurement of anthropometrics
Participants’ height and body weight were measured on site according to a standard protocol (standing, wearing light clothing, no shoes on), using a wall-mounted stadiometer (Hyssna M) and a digital scale (Beurer GmbH). Height and body weight were measured to the closest 0·1 cm and 0·1 kg, respectively. BMI was calculated, that is, kg/m2.
Categorisation into dietary groups
To categorise participants into dietary groups, they were asked in the questionnaire to self-report which dietary practice they had followed in the past 6 months. In the response alternatives, the animal-sourced food groups included and excluded in each dietary practice were specified. The participants’ self-reported dietary practice was then cross-checked with their responses to a question assessing how often they had included different animal-sourced food groups in their diet during the past 6 months.
They were categorised as vegan if they self-reported a vegan diet and selected ‘never’ to inclusion of all the animal-sourced food groups. They were categorised as lacto-ovo-vegetarian if they self-reported a lacto-, ovo- or lacto-ovo-vegetarian diet and selected ‘rarely’, ‘sometimes’ or ‘daily’ for eggs and/or dairy products, but ‘never’ for fish/seafood or meat (any type). They were categorised as pescatarian if they self-reported a pescatarian diet and selected ‘rarely’, ‘sometimes’ or ‘daily’ for fish/seafood, but ‘never’ for meat (any type), regardless of inclusion of eggs and/or dairy products. They were categorised as omnivore if they self-reported an omnivorous diet and selected ‘rarely’, ‘sometimes’ or ‘daily’ for meat (any type), as well as reported including at least one other animal-sourced food group.
Further details on the categorisation into dietary groups and the handling of inconsistencies in self-reported responses have been described previously(Reference Mulkerrins, Medin and Groufh-Jacobsen18).
Sociodemographic variables
Participants were asked in the questionnaire to report their living arrangement and their parents’ highest completed education level. Participants who reported living alone, with a partner, or in a collectively shared house were categorised as ‘having moved away from their parental residency’. For analysis, parental education was dichotomised as ‘<3 years’ or ‘≥3 years’ of university education, and this was done separately for each parent.
Statistical analyses
Sample size
The sample size aimed for in the research project, VeggiSkills-Sweden, (n 60 per dietary group) was calculated based on being able to detect differences between vegans and omnivores in key selected dietary intake variables(Reference Mulkerrins, Medin and Groufh-Jacobsen18). However, for this paper, calculations were performed a posteriori using data from a similar study of youth in Norway(Reference Groufh-Jacobsen, Larsson and Van Daele6). This showed that to detect a difference of 6·0 points in GNK score and 0·5 points in CNL score between four groups(Reference Ritz, Olsen and Grenov30), 54 and 35 participants, respectively, were required per dietary group.
Assessment of internal reliability of the modified tools applied
The internal reliability of the modified tools (GNKQ-R and food skills questionnaire) was assessed using Cronbach’s α, where α ≥ 0·70 indicated an acceptable reliability(Reference Kliemann, Wardle and Johnson23,Reference Field31) . Furthermore, Cronbach’s α was examined for each item of the tool to assess if any items improved or reduced the internal reliability when removed.
Tests for differences between dietary groups
Normality of data was evaluated by histograms and the Shapiro–Wilk test. To test for differences between dietary groups in categorical variables, cross-tabulations with chi-squared or Fisher’s exact test were used, and to test for differences in continuous variables, one-way ANOVA was conducted. The Bonferroni post hoc test was employed to correct for multiple analyses. For continuous variables which were not normally distributed (age, BMI, GNK score (total and section scores) and individual dietary components of the DQI), both one-way ANOVA and the non-parametric Kruskal–Wallis test with pairwise comparisons were run to evaluate differences in outcomes. In this paper, all continuous data are presented as means and standard deviations, and categorical data is presented as numbers and percentages (%). Statistical significance was accepted as an adjusted p-value <0·05 (two-sided). Data were analysed using SPSS version 29 (IBM SPSS Statistics).
Multivariable-adjusted regression analysis
To investigate whether food literacy competencies were associated with the total DQI score, multiple linear regression analyses were run separately for the following variables: ‘total GNK score’, ‘CNL score’, ‘ confidence in food skills score’, ‘doing your own grocery shopping (no/sometimes, ref)’, ‘frequency of cooking meals (≤3 times/week, ref)’ and ‘frequency of eating meals pre-prepared outside the home (<1 times/week or never, ref)’ with the total DQI score as the dependent variable. If the independent variable was significant (p < 0·05), it was retained in Model 1, which was adjusted for sex (male, ref), age (years), BMI (kg/m2), mothers education level (<3 years of university education, ref) and fathers education level (<3 years of university education, ref). If the independent variable remained significant in Model 1, it was included in the Final Model, which additionally adjusted for dietary practice (omnivore, ref). The covariates were selected based on prior literature(Reference Groufh-Jacobsen, Larsson and Van Daele6,Reference Thorpe, Kestin and Riddell16) . Interaction effects between dietary practice and the independent variables were evaluated, and no interactions were found. To assess the association between the independent variables, Spearman’s rank correlation was performed using r < 0·5 as a cut-off to indicate a low concern for multicollinearity(Reference Field31).
Results
Participant characteristics
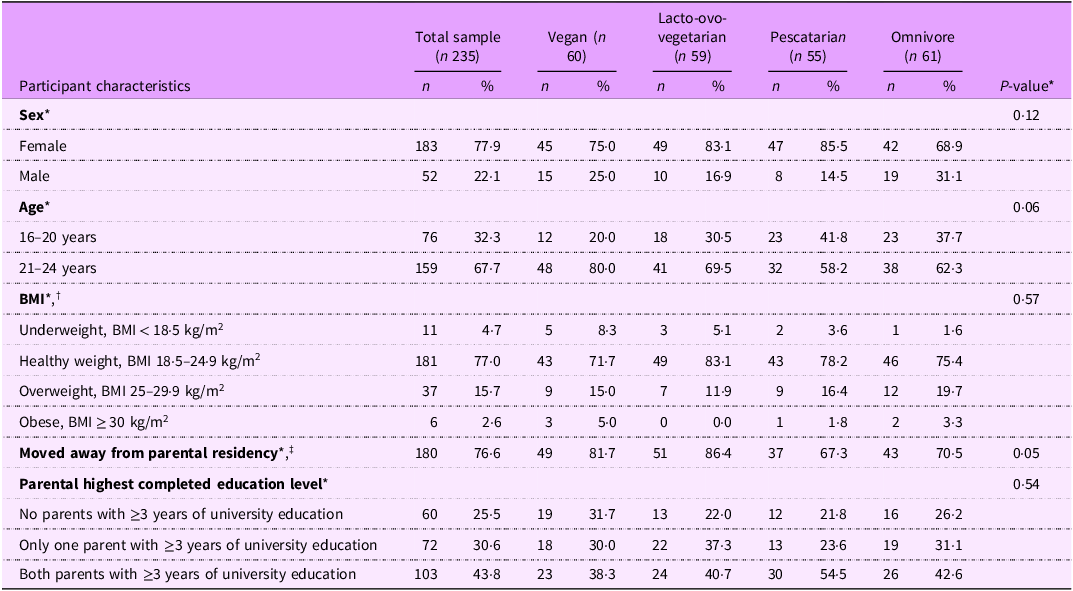
Participant characteristics are presented in Table 1.
Participant characteristics of youth adhering to vegan, lacto-ovo-vegetarian, pescatarian or omnivorous diets in Sweden (n 235)

Table 1. Long description
The table presents participant characteristics of youth adhering to vegan, lacto-ovo-vegetarian, pescatarian, or omnivorous diets in Sweden. It includes data for 235 participants, divided into four dietary groups: vegan (60 participants), lacto-ovo-vegetarian (59 participants), pescatarian (55 participants), and omnivore (61 participants). The table has 6 rows and 10 columns, including headers. Row 1: Sex, Female, 183, 77.9, 45, 75.0, 49, 83.1, 47, 85.5, 42, 68.9. Row 2: Sex, Male, 52, 22.1, 15, 25.0, 10, 16.9, 8, 14.5, 19, 31.1. Row 3: Age, 16-20 years, 76, 32.3, 12, 20.0, 18, 30.5, 23, 41.8, 23, 37.7. Row 4: Age, 21-24 years, 159, 67.7, 48, 80.0, 41, 69.5, 32, 58.2, 38, 62.3. Row 5: BMI, Underweight, BMI < 18.5 kg/m^2, 11, 4.7, 5, 8.3, 3, 5.1, 2, 3.6, 1, 1.6. Row 6: BMI, Healthy weight, BMI 18.5-24.9 kg/m^2, 181, 77.0, 43, 71.7, 49, 83.1, 43, 78.2, 46, 75.4. Row 7: BMI, Overweight, BMI 25-29.9 kg/m^2, 37, 15.7, 9, 15.0, 7, 11.9, 9, 16.4, 12, 19.7. Row 8: BMI, Obese, BMI >= 30 kg/m^2, 6, 2.6, 3, 5.0, 0, 0.0, 1, 1.8, 2, 3.3. Row 9: Moved away from parental residency, 180, 76.6, 49, 81.7, 51, 86.4, 37, 67.3, 43, 70.5. Row 10: Parental highest completed education level, No parents with >= 3 years of university education, 60, 25.5, 19, 31.7, 13, 22.0, 12, 21.8, 16, 26.2. Row 11: Parental highest completed education level, Only one parent with >= 3 years of university education, 72, 30.6, 18, 30.0, 22, 37.3, 13, 23.6, 19, 31.1. Row 12: Parental highest completed education level, Both parents with >= 3 years of university education, 103, 43.8, 23, 38.3, 24, 40.7, 30, 54.5, 26, 42.6.
* To test for differences between dietary groups, cross-tabulations with chi-squared or Fisher’s exact test were used with Bonferroni post hoc test.
† Categorised according to the WHO cut-offs, and for those aged 16–18 years (n 16), they were categorised according to the International Obesity Task Force cut-offs(Reference Cole and Lobstein54).
‡ The responses: ‘living alone’, ‘living with a partner’ or ‘living in a collectively shared house’. Adjusted two-sided P-value of <0.05 was accepted as statistically significant.
The final sample consisted of 235 healthy youth (60 vegans, 59 lacto-ovo-vegetarians, 55 pescatarians, 61 omnivores) aged 16–24 years. In the sample, the majority were female (77·9 %), aged 21 to 24 years (67·7 %), had a healthy weight (77·0 % with a BMI between 18·5–24·9 kg/m2), had highly educated parents (74·4 % had at least one parent with ≥3 years of university education) and had moved out of their parental residency (76·6 %). These characteristics did not significantly differ between the four groups.
Internal reliability of the modified tools applied
The internal reliability of the modified GNKQ-R was acceptable for the overall GNKQ-R (α = 0·89), ‘Section 1: Dietary recommendations’ (α = 0·73) and ‘Section 2: Food groups’ (α = 0·84). However, ‘Section 3: Healthy food choices’ fell below the threshold for an acceptable internal reliability (α = 0·47). Removal of items did not change the internal reliability for the overall GNKQ-R, or any of the sections. The confidence in food skills tool showed an acceptable internal reliability (α = 0·84), indicating that the ten selected statements measured related components of food skills, and removal of any items did not change the internal reliability.
Food literacy competencies
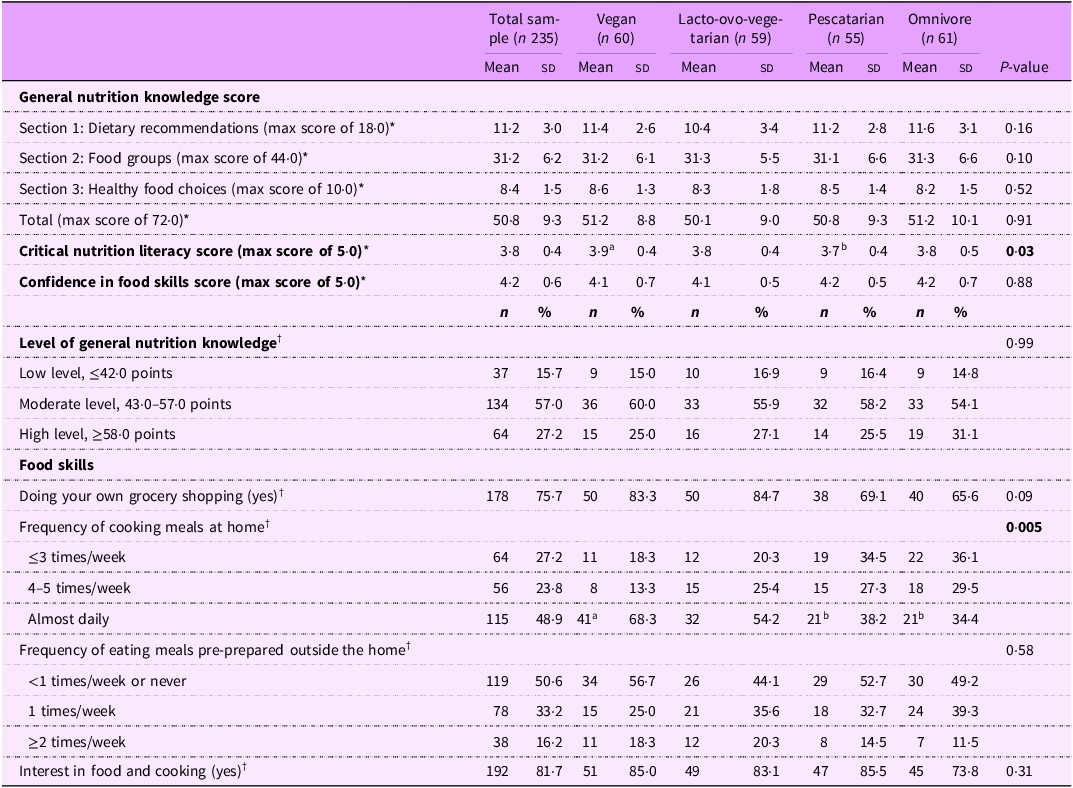
In Table 2, food literacy competencies (GNK, CNL, and food skills) are presented as means ± sd or numbers and percentages (%).
Food literacy competencies among youth adhering to vegan, lacto-ovo-vegetarian, pescatarian or omnivorous diets (n 235)

Table 2. Long description
The table presents food literacy competencies among youth adhering to vegan, lacto-ovo-vegetarian, pescatarian, and omnivorous diets. It includes data for 235 participants, divided into four dietary groups: vegan (60), lacto-ovo-vegetarian (59), pescatarian (55), and omnivore (61). The table is organized into several sections: General nutrition knowledge score, Critical nutrition literacy score, Confidence in food skills score, Level of general nutrition knowledge, and Food skills. Each section contains mean scores, standard deviations, and percentages. For example, the General nutrition knowledge score section includes scores for dietary recommendations, food groups, and healthy food choices. The Critical nutrition literacy score and Confidence in food skills score are also presented. The Level of general nutrition knowledge is categorized into low, moderate, and high levels. Food skills include doing grocery shopping, frequency of cooking meals at home, frequency of eating meals pre-prepared outside the home, and interest in food and cooking. Notable trends include variations in critical nutrition literacy scores and frequency of cooking meals at home among different dietary groups.
* Test for differences between dietary groups were performed using one-way ANOVA with Bonferroni post hoc test. Bolded P-values indicate a significant difference between dietary groups, and different letters (a,b) within the same row indicate between which groups there is a difference.
† Test for differences between dietary groups using cross-tabulations with chi-squared or Fisher’s exact test with Bonferroni post hoc test. The percentage is shown within the dietary group. Adjusted two-sided P-value of <0.05 was accepted as statistically significant.
General nutrition knowledge
The mean ± sd total GNK score in the sample was 50·8 (sd 9·3) out of 72·0, indicating a moderate level of GNK (43.0–57.0 points). There was no significant difference between dietary groups in total GNK score or in the section scores (Table 2). Notably, the youth demonstrated the least number of correct responses in ‘Section 1: Dietary recommendations’ of the GNKQ-R (11·2 (sd 3·0) out of 18·0; 62·2 % of items answered correctly).
Critical nutrition literacy
Vegans had a small, but significantly higher, mean ± sd CNL score compared to pescatarians (3·9 (sd 0·4) v. 3·7 (sd 0·4); post hoc, p = 0·02). For the statement ‘I find it hard to distinguish scientific dietary information from non-scientific dietary information (Item 28)’, a higher percentage of vegans disagreed with this statement, resulting in a higher CNL score compared to pescatarians (3·7 (sd 1·2) v. 2·9 (sd 1·1); post hoc, p = 0·001) (Supplemental Table 2).
Food skills
In the total sample, the mean ± sd score for confidence in food skills was 4·2 (sd 0·6) (out of 5·0), indicating that the youth felt confident in their ability to perform different food skills, and no significant difference in score was found between dietary groups. However, for the food skill ‘preparing and/or cooking legumes’, vegans had a significantly higher score compared to omnivores (4·4 (sd 0·9) v. 3·9 (sd 1·3); post hoc, p = 0·01) (Supplemental Table 3).
Overall, most youth who participated in this study reported having an interest in food and/or cooking (81·7 %), doing their own grocery shopping (75·7 %), and eating meals pre-prepared outside the home less often than once per week or never (50·6 %), and no significant differences were found between dietary groups. Significantly more vegans (68·3 %) reported cooking meals at home almost daily compared to pescatarians (38·2 %) and omnivores (34·4 %), p = 0·005.
Sources used to get information about food/nutrition
The percentage of youth who reported using eleven different sources to get their information about food/nutrition is shown in Figure 1.
Sources used to get information about food/nutrition.

Significantly fewer vegans reported getting their food/nutrition information from doctors/nurses (15·0 % v. 37·7 % of omnivores), family (18·3 % v. 49·1 % of pescatarians and 41·0 % of omnivores), friends (16·7 % v. 39·0 % of lacto-ovo-vegetarians, 41·8 % of pescatarians and 42·6 % of omnivores) and cookbooks or food companies (36·7 % v. 61·8 % of pescatarians). Meanwhile, significantly fewer omnivores (23·0 %) reported getting their food/nutrition information from documentaries v. all other dietary groups (66·7 % of vegans, 50·8 % of lacto-ovo-vegetarians and 50·9 % of pescatarians). More detailed results are presented in Supplemental Table 4.
Diet Quality Index scores
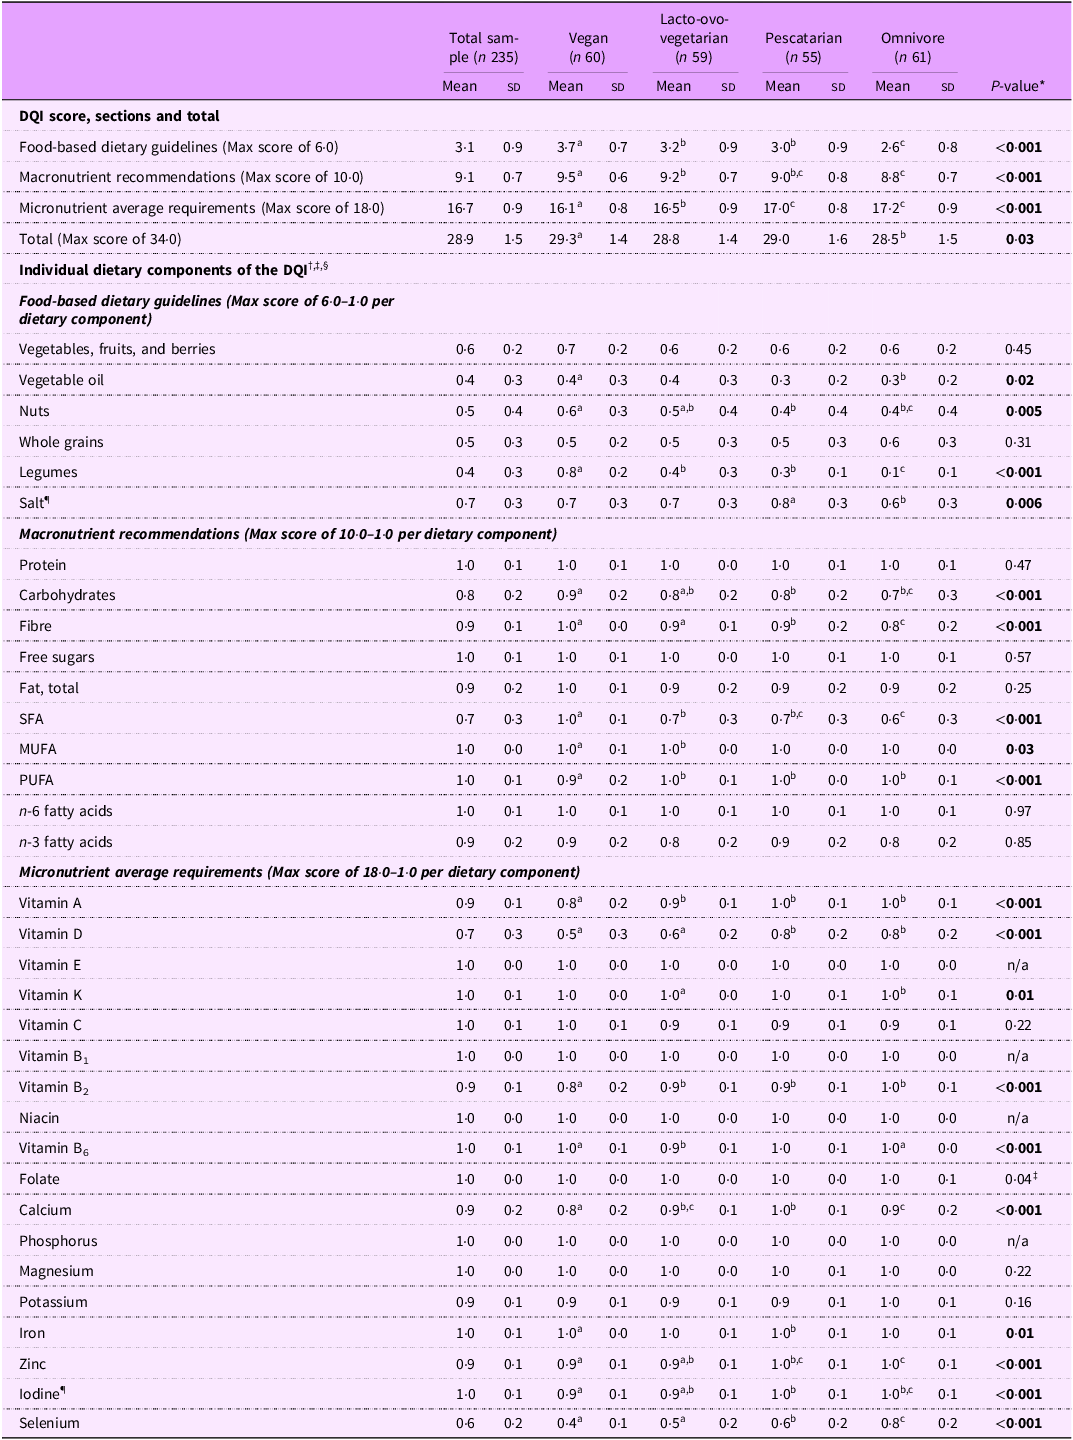
The DQI scores (total, section and individual dietary components) are presented as mean ± sd in Table 3.
Diet Quality Index (DQI) scores among youth adhering to vegan, lacto-ovo-vegetarian, pescatarian or omnivorous diets (n 235)

Table 3. Long description
A table comparing Diet Quality Index (DQI) scores among youth adhering to vegan, lacto-ovo-vegetarian, pescatarian, and omnivorous diets. The table has 34 rows and 7 columns. Columns are labeled: Total sample (n 235), Vegan (n 60), Lacto-ovo-vegetarian (n 59), Pescatarian (n 55), Omnivore (n 61), and P-value. Row labels include DQI score sections and total, individual dietary components of the DQI, food-based dietary guidelines, macronutrient recommendations, and micronutrient average requirements. Each row provides mean and standard deviation values for each dietary group and a P-value indicating statistical significance. Notable trends include variations in DQI scores and individual dietary components across different dietary groups.
n/a, not applicable.
* For all tests, one-way ANOVA was used to test for differences between dietary groups, with Bonferroni post hoc test. Bolded P-values indicate significant differences between dietary groups, and different letters (a,b,c) within the same row indicate which groups differ.
† All individual dietary components had a maximum score of 1.0 (range 0.0–1.0), totalling a maximum possible DQI score of 34.0.
‡ Scores for positively scored components (i.e. food-based dietary guidelines (excluding salt) and micronutrient average requirements) are expressed as ratios of intake to recommendation, for example, 1.0 = mean usual intake met the recommendation, 0.6 = mean usual intake met 60 % of the recommendation.
¶ Based on salt from foods only (not including discretionary salt reported), likewise iodine intake is from foods only and does not include iodine from discretionary sources of iodised table salt.
§ The score is based on usual intakes from foods only (not including dietary supplements). The individual dietary components were not normally distributed; however, similar results were found when performing non-parametric tests (data not shown).
Overall, in the sample, the mean ± sd DQI score was high for the total score (28·9 (sd 1·5) out of 34·0), and for the section scores ‘macronutrient recommendations’ (9·1 (sd 0·7) out of 10·0) and ‘micronutrient average requirements’ (16·7 (sd 0·9) out of 18·0), but relatively low for the section ‘food-based dietary guidelines’ (3·1 (sd 0·9) out of 6·0). Vegans had a small, but significantly higher total DQI score v. omnivores (29·3 (sd 1·4) v. 28·5 (sd 1·5); post hoc, p = 0·02).
There were significant differences in section scores of the DQI between the dietary groups. Vegans had significantly higher scores, compared to all other dietary groups, for the sections ‘food-based dietary guidelines’ and ‘macronutrient recommendations’, but lower for ‘micronutrient average requirements’, see Table 3. Lacto-ovo-vegetarians had significantly higher DQI scores, compared to omnivores, for the sections ‘food-based dietary guidelines’ and ‘macronutrient recommendations’, but lower for ‘micronutrient average requirements’. Pescatarians had a significantly higher DQI score, compared to omnivores, for the section ‘food-based dietary guidelines’.
Food literacy competencies associated with the Diet Quality Index score
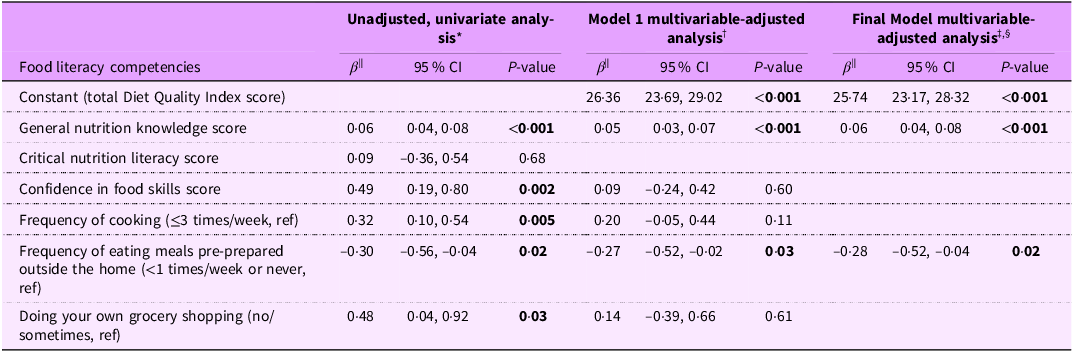
Results from the regression analyses investigating associations between food literacy competencies and total DQI score are presented in Table 4.
Food literacy competencies associated with diet quality in youth (n 235)

Table 4. Long description
The table presents results from regression analyses investigating associations between food literacy competencies and total DQI score. It has 10 rows and 9 columns. The columns are labeled as follows: Food literacy competencies, Unadjusted, univariate analysis with sub-columns β, 95 percent CI, and P-value; Model 1 multivariable-adjusted analysis with sub-columns β, 95 percent CI, and P-value; Final Model multivariable-adjusted analysis with sub-columns β, 95 percent CI, and P-value. The rows list different food literacy competencies: Constant (total Diet Quality Index score), General nutrition knowledge score, Critical nutrition literacy score, Confidence in food skills score, Frequency of cooking (≤3 times/week, ref), Frequency of eating meals pre-prepared outside the home (<1 times/week or never, ref), and Doing your own grocery shopping (no/sometimes, ref). Each row provides the corresponding β values, 95 percent confidence intervals, and P-values for each analysis model.
* Unadjusted linear regression analysis for each of the independent variables (food literacy competency) with total Diet Quality Index score (dependent variable).
† Model 1, adjusted for sex, age, BMI and parental education.
‡ Final multivariable model, including the significant independent variables (food literacy competency), and adjusted for sex, age, BMI, parental education level and dietary practice.
§ R 2 = 0.196.
‖ Unstandardised β coefficients. 95 % CI for unstandardised β coefficients.
The final multivariable-adjusted model which included the food literacy competencies, GNK score and frequency of eating meals pre-prepared outside the home explained 19·6 % of the variance in total DQI score (R 2 = 0·196). A one-unit increase in GNK score was associated with an increase of 0·06 points in the total DQI score (β = 0·06, (95 % CI 0·04, 0·08), p < 0·001). A one-unit increase in the variable ‘eating meals pre-prepared outside the home’ was associated with a decrease of 0·28 points in the total DQI score (β = –0·28, (95 % CI –0·52, –0·04), p = 0·02).
Discussion
To the best of our knowledge, this is the first Swedish study to assess food literacy competencies and diet quality among youth adhering to vegan, lacto-ovo-vegetarian, pescatarian or omnivorous diets.
In this study, all dietary groups demonstrated a moderate level of GNK. This finding aligns with a similar study among Norwegian youth, which reported a moderate level of GNK among young vegans, lacto-ovo-vegetarians, pescatarians, flexitarians and omnivores, measured using the GNKQ-R tool, but adapted to a Norwegian context(Reference Groufh-Jacobsen, Larsson and Van Daele6). Furthermore, previous studies in EU countries and in Canada have found low-to-moderate nutrition knowledge among adolescents, using other measurement tools(Reference Sichert-Hellert, Beghin and De Henauw32,Reference Brown, Seabrook and Stranges33) . Having sufficient knowledge about food and nutrition is considered fundamental in making informed, healthy food choices and can support individuals to understand how to compose well-balanced meals and the role of nutrition for promoting long-term health and well-being. In the present study, we found that higher GNK scores were significantly associated with higher total DQI scores. This aligns with previous research in adolescent and youth populations which show a positive association between higher nutrition knowledge scores and higher diet quality scores (or some healthier food habits)(Reference Groufh-Jacobsen, Larsson and Van Daele6,Reference O’Leary, Mooney and McCloat12,Reference Vaitkeviciute, Ball and Harris13) . Although a positive association exists, in the present study, a one-point increase in GNK score was associated with a relatively small increase (β = 0·06) in total DQI score (max 34 points). Nevertheless, even a small increase in total DQI score reflects an overall higher adherence to dietary recommendations by NNR2023. Food choices are influenced by several factors beyond one’s level of nutrition knowledge, including affordability, availability, food preferences, convenience, habits, social norms, food marketing and the intake of parents and peers(Reference Neufeld, Andrade and Ballonoff Suleiman34,Reference Calvén, Jonsson and Wendin35) . Thus, improving dietary intakes among youth requires multi-sectoral strategies at individual, community and policy levels(Reference Neufeld, Andrade and Ballonoff Suleiman34,36) , whereof more food-related education, which can help to increase GNK, may be one strategy.
Having the ability to critically appraise nutrition information and its sources is important to navigate the food environment and may reduce the risk of making food decisions based on misinformation. In this study, vegans had a small, but significantly higher CNL score than pescatarians (3·9 v. 3·7). Differing from our findings, a Norwegian study, using the same tool, reported that vegans had a significantly higher CNL score (4·1) than lacto-ovo-vegetarians, pescatarians, flexitarians and omnivores (3·6, for all)(Reference Groufh-Jacobsen, Larsson and Van Daele6). This suggests that vegans may have a higher CNL. Although, in the present study, more vegans (80·0 %) were aged 21–24 years compared to pescatarians (58·2 %). Age, a factor linked to education level and critical thinking skills, may partly explain the response differences in the present study(Reference Ares, De Rosso and Mueller22,Reference Bedoyan, McNamara and Olfert37) .
We found no association between CNL score and total DQI score, which is consistent with previous research among Norwegian youths aged 16–24 years(Reference Groufh-Jacobsen, Larsson and Van Daele6). Contrary to our finding, a study among 18–24-year-olds in the USA reported that CNL was related to diet quality (i.e. higher fruit and vegetable intake and lower intake of added sugar)(Reference Bedoyan, McNamara and Olfert37). However, participants in the US study completed a 13-week nutrition education intervention course, and outcomes were assessed pre- and post-intervention. Therefore, the observed dietary improvements may be due to the development of overall food literacy competencies, including GNK, rather than a sole increase in CNL.
Cooking meals at home is an important competency that encompasses food skills such as planning, selecting, preparing and storing foods. Furthermore, cooking meals from scratch may reduce reliance on pre-prepared foods/meals, which can be high in energy, sodium and saturated fat(Reference Julin and Brugård Konde38,Reference Lachat, Nago and Verstraeten39) , and contribute to more nutrient-dense intakes. A US study among young adults found that more frequent food preparation at home was associated with lower fast-food consumption and higher adherence to recommended intakes of vegetables, fruits, whole grains, fat and calcium(Reference Larson, Perry and Story14). Furthermore, among Australian young adults, cooking meals for oneself (but not cooking frequency) was associated with a higher diet quality(Reference Thorpe, Kestin and Riddell16). In the present study, frequency of cooking meals at home was not associated with total DQI score, consistent with findings among youth in Norway(Reference Groufh-Jacobsen, Larsson and Van Daele6) and young adults in Australia(Reference Thorpe, Kestin and Riddell16). We did not define ‘cooking meals at home’; therefore, ‘cooking’ was open to interpretation. A Swedish survey found that some youth do meal prepping, that is, preparing several meals at once(40). This reduces weekly cooking frequency and, depending on the meal composition, may contribute to an intake better aligned with dietary recommendations compared to if cooking daily. Youths should be supported to develop food-related knowledge and skills that enable them to prepare healthy, well-balanced meals.
In modern-day society, young people are exposed to food/nutrition information from a range of sources (e.g. school, family, peers, media), and not all sources provide accurate information. Most youth in the present study (75·7 %) reported using health organisations as a source to get their information about food/nutrition, and the proportion did not significantly differ across the dietary groups. This percentage is high and may be a result of social desirability in responses, yet a somewhat similar percentage of youth in Norway (64·8 %) reported using health authorities to get their information about food/nutrition(Reference Groufh-Jacobsen, Larsson and Van Daele6). Our finding suggests that youth in Sweden use credible sources such as health organisations to get their information about food/nutrition. This may be an explanation as to why we found a lower percentage of youth in the present study using social media (41·3 %, total sample) to obtain their food/nutrition information compared to previous studies among adolescents and young adults in Sweden, Australia and South Africa (65-95 %)(Reference Calvén, Jonsson and Wendin35,Reference Kreft, Smith and Hopwood41,Reference Lam, Szymlek-Gay and Larsson42) . Nevertheless, youth in the present study demonstrated the lowest knowledge in the ‘Dietary recommendations’ section of the GNKQ-R, answering fewer items correctly compared to ‘Section 2: Food groups’ and ‘Section 3: Healthy food choices’. This indicates a potential gap between the information sources they report using and their actual knowledge of, for example, food-based dietary guidelines.
The total DQI score was high across dietary groups in this study, which is explained by the overall high adherence to the ‘macronutrient recommendations’ and ‘micronutrient average requirements’ by NNR2023. However, regardless of dietary practice, youth had intakes of ‘vegetables, fruits, and berries’, whole grains and nuts/seeds which reached only 40–60 % of the recommended daily intakes by NNR2023. This indicates an overall suboptimal compliance with the food-based dietary guidelines. Similarly, a Norwegian study found that youth had suboptimal diet quality, regardless of plant-based or omnivorous diet, with intakes not complying with Norwegian dietary guidelines(Reference Groufh-Jacobsen, Larsson and Van Daele6). Furthermore, in the present study, vegans and lacto-ovo-vegetarians had lower DQI scores for the section ‘micronutrient average requirements’ than pescatarians and omnivores, indicating greater challenges in meeting some of the average requirements from foods only (including fortified foods). Although, across dietary groups, intakes of vitamin D and selenium met approximately 40–80 % of the average requirement, indicating that all dietary groups face challenges in meeting recommended intakes for these nutrients(Reference Mulkerrins, Medin and Groufh-Jacobsen18). Health organisations, including the Swedish Food Agency, state that well-planned vegan and lacto-ovo-vegetarian diets should include sufficient amounts of fortified foods and may also require supplementation to meet nutritional recommendations(43,Reference Raj, Guest and Landry44) . Composing well-planned, nutritionally adequate diets necessitates a sufficient level of food literacy. For youth living in their parental residency, it is also important that their parents are sufficiently food literate.
In the present study, a higher GNK score and a lower frequency of eating meals pre-prepared outside the home were significantly associated with a higher total DQI score. However, overall, food literacy competencies explained only a portion of the variance in total DQI score. Logically, other factors which were not measured in the present study influence youths’ intake and adherence to food-based dietary guidelines and nutrient recommendations. Education about food and nutrition has low priority in the compulsory school curriculum globally, with the course content and school subject varying across countries(Reference Smith, Wells and Hawkes45). In Sweden, 7–16-year-olds receive a total of 130 teaching hours within the school subject ‘Home and consumer studies’(46). Given our findings on diet quality and that young people demonstrate low-to-moderate level of GNK(Reference Groufh-Jacobsen, Larsson and Van Daele6,Reference O’Leary, Mooney and McCloat12,Reference Sichert-Hellert, Beghin and De Henauw32,Reference Brown, Seabrook and Stranges33) , youth may require support, such as more food-related education, to strengthen their food literacy competencies.
Strengths and limitations
A strength of this study is the similar characteristics across dietary groups, and the high completion rate of the 24-h recalls (99 % completed all four recalls). Furthermore, the overall questionnaire was pilot-tested, and validated tools were used to assess GNK(Reference Kliemann, Wardle and Johnson23) and CNL(Reference Guttersrud, Dalane and Pettersen25). However, some adaptions were made to the GNKQ-R (Supplemental Table 1). Overall, the modified GNKQ-R showed acceptable internal reliability, although section 3 had a Cronbach’s α below the acceptable value of 0·70(Reference Field31). In this section, response alternatives were modified to reflect Swedish foods/meals. However, the responses were not formally evaluated, and therefore changes may have lowered the item difficulty and discriminatory ability. Nevertheless, low internal reliability for section 3 have been reported in other country-specific adaptions of the tool(Reference Alsaffar47,Reference Thompson, Vidgen and Gallegos48) . The overall internal reliability of the modified GNKQ-R was acceptable in the present study, suggesting that modifications did not substantially impact the validity of our assessment of GNK.
Due to the cross-sectional study design and self-reported data, causality between food literacy competencies and diet quality cannot be concluded. Additionally, our sampling methods (convenience and snowball sampling) resulted in mostly female participants with a healthy weight, highly educated parents, and living in the city. Nevertheless, it is commonly highly educated females who report adhering to plant-based diets in Western countries; hence, similar studies consist of a comparable participant demographic(Reference Groufh-Jacobsen, Larsson and Van Daele6,Reference Clarys, Deliens and Huybrechts49,Reference Peruvemba, Gieng and Chen50) . However, female sex and higher household education levels are associated with higher diet quality scores(Reference Moraeus, Lindroos and Warensjö Lemming51,52) and greater food/nutrition knowledge(Reference O’Leary, Mooney and McCloat12,Reference Sichert-Hellert, Beghin and De Henauw32,Reference Brown, Seabrook and Stranges33) among young people. Furthermore, in Sweden, 31 % of adults aged 25–64 years are highly educated (≥3 years of further education)(53), whereas 74·4 % of our sample had at least one highly educated parent. Thus, our results may reflect a best-case scenario. Despite this, our findings indicate that youth face some nutritional shortcomings and need to improve their dietary intakes.
Conclusion
Our findings suggest that, regardless of dietary practice, youth may need support to strengthen their food literacy competencies, including GNK, and to consume higher quality diets in terms of higher adherence to the NNR2023 food-based dietary guidelines. Furthermore, youth, regardless of dietary practice, face some nutritional shortcomings impacting their overall diet quality. Youth may benefit from more food-related education to support them develop nutrition knowledge and food skills necessary to prepare healthy, well-balanced meals and consume diets aligned with dietary recommendations.
Supplementary material
For supplementary material accompanying this paper visit https://doi.org/10.1017/S1368980026103735.
Data availability material
The datasets generated and/or analysed during the current study are not publicly available due to ongoing analysis but are available from the corresponding author on reasonable request.
Acknowledgements
The authors thank all participants for their time and effort they dedicated to their involvement in this study.
Author contributions
Conceptualisation: C.L., I.M., A.C.M. and S.G-J.; Methodology: I.M. and C.L.; Formal analysis and investigation: I.M.; Writing – original draft preparation: I.M.; Writing – review and editing: I.M., C.L., A.C.M. and S.G-J.; Funding acquisition: C.L. and A.C.M.; Supervision: C.L. All authors have read and approved the final manuscript.
Financial support
The data for this study are from the Forte-funded research project, VeggiSkills-Sweden, (decision number: STY-2021/005). The funder (Forte – Swedish Research Council for Health, Working Life and Welfare) had no impact on the study design, research questions, collection of data or dissemination of results.
Competing interests
The authors declare that they have no competing interests.
Ethical standards
This study was approved by the Swedish Ethical Review Authority (Dnr: 2022–04188–01) and abided by the guidelines laid down by the Helsinki Declaration for research conducted on humans. All participants provided their own informed consent prior to their participation.
Use of AI
The authors wrote all of the text. Parts of the text were proofread for grammatical issues and improved for clarity using ChatGPT Edu (OpenAI ChatGPT Enterprise) accessed via the University of Gothenburg. The tool did not alter the ideas or information of the manuscript, and meaning of the text remained unchanged. No modifications were made to the tool by the researchers. We declare no competing interests related to its use.



 Open access

