Vitamin A, a key micronutrient, plays a vital role in promoting growth and development, maintaining normal vision, improving bone growth, supporting immune function and other cellular activities(Reference Yee, Chin and Ima-Nirwana1–Reference Brossaud, Pallet and Corcuff4). The presence of vitamin A deficiency (VAD) is an important but preventable risk factor for morbidity and mortality during early childhood(5,Reference Imdad, Mayo-Wilson and Haykal6) . Defined biochemically in terms of serum (or plasma) retinol concentration below 0·7 µmol/l, VAD is a major public health issue worldwide(Reference Zhao, Liu and Zhang7). Nearly 190 million pre-school children in the world are exposed to VAD, with a substantial burden from South Asia and Africa(8). Globally, VAD was responsible for 3·3 million disability adjusted life years and 23 800 deaths among under-five children in 2019(9). India has a high burden of subclinical and clinical VAD in pre-school children(Reference Stevens, Beal and Mbuya10,Reference Kundu, Rai and Shukla11) .
The WHO recommends biannual vitamin A supplementation (VAS) using massive vitamin A oral doses in children aged 6–59 months as an intervention against VAD(12). India launched the National Prophylaxis Programme against Nutritional Blindness in the 1970s, under which administration of vitamin A mega doses was envisaged universally in all children aged 1–5 years(Reference Arlappa13,14) . With some evidence about the effect of VAS in preventing childhood mortality due to common infections (e.g. diarrhoea and measles), the VAS policy was revised in 1991, and infants aged 6–11 months were also included as beneficiaries(Reference Arlappa13). This VAS programme is an ongoing exercise in India, with the first dose generally given at 9 months of age, which coincides with the timing of the measles vaccine(15). The remaining eight doses are administered at half-yearly intervals till the child is 5 years old. However, in recent times, there have been debates about the necessity for continuing universal VAS among under-five children in the country, with some researchers advocating a more targeted and need-based strategy instead of a universal approach(Reference Kapil and Sachdev16–Reference Fawzi and Wang19). There are gaps and heterogeneities in the outreach of the VAS programme across different parts of India(Reference Arlappa13,Reference Bora20,Reference Bora and Bora21) , despite guidelines for universal coverage. Further, there have been attempts to draw connections between the varied coverage of VAS and the distribution of various child health consequences(Reference Imdad, Mayo-Wilson and Haykal6,Reference Rai22,Reference Thomas, Sachdev and Ghosh23) . With this background, our primary objective was to determine the variations and trends in the coverage of childhood VAS across the different states and union territories (UT) of India from 2005–2006 to 2019–2021. Additionally, we tried to examine how VAS coverage was associated with childhood mortality during that period.
Methods
Data sources and definitions
We used data from the multiple rounds of the National Family Health Survey (NFHS), which are conducted under the Demographic and Health Surveys (DHS) Program in India. The anonymised data from these survey rounds are hosted in the public domain (https://dhsprogram.com/Data/). The NFHS is a series of nationwide cross-sectional surveys, conducted across India from time to time using uniform methodology in the various states/UT, encompassing health, nutritional, social and demographic indicators(24–26). Details on the NFHS methodology and data collection tools are described elsewhere(27). Briefly, various standardised methods and survey questionnaires were used in NFHS for collecting population-level information on the indicators of interest. For instance, information on child health and nutrition was gathered from the mother using the woman’s questionnaire.
In the context of the present study, the question ‘Within the last 6 months, was the child given a vitamin A dose?’ in the woman’s questionnaire was relevant for understanding the coverage of childhood VAS. The ‘YES’ response was based on the mother’s recall or documentation on the vaccination card. To facilitate recall, visual cues (such as common vitamin A preparations) were shown to mothers at the time of asking the question. For the present study, we obtained information on VAS coverage and childhood mortality in India from the three rounds of NFHS, namely, NFHS-3, NFHS-4 and NFHS-5, which were conducted during the 2005–2006, 2015–2016 and 2019–2021 reporting periods(24–26). The NFHS-4 and NFHS-5 were carried out in all the existing states and UT of India. The NFHS-3 was limited only to the states and the UT of Delhi. The NFHS-3 reports(24) provided information on VAS in children aged 9–59 months (n 44 809). The NFHS-4 reports(25) provided information on VAS in children aged 9–35 months (n 107 045) as well as 9–59 months (n 204 645). The NFHS-5 reports(26) provided information on VAS in children aged 9–35 months (n 98 226). This information was retrieved at the national level and the state/UT level from NFHS reports and factsheets. The various administrative units in India are listed in online Supplementary Material 1.
The effect of high-dose VAS on improving the vitamin A status of the body (indicated by serum retinol levels) is transient, which lasts for around 1–3 months(Reference Mason, Greiner and Shrimpton17,Reference Palmer, West and Dalmiya28) . The NFHS captured information on childhood mortality through the woman’s questionnaire, which recorded information from participating mothers about the birth and death histories of their children(24–26). Accordingly, a complete history was recorded for each live birth including the survival status and age at the time of the survey or age at death. This information was used in NFHS for computing various estimates of childhood mortality, expressed per 1000 live births. It included neonatal mortality rate (probability of dying in the first month of life), post-neonatal mortality rate (probability of dying after the first month of life but before the first birthday), infant mortality rate (probability of dying before the first birthday) and under-five mortality rate (probability of dying before the fifth birthday)(24,25) . For the present study, we abstracted two mortality estimates, namely, infant mortality rate and under-five mortality rate, at the state/UT levels from NFHS reports. The difference between the two (i.e. infant mortality rate subtracted from under-five mortality rate) indicated the mortality rate in children aged 1–5 years (per 1000 live births), which was used as a dependent variable during our analysis. This mortality estimate reflected the probability of death between the first birthday and the fifth birthday(26).
Sub-national groupings
At a sub-national level, variations in VAS coverage rates were analysed by geographical location, socio-demographic index (SDI) and special developmental groups. Geographically, the states/UT were organised into six regions, namely, East, West, North, South, Northeast and Central India. The states/UT were also categorised into three groups according to the respective SDI values. The SDI is a composite indicator of social and economic development (calculated based on mean education, per capita income and fertility rate in women below the age of 25 years), expressed in the range of 0–1, with higher values reflecting greater levels of development. Indian states/UT were categorised into low SDI (≤ 0·53), middle SDI (0·54–0·60) and high SDI (> 0·60)(Reference Thomas, Sachdev and Ghosh23,24) . Further, the states/UT were classified into three special developmental groups, namely, Empowered Action Group (EAG) states (viz. Bihar, Chhattisgarh, Jharkhand, Madhya Pradesh, Orissa, Rajasthan, Uttar Pradesh and Uttarakhand), northeastern states (viz. Arunachal Pradesh, Assam, Manipur, Meghalaya, Mizoram, Nagaland, Sikkim and Tripura) and ‘other’ states/UT(24–26). The EAG and northeastern states are known to lag in infrastructural and health indicators and usually require special packages and support from the government, as compared with the ‘other’ states/UT. These various sub-national groupings along with their respective member states/UT are enumerated in online Supplemental Material 1.
Data analysis
The coverage of VAS in India was defined as the percentage of surveyed children who had received a dose of vitamin A during the preceding 6 months of the concerned NFHS survey round. The VAS coverage values were derived among children aged 9–59 months during NFHS-3, among children aged 9–35 months and 9–59 months during NFHS-4 and among children aged 9–35 months during NFHS-5. The point estimates were supplemented with interval estimates by calculating the 95 % CI. For documenting changes in the coverage between a certain survey round and the previous survey round, we calculated the coverage difference and coverage ratio. Besides, the VAS coverage was examined at the level of individual states/UT by plotting choropleth maps. Heterogeneities in VAS coverage were depicted across the aforementioned sub-national groupings using boxplots.
Besides, the association between VAS coverage values (treated as the primary independent variable) in the various states/UT and the corresponding mortality rates in children aged 1–5 years (treated as a dependent variable) was investigated through correlation analysis and simple linear regression. The data points are presented in online Supplementary Material 2. Since the VAS coverage data during NFHS-5 was available only for children aged 9–35 months, therefore the association analysis was limited only for NFHS-3 and NFHS-4. To account for the role of potential confounders (such as socio-economic factors, sanitation and immunisation), we considered additional parameters as covariates for our analysis, namely, head count ratio (HCR) and immunisation coverage rates of important childhood vaccines (viz. Bacillus Calmette–Guérin vaccine, three doses of diphtheria-pertussis-tetanus (DPT1, DPT2, DPT3) vaccine and measles-containing vaccine). The HCR is a socio-economic and developmental construct that intends to measure multidimensional poverty, that is, the extent of deprivation in a population beyond monetary terms. It is a composite metric that represents the proportion of population who are ‘poor’ across three equally weighted dimensions, namely, standard of living (includes seven indicators; viz. sanitation, drinking water, cooking fuel, electricity, assets, housing and bank account), health (includes two indicators; viz. maternal health and child-adolescent mortality) and education (includes two indicators; viz. years of schooling and school attendance). The HCR values for states/UT in India were available for the 2005–2006 (NFHS-3) and 2015–2016 (NFHS-4) reporting periods from NITI Aayog reports(29,30) . The estimates of childhood immunisation coverage during these reporting periods across the states/UT in India, based on NFHS data, were available from Nayar et al. (2022)(Reference Nayar, Pattath and Mantha31). Multivariate regression models incorporating these covariates were constructed to examine whether they influenced the attributions of childhood mortality to VAS coverage.
All the statistical analyses were performed using MS Office Excel (Microsoft Office Professional Plus 2019, Microsoft Corporation) and JASP 0.18.2 (JASP, University of Amsterdam).
Results
Patterns and trends in the coverage of vitamin A supplementation
The VAS coverage in children belonging to the 9–59 months age group in India during 2005–2006 (NFHS-3) was 18·6 % (95 % CI 18·2, 18·9), which markedly increased to 60·5 % (95 % CI 60·3, 60·7) during 2015–2016 (NFHS-4). This amounted to a coverage difference value of 41·9 % and a coverage ratio of 3·3. Among children aged 9–35 months, the national coverage of VAS in 2015–2016 (NFHS-4) was 64·5 % (95 % CI 64·2, 64·8) that subsequently increased to 71·2 % (95 % CI 70·9, 71·5) during 2019–2021 (NFHS-5), corresponding to a coverage difference value of 6·7 % and coverage ratio of 1·1 (Table 1).
Coverage of vitamin A supplementation among children in India, as estimated during the different rounds of the National Family Health Survey

VAS, vitamin A supplementation; NFHS, National Family Health Survey.
* Coverage difference was calculated as the absolute difference in VAS coverage between the given survey round and the preceding survey round.
† Coverage ratio was calculated as the ratio of VAS coverage during a given survey round to that during the previous survey round.
When examined by individual state/UT, we observed widespread variations in VAS coverage across the country during all three NFHS rounds (Fig. 1(a)–(d)). While the VAS coverage values among children aged 9–59 months ranged from 5·6 % (in Uttar Pradesh) to 40·2 % (in Mizoram) during 2005–2006 (NFHS-3) (Fig. 1(a)), the values ranged from 29·5 % (in Nagaland) to 89·5 % (in Goa) during 2015–2016 (NFHS-4) (Fig. 1(b)). On the other hand, among children aged 9–35 months, VAS coverage in 2015–2016 (NFHS-4) ranged from 30·6 % (in Nagaland) to 91·8 % (in Goa) (Fig. 1(c)). The coverage of VAS during that survey was higher in the age group of 9–35 months than that in the broader age group of 9–59 months – a pattern which was observed in every state/UT (Fig. 1(b)–(c)). More recently, during 2019–2021 (NFHS-5), VAS coverage among 9–35 years old children ranged from 44·8 % (in Lakshadweep) to 91·9 % (in Goa) (Fig. 1(d)).
Coverage of vitamin A supplementation (VAS) in Indian children, shown by states/union territories, during different rounds of the National Family Health Survey (NFHS): (a) children aged 9–59 months during NFHS-3 (2005–2006); (b) children aged 9–59 months during NFHS-4 (2015–2016); (c) children aged 9–35 months during NFHS-4 (2015–2016); and (d) children aged 9–35 months during NFHS-5 (2019–2021).
Note: Values within parentheses against the state name indicates the corresponding VAS coverage value, expressed in percentage. The state of Andhra Pradesh was bifurcated into the states of ‘Andhra Pradesh’ and ‘Telangana’ in June 2014. The state of Jammu & Kashmir was reorganized and bifurcated into the two union territories of ‘Jammu & Kashmir’ and ‘Ladakh’ in August 2019.

The VAS coverage values were found to be heterogeneous across the various sub-national groupings (Fig. 2(a)–(c)). Geographically, the highest coverage was evident in western India, whereas northeast India had the lowest coverage (Fig. 2(a)). This was reflected in the analysis across special developmental groups as well, wherein the northeastern states achieved comparatively lower coverage than the EAG states and ‘other’ states/UT (Fig. 2(c)). In both these sub-national classifications, the northeastern states also exhibited the highest coverage variability. However, the median VAS coverage values were somewhat comparable among the SDI-based subgroups (Fig. 2(b)).
Boxplots illustrating sub-national heterogeneities in vitamin A supplementation (VAS) coverage across India during the 2019–2021 reporting period, according to (a) geographical region, (b) socio-demographic index (SDI) and (c) developmental category.

Relationship of vitamin A supplementation coverage with childhood mortality
The mortality rates in children aged 1–5 years in the various states/UT across India were inversely associated with the corresponding VAS coverage values (r = −0·40, P < 0·05 in 2005–2006 and r = −0·47, P < 0·01 in 2015–2016). The R 2 values of regression for these mortality rates on VAS coverage during 2005–2006 and 2015–2016 were 16·0 and 22·4 %, respectively. However, this inverse relationship was less prominent during the latter survey round in 2015–2016 (β = –0·40, 95 % CI = −0·67, −0·03) in comparison with the former round during 2005–2006 (β = −0·47, 95 % CI = −0·19, −0·04). This was also evident in the regression plots for the two survey years (Fig. 3), wherein the slope of the regression line for 2015–2016 was visibly less steep than the one for 2005–2006.
Scatter plot showing the association between vitamin A supplementation (VAS) coverage and child mortality rates across the states and union territories of India.

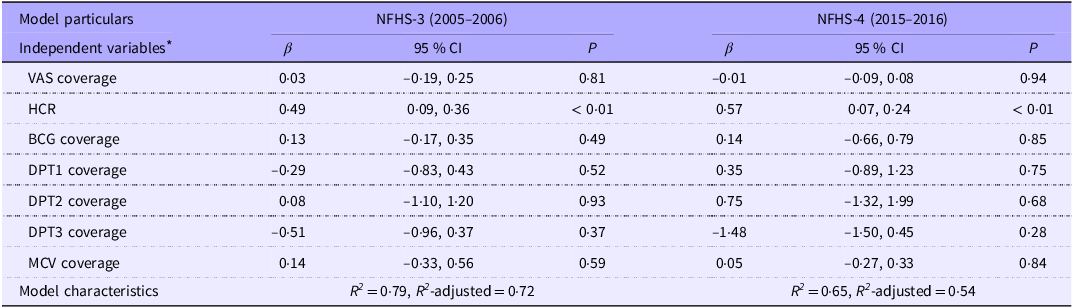
These analyses were verified using multivariate regression to account for potential confounding (Table 2). Unlike in simple regression, we found that VAS coverage was not a statistically significant predictor of childhood mortality (P > 0·05) when adjusted for covariates, either during 2005–2006 (β = 0·03, 95 % CI = −0·19, 0·25) or 2015–2016 (β = −0·01, 95 % CI = −0·09, 0·08). Instead, HCR was found to independently predict mortality in a statistically significant manner (P < 0·01). This association persisted during both the 2005–2006 (β = 0·49, 95 % CI = 0·09, 0·36) and 2015–2016 (β = 0·57, 95 % CI = 0·07, 0·24) survey rounds. Altogether, the regression models explained 72 % of the variance in mortality during 2005–2006 and 54 % of the variance during 2015–2016.
Results of multivariate regression analysis, examining the factors influencing mortality rate in children aged 1–5 years

NFHS, National Family Health Survey; VAS, vitamin A supplementation; HCR, head count ratio; BCG, Bacillus Calmette–Guérin; DPT, diphtheria-pertussis-tetanus; MCV, measles-containing vaccine; β, regression coefficient (standardised); R 2 , coefficient of determination.
* The primary independent variable (predictor) that we considered was VAS coverage, whose effect upon the outcome of interest (mortality rate in children aged 1–5 years) was examined in the regression model. The estimates were adjusted for other covariates, viz. HCR and coverage for various childhood vaccines, namely, BCG, DPT1, DPT2, DPT3 and MCV.
Discussion
Deficiency of vitamin A in children is an important public health problem in South Asia. Historically, India has contributed considerably to the global burden of childhood VAD. Although recent epidemiological findings indicate a decrease in the prevalence of VAD among under-five Indian children(Reference Reddy, Pullakhandam and Ghosh32), the magnitude continues to be sizeable. In this context, the outreach of the universal VAS programme and its implications assume significance. Previous assessment of the VAS programme during the 2015–2016 reporting period had unravelled widespread coverage gaps and inequalities, which conformed to statistically significant spatial patterns. It was found that around 40 % eligible children had not received VAS, despite guidelines for universal coverage(Reference Bora20). In the present study, we found that the outreach of the VAS programme has improved over the years. However, coverage disparities continue to exist among the various states/UT – often along geographical and developmental lines. This is in concordance with other studies, which suggested that the receipt of VAS among children in India is influenced by socio-economic determinants, such as maternal education, household wealth and place of residence(Reference Agrawal and Agrawal33).
We witnessed an encouraging and noteworthy trend in states like Odisha and Chhattisgarh, which, despite being EAG states, had achieved impressive improvements in outreach, with recent VAS coverage rates above 80 %. Experiences in some EAG states like Odisha and Bihar are a testimony to the fact that feasibility issues and resource constraints may be surmounted by strong leadership and political commitment, intersectoral coordination, social mobilisation and communication, appropriate training, regular supervision and monitoring and careful microplanning(Reference Rah, Houston and Mohapatra34,Reference Aguayo, Bhattacharjee and Bhawani35) . In contrast, coverage in northeast India was found to lag relatively behind than in the other parts of the country. The northeastern region is home to a considerable proportion of the tribal population who live in rural areas. Limited infrastructure, poorly accessible terrain, logistical difficulties and administrative challenges further hinder the delivery of public health services in the region(Reference Agrawal and Agrawal33). Particularly, in the states of Nagaland and Manipur, we found that VAS was not provided to more than half of the eligible children. Incidentally, the northeastern region also harbours a considerable burden of childhood VAD, as reported on the basis of serum retinol measurements during the Comprehensive National Nutrition Survey(Reference Reddy, Pullakhandam and Ghosh32,Reference Kundu, Rai and Shukla36,37) . With this background, it is desirable that comprehensive investigations are launched to identify and understand the systemic barriers in the region, which have been hampering the implementation of the childhood VAS programme.
The universal VAS programme was launched in India with the goal of preventing VAD and VAD-associated adverse health outcomes in children. It was initiated during the 1970s as a remedy against the high burden of nutritional blindness(14). Subsequently, with the drastic decline in prevalence of VAD-associated blindness, the justification for continuing VAS was redefined in terms of benefits to child survival(Reference Arlappa13,14) . It was suggested that high doses of vitamin A supplements helped in preventing mortality by primarily conferring protection against childhood diarrhoea, measles and respiratory infections(Reference Imdad, Mayo-Wilson and Haykal6,Reference Long, Rosado and DuPont38,Reference Bello, Meremikwu and Ejemot-Nwadiaro39) . The WHO has been recommending universal VAS as a crucial intervention for reducing childhood morbidity and mortality in settings where VAD is an important public health problem(12). But the relevance and usefulness of continuing the practice of universal VAS in the present times is widely questioned(Reference Kapil and Sachdev16–Reference Fawzi and Wang19). There are views that the practice of providing mega doses of vitamin A indiscriminately to all under-five children does not offer any substantive benefits to child survival and rather causes ‘more harm than good’ due to risks of vitamin A toxicity(Reference Mason, Greiner and Shrimpton17). There are calls for realignment or scaling back of the existing universal VAS programmes globally including in India(Reference Kapil and Sachdev16,Reference Fawzi and Wang19) . But there are also counterarguments suggesting that discontinuation of universal VAS would bear detrimental child health outcomes(Reference Arlappa13). Thus, a nuanced and evidence-based consideration of the matter is vital. Cochrane reviews found that VAS was associated with meaningful reductions in child morbidity and mortality(Reference Imdad, Mayo-Wilson and Haykal6,Reference Imdad, Herzer and Mayo-Wilson40) . In India, the DEVTA cluster randomised trial between 1999 and 2004 involving nearly 1 million pre-school children from the state of Uttar Pradesh revealed modest effects of VAS on reducing child mortality. In fact, a meta-analysis of the DEVTA trial along with eight previously conducted randomised trials detected a weighted average reduction in mortality by 11 % (95 % CI 5, 16)(Reference Awasthi, Peto and Read41). However, a meta-analysis of only Indian studies reported no significant reduction in the risk of all-cause mortality in under-five children with VAS(Reference Thomas, Sachdev and Ghosh23). Reports from Africa suggested that VAS was instrumental in averting a considerable number of child deaths during the past decades(42,Reference Baye, Laillou and Seyoum43) . But it was also appreciated that the excess mortality, which may be potentially prevented by VAS, has declined in contemporary times(Reference Baye, Laillou and Seyoum43). Likewise, a pooled analysis of population-based surveys between 1991 and 2013 from developing countries revealed that child deaths attributable to VAD had decreased globally over time and were almost eliminated in regions other than South Asia and sub-Saharan Africa(Reference Stevens, Bennett and Hennocq44). In this context, our analysis indicated subtle relationships between child mortality and VAS. During univariate analysis, child mortality in India appeared to be associated negatively with VAS. The states/UT that had achieved higher VAS coverage values tended to have lower mortality rates in children aged 1–5 years, but the strength of this relationship appeared to have dampened over the years. However, when adjusted for potential confounders (such as childhood immunisation and socio-economic indicators) through multivariate analysis, this apparently inverse relationship between child mortality and VAS disappeared. It points towards a possibility that the supposed benefits of VAS that may be accrued on child survival have diminished and are no longer relevant as they perhaps were in the previous century. The factors like improvements in living standards, environmental sanitation, nutrition and vaccination rates in India (as elsewhere in the world) may have contributed to the declining role of VAS in promoting childhood survival(Reference Sharma Waddington and Masset45–Reference Sharma Waddington and Cairncross47). This was in agreement with the present findings, wherein we found that states/UT with higher HCR values (which is a composite indicator of deprivation in living standards, education and health) were likely to have higher mortality rates in children aged 1–5 years, a relationship that was consistent even after accounting for confounders.
India is a big and populous country with many states/UT that have tremendous heterogeneity in terms of health, geography, economic development, food habits, ethnicity and socio-cultural practices(48–Reference Kumar and Rani50). In fact, remarkable diversities exist even among different districts or blocks within the same state(Reference Bora, Barman and Pala51–Reference Ohlan53). In this regard, it is desirable to have reliable small-area estimates (e.g. district-wise, block-wise, etc.) for VAD and/or its associated outcomes. Such data are largely lacking at present, which has precluded the analysis of the trends and relationship between VAS coverage and child health outcomes at a more granular level (e.g. by districts/blocks). This is a limitation of the present study. Efforts to bring about targeted improvements in VAS coverage may still be relevant and crucial for supporting child health in India in locations where VAD continues to be rampant. Availability of such granular information would facilitate the development of a practicable framework through which a targeted VAS approach and its intended benefits may be realised. It would also help in rationalising the allocation of the country’s resources (which are finite) and ensure that the interventions are not superfluous but focused on areas in need. In our association analysis, we could not assess the scenario during the latest NFHS-5 (2019–2021) since the VAS data available from that period pertained only to children aged 9–35 months. We were also unable to assess the time-lagged impacts of VAS on childhood mortality, since the spacing between the various NFHS rounds was not uniform and due to the limited availability of NFHS-5 data. Further, we were unable to take into account the vitamin A requirements that were met by the consumption of natural food items rich in vitamin A and products commercially fortified with vitamin A (such as oil, milk, etc.), since these aspects were beyond the scope of the NFHS workflow. These were other limitations of our study.
Conclusion
This study provides a nationwide overview of the coverage of childhood VAS in India over the years (2005–2006 to 2019–2021) and its relationship with childhood mortality. We documented an overall increase in the coverage of childhood VAS in the country over the years. However, nearly 40 % of the eligible children in the age group of 9–59 months and 30 % of the eligible children in the age group of 9–35 months were found to miss their VAS dosage in recent times. Besides, there were disparities in coverage when examined by individual states/UT. As a region, northeast India had the poorest VAS coverage. The state/UT-wise mortality rates among children aged 1–5 years across India varied inversely as a function of the VAS coverage values. However, this reciprocal relationship has become less pronounced over the years, indicating a shrinking role of VAS in offering protection against childhood mortality.
Acknowledgements
The authors acknowledge the support and motivation provided by Professor (Dr) Natarajaseenivasan Kalimuthusamy, Ex-Director, ICMR-RMRCNE Dibrugarh.
No financial support.
T. B.: Data curation, formal analysis, investigation, visualisation, writing – original draft. K. B.: Data curation, formal analysis, investigation, methodology, software, supervision, visualisation, writing – original draft, writing – review and editing.
There are no conflicts of interest, financial or otherwise, to disclose.
The various rounds of NFHS are implemented in India through the International Institute for Population Sciences (IIPS) Mumbai under the stewardship of the Ministry of Health and Family Welfare, Government of India. Technical assistance for NFHS is provided by ICF International under the DHS Program with funding from the United States Agency for International Development. The ethical aspects and all procedures were reviewed and approved by the Institutional Review Boards of IIPS Mumbai, ICF International, the US Centers for Disease Control and Prevention and an independent ethics review committee constituted by the Ministry of Health and Family Welfare. The survey rounds were conducted according to the guidelines laid down in the Declaration of Helsinki. The respondents provided signed informed consent to participate in the survey after being informed about the purpose and procedures of the survey. The NFHS datasets are available in the public domain, hosted by the DHS Program website (https://dhsprogram.com/Data/), in an anonymised manner with participant identifiers removed. Therefore, no separate ethical approval was necessary for the present analyses.
Supplementary material
For supplementary material/s referred to in this article, please visit https://doi.org/10.1017/S0007114525104017.