Introduction
Cirques are classic glacial erosion landforms; their typical shapes are characteristically armchair-like, with flat and concave bottoms, steep cliff-like walls on three sides, and openings in the downslope direction that are normally marked by raised thresholds or rock lips (Shi et al., Reference Shi, Zhao and Wang2011). Researchers have found that cirques develop in nivation hollows on mountain slopes. A gentle slope facilitates the accumulation of solid precipitation and wind-blown snow in these hollows, which is beneficial for the development of cirques (Walder and Hallet, Reference Walder and Hallet1986; Shi et al., Reference Shi, Zhao and Wang2011; Paul et al., Reference Paul, Dar and Romshoo2022). Furthermore, cirque formation and development are closely related to climatic and environmental conditions, and the intensity, extent, and historical climate changes associated with paleo-glacial activities can be inferred by studying cirque parameters (Barr and Spagnolo, Reference Barr and Spagnolo2015). Investigating the location and morphology of cirques is helpful for understanding glacier formation, development, and retreat processes, as well as the impact of glaciers on the landscape (Pelto, Reference Pelto1992; Mîndrescu and Evans, Reference Mîndrescu and Evans2014; Barr and Spagnolo, Reference Barr and Spagnolo2015; Pedraza et al., Reference Pedraza, Carrasco, Villa, Soteres, Karampaglidis and Fernández-Lozano2019). The thickness and extent of ancient glaciers can be indicated by the height and size of cirques (Porter, Reference Porter1989; Pelto, Reference Pelto1992; Turnbull and Davies, Reference Turnbull and Davies2006; Barr and Spagnolo, Reference Barr and Spagnolo2015).
The development of cirques is influenced by numerous factors, such as climate, topography, and lithology. Climate is considered the most important factor, and intense glacial activity promoted the widespread development of cirques during the last glaciation (Barr and Spagnolo, Reference Barr and Spagnolo2015). High-elevation areas experience prolonged glacial activity, making it easier for extensive and large cirques to develop (Olyphant, Reference Olyphant1981; Haynes, Reference Haynes1998; Barr and Spagnolo, Reference Barr and Spagnolo2015). Moreover, lithology can influence the efficiency of glacial erosion. Therefore, strong erosion resistance in granite areas results in shallower cirques, whereas weaker erosion resistance in gneiss areas leads to deeper and irregularly shaped cirques (Zhang et al., Reference Zhang, Fu, Yi, Wang, Wang, Capolongo and Zech2020). The aspect can influence the temperature and snow distribution. North-facing slopes in the Northern Hemisphere maintain lower temperatures, because they receive less solar radiation, which is favorable for cirque development (Evans, Reference Evans2006a, Reference Evans2006b, Reference Evans2021).
Owing to their high elevation and the abundant precipitation brought by the Asian monsoon and westerly wind circulation, the Tibetan Plateau and surrounding mountain ranges are among the regions with the most intense glacial activity in the world, second only to the polar areas (Wang et al., Reference Wang, Kassab, Harbor, Caffee, Cui and Zhang2013). During the Quaternary, strong glacial processes left abundant and diverse glacial landforms on the Tibetan Plateau (Shi et al., Reference Shi, Zhao and Wang2011), making it an ideal natural laboratory for studying cirque morphological development. To date, research on cirques on the Tibetan Plateau and its surrounding mountains has focused mainly on the Taniantaweng Range (Li et al., Reference Li, Zhang and Wang2022), the Gangdise Mountains (Zhang et al., Reference Zhang, Fu, Yi, Wang, Wang, Capolongo and Zech2020; Dou et al., Reference Dou, Mou and Zhang2022), the central Tibetan Plateau (Zhang et al., Reference Zhang, Dong, Dou, Dong and Zech2021), the Himalayas (Li et al., Reference Li, Zhao and Evans2023), the Tianshan and Altai Mountains (Li et al., Reference Li, Zhao and Evans2023), Nianbaoyeze Shan (Chen et al., Reference Chen, Wang, Zou, Yao, Lei and Liao2023), the southeastern Tibetan Plateau (Jia et al., Reference Jia, Fu and Qin2024), and the Haizishan Plateau (Meng et al., Reference Meng, Zhang, Yi, Wang and Zhang2025). These studies have compared the characteristics of cirque development in different climatic zones. However, compared with the vastness of the Tibetan Plateau, research remains limited, hindering regional comparative analyses. This issue is even more pronounced at the northeastern edge of the plateau, where the convergence of the East Asian monsoon and westerly winds occurs. To address this gap, this study focuses on the Qilian Mountains, located at the northeastern edge of the Tibetan Plateau, where morphological data from 1132 ice-free cirques in the region are extracted. In conjunction with existing research, this study explores the morphological characteristics of cirques across the northeastern edge of the Tibetan Plateau and compares them with data from cirques in the rest of the Tibetan Plateau and surrounding mountain ranges.
Study area
The Qilian Mountains are located at the northeastern edge of the Tibetan Plateau, ranging from 35.7°N to 39.5°N and 93.5°E to 103.5°E (Fig. 1). The mountain range consists of a series of parallel mountain chains and valleys trending northwest (NW), with the lithology primarily composed of metamorphic and volcanic rock formations from the Precambrian and early Paleozoic eras (Shi et al., Reference Shi, Zhao and Wang2011). The Qilian Mountains are divided into three segments: the eastern section (Wuwei–La Ji Shan), the central section (Jiuquan–Delingha), and the western section (Yingju Shan–Dachaidan), with the boundaries defined by Qinghai Lake and Har Lake. The terrain gradually rises from northeast to southwest, and the highest peak is Mt. Tuanjie, at an elevation of 5826 m above sea level (m asl). According to the Randolph Glacier Inventory (RGI) v. 7.0 (https://nsidc.org/data/nsidc-0770/versions/7, 10 April 2025), the Qilian Mountains have a total of 2684 glaciers, covering an area of 1597.81 km2, with an ice volume of approximately 84.48 km3. The western section of the Qilian Mountains is influenced by westerly wind circulation, whereas the eastern section is affected by both the southeast monsoon and the southwest monsoon crossing the Tibetan Plateau. The central section experiences the combined influence of both monsoonal and westerly winds (Zhang et al., Reference Zhang, Chen, Holmes, Li, Guo, Wang, Li, Lü, Zhao and Qiang2011). The annual average temperature ranges from –12°C to 5°C, and the annual precipitation varies between 41 and 721 mm (data from https://www.worldclim.org/data/worldclim21.html, 9 October 2024; Fick and Hijmans, Reference Fick and Hijmans2017 Fig. 2a and b). Precipitation is concentrated in the summer months, with relatively little precipitation occurring during the winter. Annual precipitation decreases gradually from east to west (Sun et al., Reference Sun, Shen, Leptoukh, Wang, Di and Lu2012).
(a) Distribution of previous studies of cirques on the Tibetan Plateau and Surrounding mountain ranges, along with the location of the present study area. The dashed red line shows the limit of the modern Asian summer monsoon (modified after Chen et al., Reference Chen, Yu, Yang, Ito, Wang, Madsen and Huang2008). (b) distribution Distribution of cirques within the study area. (c) Google Earth satellite image of four typical cirques (38.7422 °N to 38.7706 °N, 95.9372 °E to 95.9986 °E) in the western Qilian Mountains. The blue and green lines indicate the lengths and widths of the cirques.

(a) Modern annual average temperature in the study area. (b) Modern annual precipitation in the study area. Data are from https://www.worldclim.org/data/worldclim21.html, Fick and Hijmans, (Reference Fick and Hijmans2017). (c) Annual average temperature in the study area during the last glacial maximum (LGM). (d) Annual precipitation in the study area during the LGM. Data are from http://www.paleoclim.org/, Karger et al., (Reference Karger, Conrad, Böhner, Kawohl, Kreft, Soria-Auza, Zimmermann, Linder and Kessler2017).

Data and methods
Datasets
The primary datasets used in this study include digital elevation model (DEM), Google Earth high-resolution imagery, modern glacier boundary, climate, and lithological datasets.
The DEM data were sourced from the Geospatial Data Cloud (http://www.gscloud.cn, 5 September 2024) and consist of the ASTER Global Digital Elevation Model (ASTER GDEM), with a spatial resolution of 30 m × 30 m. The data were provided in the UTM projection system (WGS_1984_UTM_Zone_47N). Google Earth satellite imagery data were obtained from Maxar Technologies (https://www.maxar.com, 6 August 2024), with a maximum resolution of 0.15 m. The modern glacier boundary data came from the RGI v. 7.0. Modern climate data were obtained from WorldClim v. 2.1 (Fick and Hijmans, Reference Fick and Hijmans2017; http://worldclim.org/, 9 October 2024), and paleoclimate data were obtained from PaleoClim (Karger et al., Reference Karger, Conrad, Böhner, Kawohl, Kreft, Soria-Auza, Zimmermann, Linder and Kessler2017; http://www.paleoclim.org/, 11/8/2024). The lithological information for the cirques was extracted from the 1:1,000,000-scale geological map of the China Geological Survey (https://geocloud.cgs.gov.cn/, 5 July 2024).
Methods
We employed a combination of automated and manual methods to delineate cirque boundaries. Specifically, we first used AutoCirque to extract cirque boundaries from ASTER DEM (Li and Zhao, Reference Li and Zhao2022), followed by manual verification of these boundaries in Google Earth to ensure accuracy and exclude cirques covered by glaciers (Fig. 3). The cirque data used in this study include: length (L, m), width (W, m), height (H, m), L/W, L/H, W/H, area (A, km2), size (the cubic root of L*W*H, CS, m), circularity (the ratio between the cirque perimeter and the perimeter of a circle of the same area), minimum elevation (E_min, m asl), maximum elevation (E_max, m asl), mean elevation (E_mean, m asl), mean slope (Slope_mean, °), aspect, plan closure (Plan_clos, °), and profile closure (Prof_clos, °). All cirque data were extracted and analyzed in ArcGIS Pro using the Automated Cirque Metric Extraction 2 (ACME2) tool (Li et al., Reference Li, Evans, Spagnolo, Pellitero, Barr and Ely2024). The midpoint of the cirque threshold was determined using the Mainstream Exit method in ACME2, while plan closure data were obtained using the ACME2 Toolbox method, consistent with the manual approach by Evans (Reference Evans2006a, Reference Evans2006b, Reference Evans2021). Given that aspect is a circular variable with an arbitrary starting point, this study characterized cirque aspect using vector mean (VM) and vector strength (VS) (Li et al., Reference Li, Evans, Spagnolo, Pellitero, Barr and Ely2024). To investigate the influence of cirque aspect (θ) on cirque morphological metrics (Y), we conducted a quantitative analysis using Fourier regression (Eq. 1):
 \begin{equation}{\text{Y}} = a\;\cos {{\theta }} + b\;\sin {{\theta }} + {\text{k}}\end{equation}
Comparison of the automatically extracted cirque boundaries and manual revisions for a certain area in the Qilian Mountains.

Here, positive a and b indicate an increase toward the north and east, respectively, and vice versa (Evans and Cox, Reference Evans and Cox2005; Evans, Reference Evans2006b). Additionally, we analyzed the impact of bedrock type on cirque morphological characteristics using Welch’s test (Welch Reference Welch1951). Welch’s test is applied to indicate the statistically different metrics of cirques.
Results
A total of 1132 ice-free cirques were extracted from the study area, with 151 located in the eastern region, 770 in the central region, and 211 in the western region (Fig. 1b; Supplementary Material).
Size of cirques
The average values of the cirque L, W, H, CS, and A in the study area are 1184 m, 914 m, 510 m, 810 m, and 1.17 km2, respectively (Table 1). The skewness of L, W, H, CS, and A was 0.85, 1.07, 0.68, 0.66 and 1.89, respectively (Table 1), which indicated that the distribution of these morphological parameters showed positive skewness. These parameters should be log-transformed into normal distribution before the analysis of Pearson’s correlation.
Descriptive statistics of the metrics of the cirques in the study area.

L, length; W, width; H, height; CS, the cubic root of L*W*H; A, area; Slope_mean, mean slope; Plan_clos, plan closure; Prof_clos, profile closure; E_min, minimum elevation; E_max, maximum elevation; E_mean, mean elevation.
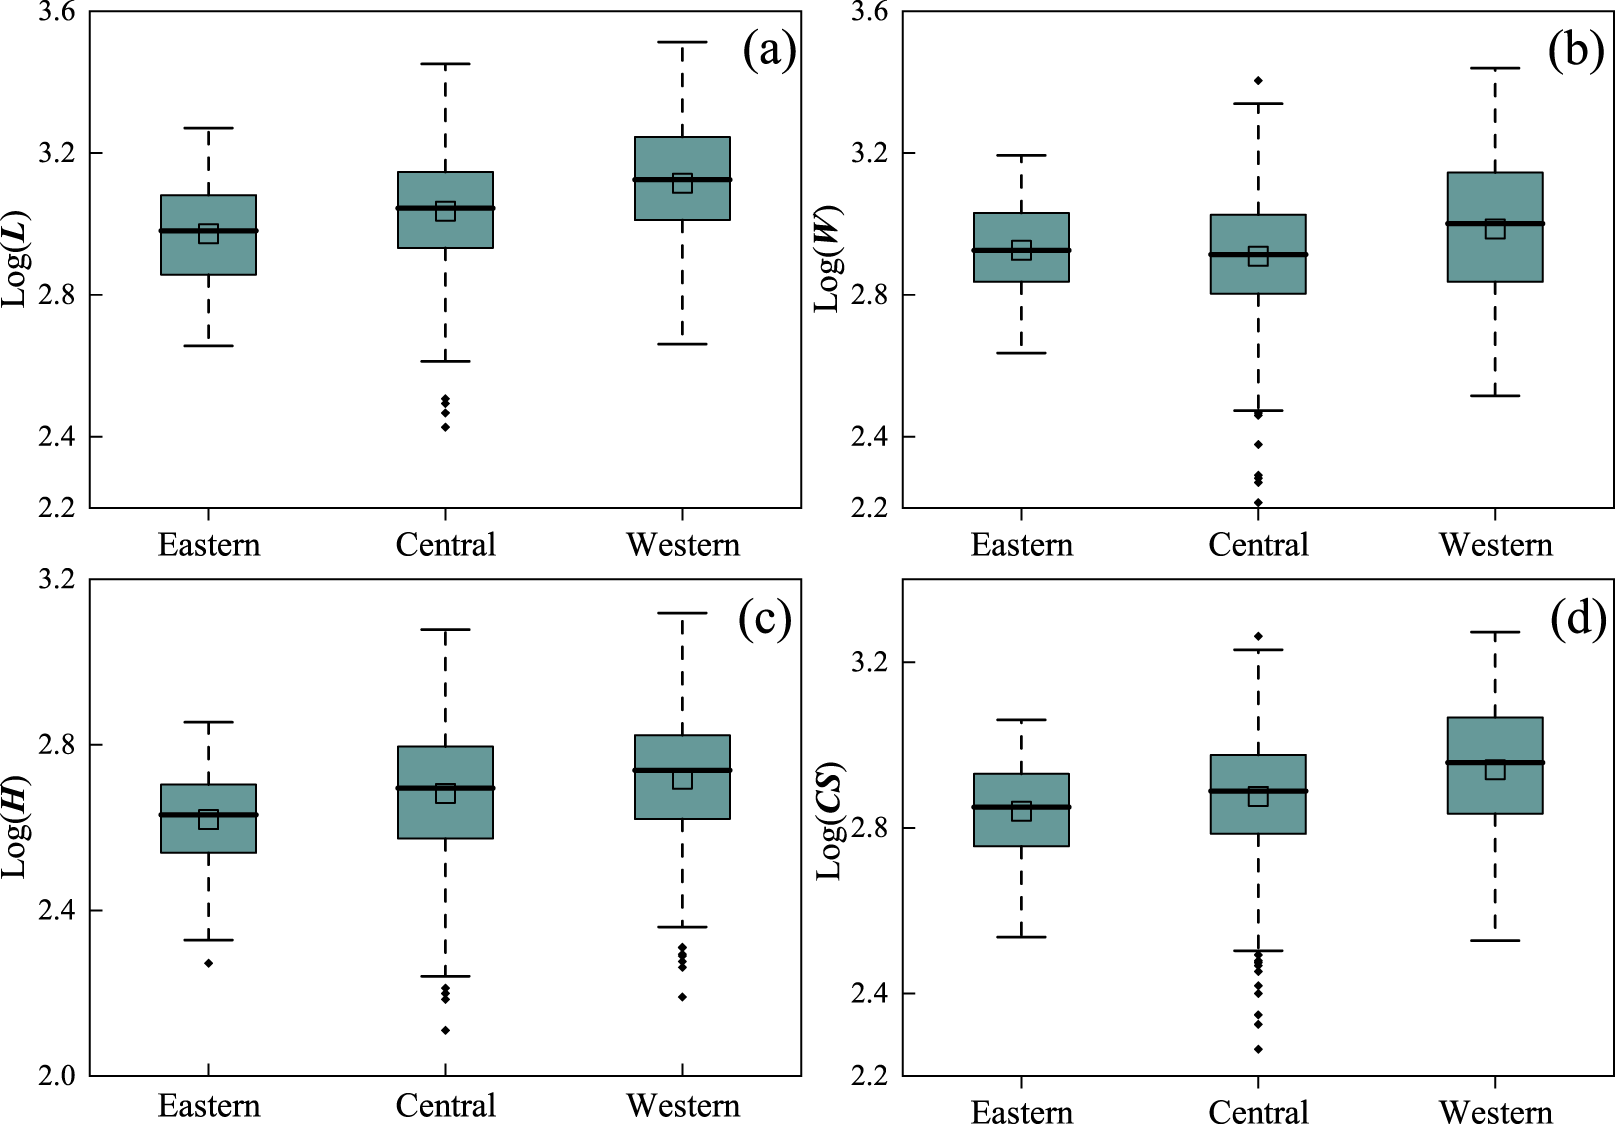
From east to west, the L, H, CS, and A of the cirques show increasing trends. The average W is the greatest in the western region, whereas the eastern region has a slightly greater width than the central region does (Table 1; Fig. 4).There are significant positive correlations between the L and W, H, CS, and A of the cirques (0.71 ≤ r ≤ 0.93, P < 0.01; Table 2). The L, W, H, CS, and A of the cirques all exhibit positive correlations with the annual average temperature (T) (0.04 ≤ r ≤ 0.13, P < 0.01; Table 2) and negative correlations with annual precipitation (P) (−0.31 ≤ r ≤ −0.18, p < 0.01; Table 2).
Box plots of the logarithms of the morphological parameters of cirques in the study area: (a) LL, length;. (b) WW, width; . (c) HH, height; and. (d) CS, the cubic root of L*W*H. The black solid line represents the median; the green box indicates the interquartile range; the small rectangle represents the mean; the small diamonds represent outliers; and the dashed lines represent the maximum and minimum values after removing the outliers. Note that the outliers are identified based on the 1.5 interquartile range (IQR) rule. The IQR is the difference between the first quartile (Q1) (25% of the data in the dataset is are less than or equal to this value) and third quartile (Q3) (75% of the data in the dataset is are less than or equal to this value). The Data data outside the range of Q1 −- 1.5 × IQR and Q3 + 1.5 × IQR are defined as outliers.

Pearson’s r values of the metrics of the cirques in the study area.a

a Correlation coefficients in bold are significant at the 0.01 level. L, length; W, width; H, height; CS, the cubic root of L*W*H; A, area; Slope_mean, mean slope; Plan_clos, plan closure; Prof_clos, profile closure; E_min, minimum elevation; E_max, maximum elevation; E_mean, mean elevation.
Shape of cirques
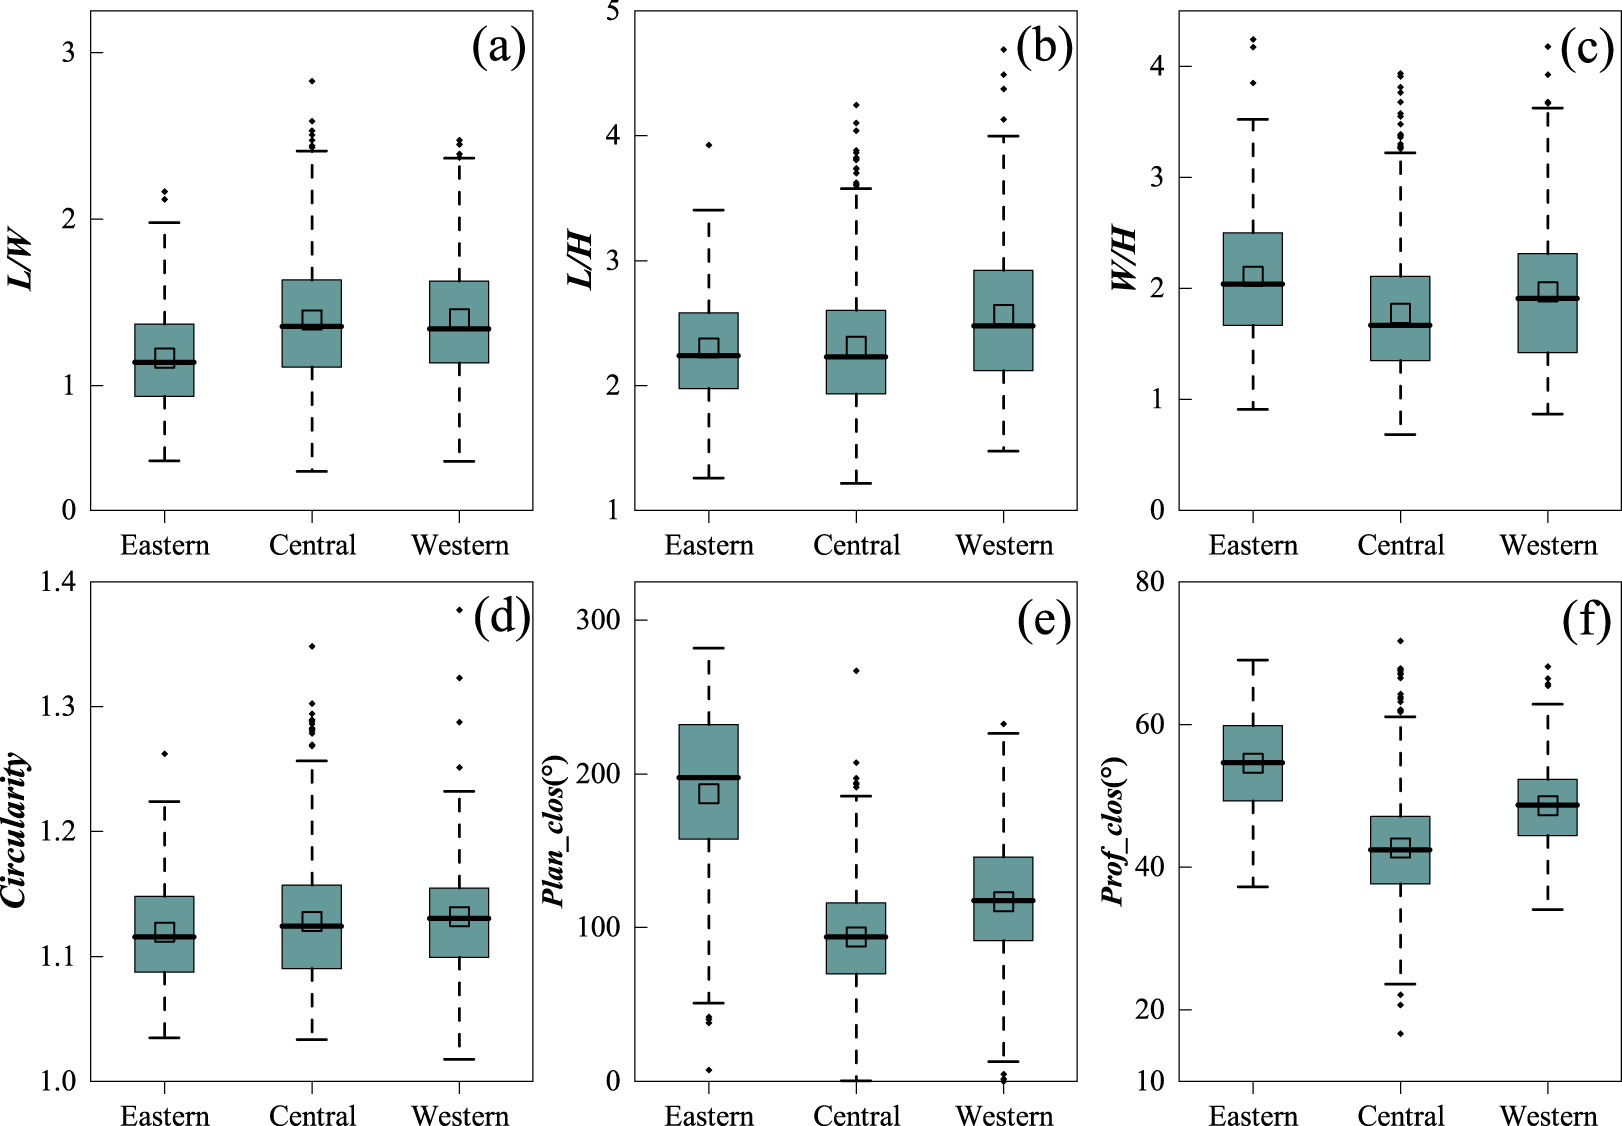
The average L/W ratio of the cirques in the study area is 1.36 (Table 1), and the values increase gradually from east to west (Table 1; Fig. 5a). The eastern cirques have the lowest L/W ratio, at 1.16 (Table 1; Fig. 5a), whereas the L/W ratios of the central and western cirques are 1.39 and 1.40, respectively (Table 1; Fig. 5a). The average L/H ratio of the cirques in the study area is 2.36 (Table 1), with values showing an increasing trend from east to west (Table 1; Fig. 5b). The L/H ratios of the eastern and central cirques are 2.30 and 2.31, respectively (Table 1; Fig. 5b), whereas the western cirques have the highest L/H ratio, reaching 2.57 (Table 1; Fig. 5b). The average W/H ratio of the cirques in the study area is 1.86 (Table 1), with the eastern cirques having the largest W/H ratio (2.11; Table 1; Fig. 5c) and the central cirques having the smallest ratio (1.78; Table 1; Fig. 5c).
Box plots of the logarithms of the morphological parameters of cirques in the study area: (a) LL/WW.; (b) LL/HH.; (c) WW/HH.; and (d) Circularity. L, length; W, width; H, height. (e) Plan_clos, plan closure;. and (f) Prof_clos, profile closure. Please check Figure 4 for the detailed descriptions of this figure.

The average circularity of the cirques in the study area is 1.13 (Table 1), with similar values of circularity across the eastern, central, and western regions (Table 1; Fig. 5d), indicating that the cirques in the study area tend to have a nearly circular planform.
Elevation of cirques
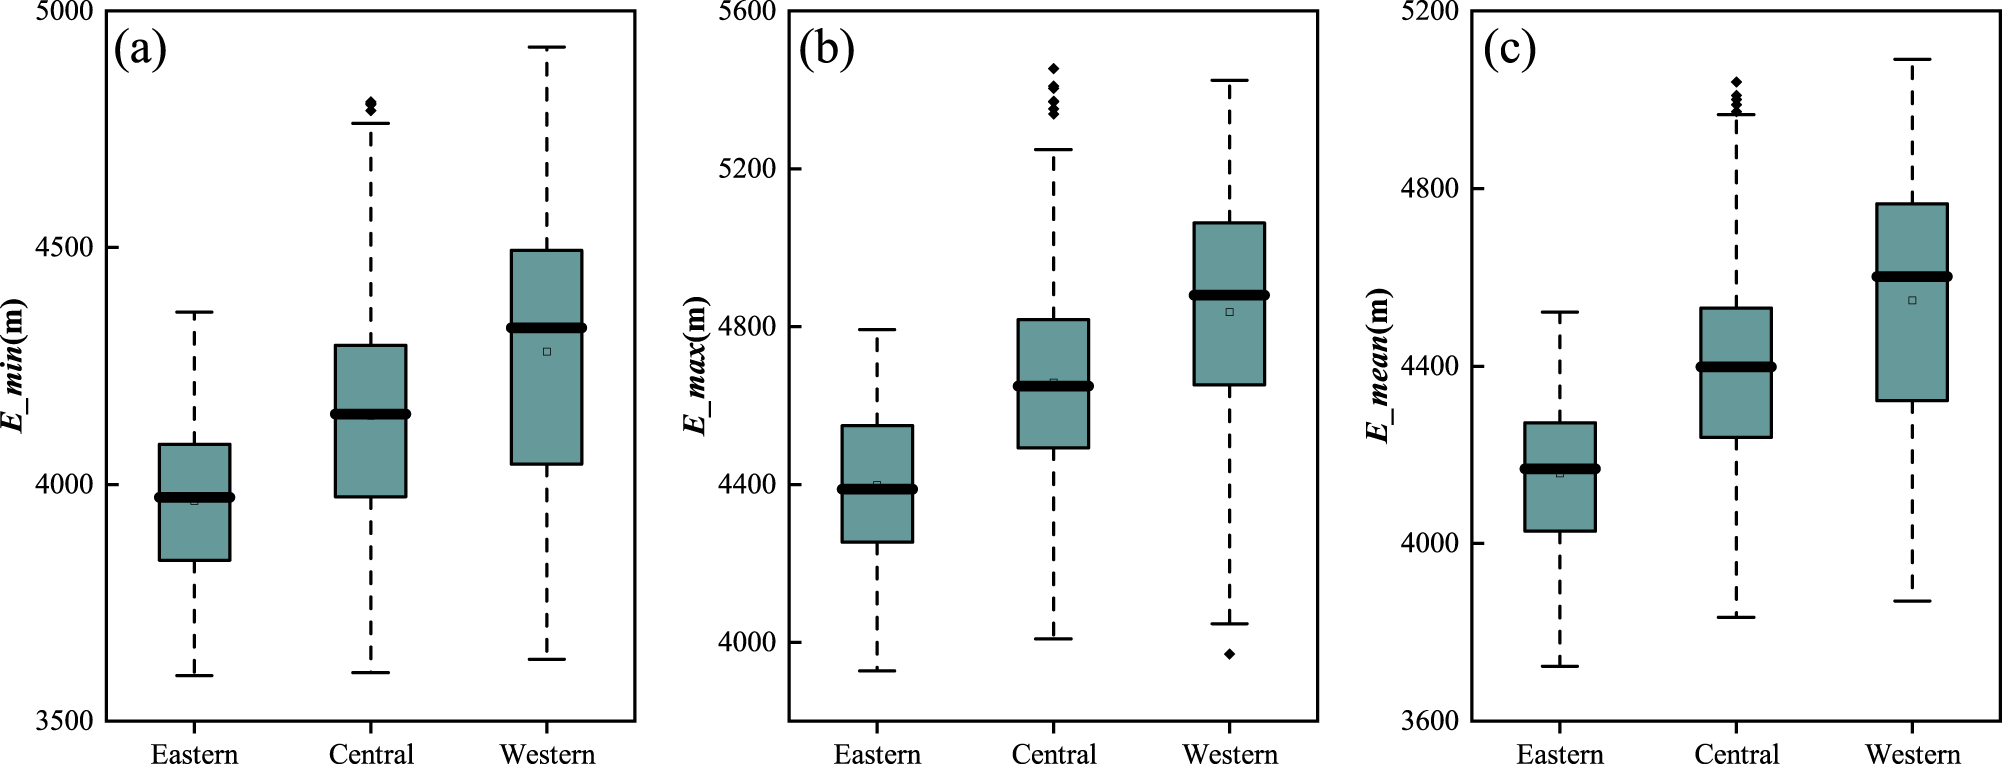
The average values of the cirque floor elevation (E_min), summit elevation (E_max), and mean elevation (E_mean) in the study area are 4146 m asl, 4656 m asl, and 4395 m asl, respectively (Table 1). From east to west, the E_min, E_max, and E_mean of the cirques gradually increase (Table 1; Fig. 6).
Box plots of the elevation parameters of cirques in the study area: (a) E_min, minimum elevation;. (b) E_max, maximum elevation;. and (c) E_mean, mean elevation. Please check Figure 4 for the detailed descriptions of this figure.

In terms of elevation intervals, the largest number of cirques (348) occurs in the 4301–4500 m asl elevation range, whereas the fewest (23) are found in the 3701–3900 m asl range (Fig. 7). Cirques in the 3701–3900 m asl range have the smallest average values for L, W, H, CS, and A, whereas the average Plan_clos is the largest; cirques in the 3901–4100 m asl range have the largest average Prof_clos; cirques in the 4301–4500 m asl range have the greatest W; cirques in the 4501–4700 m asl range have the greatest L and the greatest average CS and A; and cirques in the 4701–4900 m asl range have the greatest H (Fig. 7). The differences in the L/W, L/H, W/H, circularity, and slope mean (Slope_mean) across different elevation intervals are relatively small (Fig. 7).
Bivariate line charts of cirque parameters across different elevation ranges. L, length; W, width; H, height; and CS, the cubic root of L*W*H.

Cirque aspect
In the study area, the most common cirque aspect is northeast (NE), followed by north, whereas southeast (SE) is the least common aspect (Table 3). Cirques with different aspects exhibit significant differences in their morphological characteristics: SE-oriented cirques have the greatest average L, W, H, CS, and A, whereas north-oriented cirques are the shortest. Cirques with a western aspect have the smallest average values for W, H, CS, and A (Table 3). Cirques with an eastern aspect have the greatest average L/W ratio (1.46), whereas North-oriented cirques have the smallest average L/W ratio (1.29) (Table 3). Cirques with a western aspect have the greatest L/H ratio (2.44), whereas those with a southwestern aspect have the smallest L/H ratio (2.24) (Table 3). North-oriented cirques have the greatest W/H ratio (1.95), whereas east-, southwest (SW)-, and SE-oriented cirques have the smallest W/H ratio (1.80) (Table 3). The circularity and mean slope values are similar across all aspects, with small differences (Table 3). Cirques with a western aspect have the greatest Plan_clos value (116.84°), whereas cirques with an south aspect have the smallest value (100.21°). North-oriented cirques have the greatest Prof_clos value (46.59°), whereas east-oriented cirques have the smallest value (43.42°) (Table 3).
Comparison of average dimensions of the cirques with different aspects in the study area.a

a L, length; W, width; H, height; CS, the cubic root of L*W*H; A, area; Slope_mean, mean slope; Plan_clos, plan closure; Prof_clos, profile closure; E_min, minimum elevation; E_max, maximum elevation; E_mean, mean elevation.
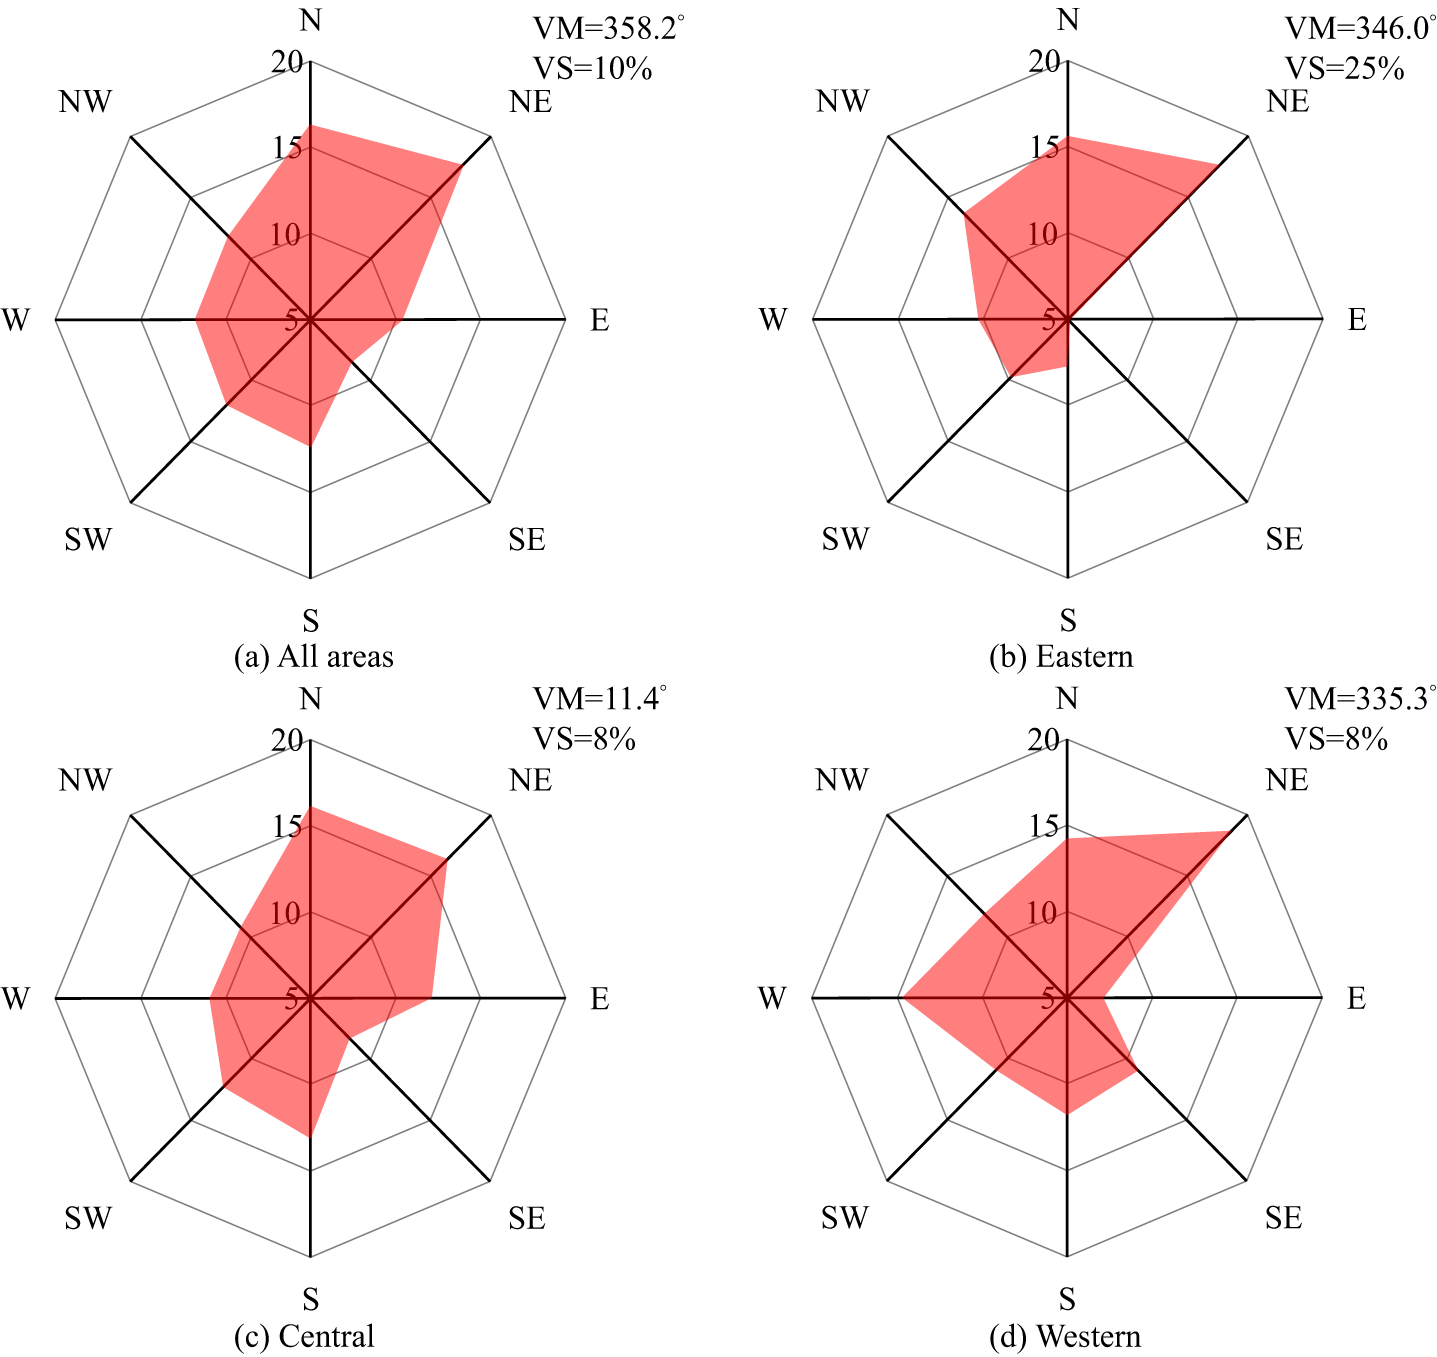
The VM aspect of all cirques in the study area is 358.2°, with a VS of 10%, indicating that most of the cirques are oriented toward the northern side (Fig. 8a). The VM aspect of cirques in the eastern section is 346.0°, with a VS of 25% (Fig. 8b); in the central section, the value is 11.4°, with a VS of 8% (Fig. 8c); and in the western section, the value is 335.3°, with a VS of 8% (Fig. 8d).
Distribution percentages of cirques with different aspects in the study area. Note that VM, vector mean; and VS, are vector mean and vector strength, respectively.

The Fourier regression analysis between cirque aspect and cirque parameters shows that at the 0.05 confidence level, cirque L, H, CS, E_min, and E_max are significantly influenced by cirque aspect (Table 4), with the most pronounced effect observed on elevation parameters (R 2 >11.87%). The negative Cos coefficients and positive Sin coefficients for L, H, and CS indicate that south- and east-facing cirques are longer, taller, and larger than north- and west-facing cirques. For E_min, both Cos and Sin coefficients are negative, suggesting that the E_min on north-facing slopes is lower than on south-facing slopes, and lower on east-facing slopes than on west-facing slopes. For E_max, the Cos coefficient is negative, while the Sin coefficient is positive, indicating that the E_max is higher on south-facing slopes than on north-facing slopes and higher on east-facing slopes than on west-facing slopes.
Fourier regression analysis results of cirque metrics and aspects.a

a L, length; W, width; H, height; CS, the cubic root of L*W*H; Plan_clos, plan closure; E_min, minimum elevation; E_max, maximum elevation; E_mean, mean elevation.
Lithology of cirques
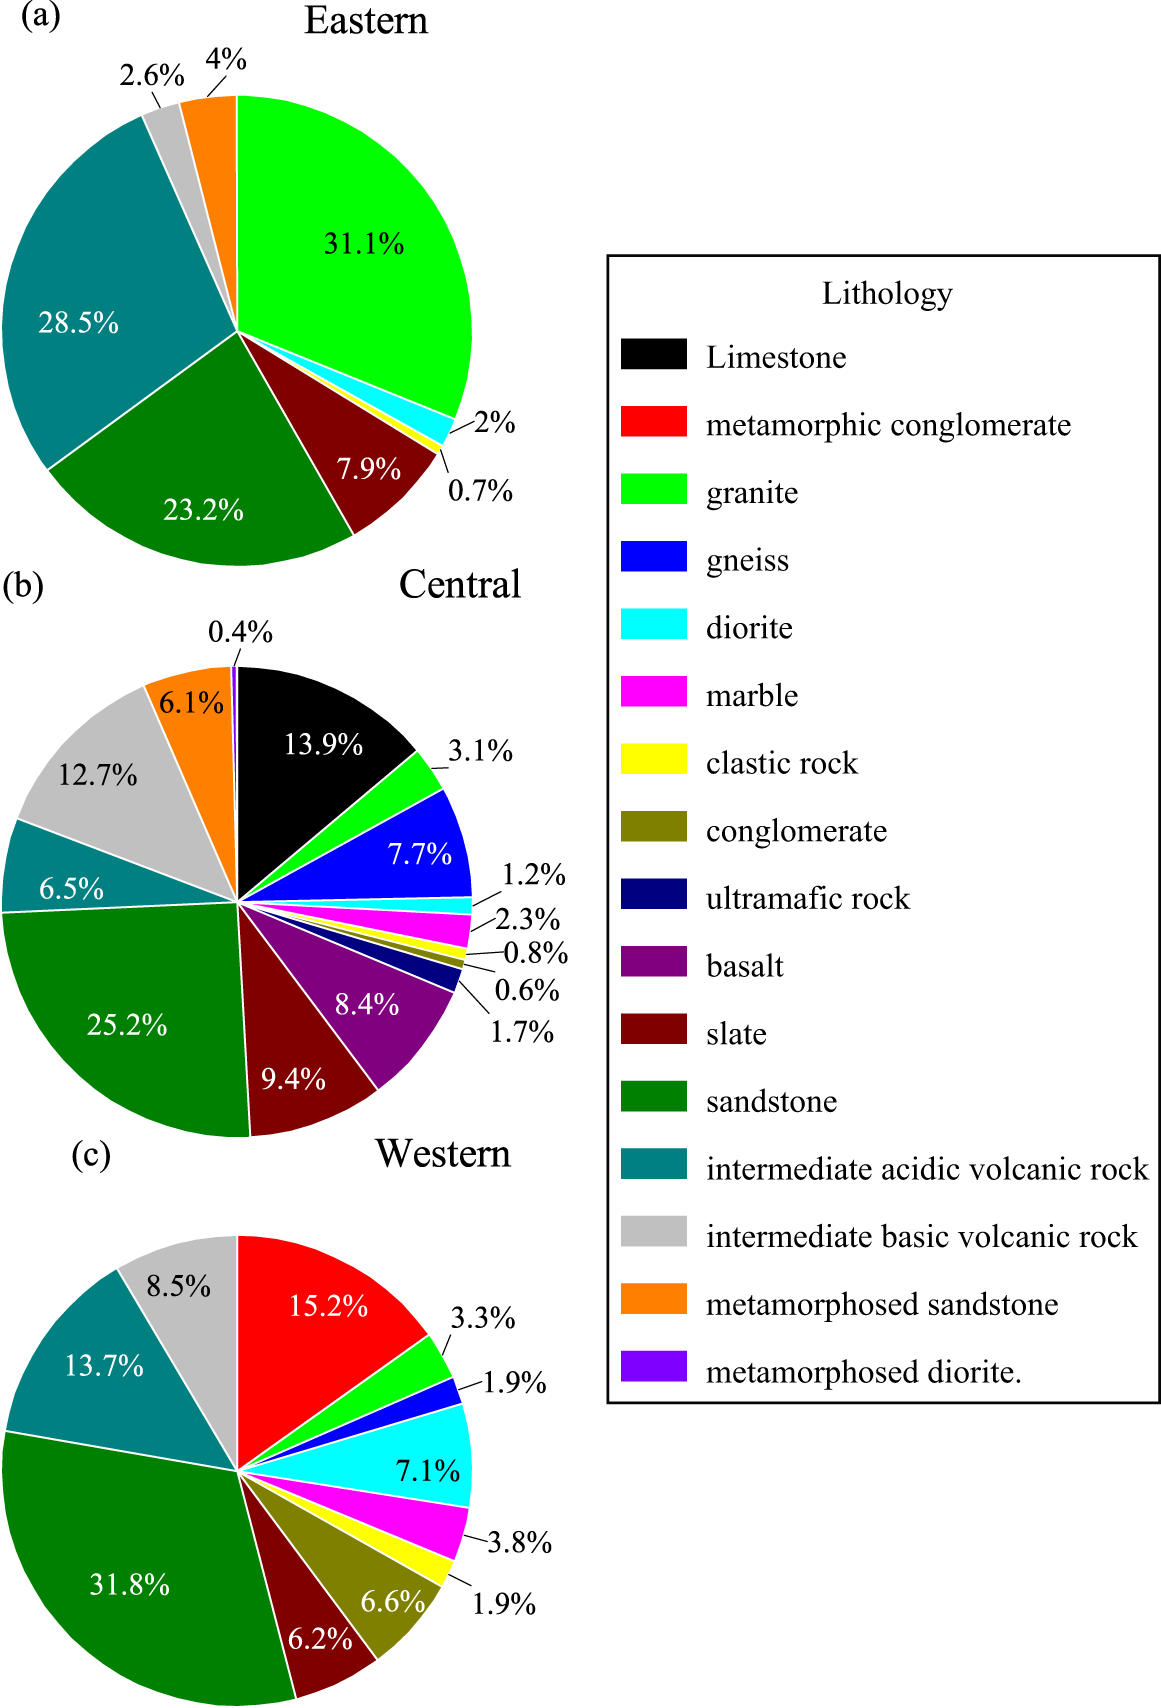
A total of 16 bedrock types, including sandstone, gneiss, intermediate volcanic rocks, and metamorphosed diorite, are identified in the study area (Table 5; Fig. 9). Among these lithologies, cirques located on sandstone have the greatest number, totaling 296, whereas only 3 cirques are identified on metamorphosed diorite (Table 5). Welch’s test conducted between cirque morphological parameters and different bedrock types reveals that, except for L, CS, and A, all other morphological parameters exhibit significant differences (P values less than 0.05) across the different bedrock types (Table 5).
Pie charts of cirque bedrock types: (a) Eastern eastern Qilian Mountains;. (b) Central central Qilian Mountains; and. (c) Wwestern Qilian Mountains.

Comparison of the average dimensions of the cirques on different types of bedrock in the study area.

a By Welch’s test. p-values less than 0.05 and corresponding columns are marked in bold. a L, length; W, width; H, height; CS, the cubic root of L*W*H; A, area; Slope_mean, mean slope; E_min, minimum elevation; E_max, maximum elevation; E_mean, mean elevation.
b By Welch’s test. P values < 0.05 and corresponding columns are marked in bold.
In terms of morphological features, cirques on gneiss have the greatest L (1336 m), whereas those on metamorphosed diorite are the shortest (881 m). Cirques on gneiss are also the widest (1030 m), whereas those on metamorphosed diorite are the narrowest (823 m). Cirques on limestone present the greatest H (627 m), whereas those on metamorphosed diorite present the lowest H (337 m). Compared with those on other bedrock types, cirques on gneiss also have the greatest CS (927.02 m) and area (1.46 km2), whereas those on metamorphosed diorite have the lowest CS (622 m) and area (0.72 km2) (Table 5).
Cirques on limestone present the greatest L/W ratio (1.51), whereas those on metamorphosed diorite present the lowest L/W ratio (1.06). Cirques on metamorphosed diorite also present the greates L/H (2.58) and W/H (2.55) ratios, whereas cirques on marble present the lowest L/H (2.05), and those on limestone present the lowest W/H ratio (1.48) (Table 5). The minimum (E_min), maximum (E_max), and mean (E_mean) elevations of cirques are the greatest on gravel rock, whereas those on metamorphic sandstone present the lowest values for these three parameters (Table 5).
Discussion
Influence of factors on cirque development
The size parameters of cirques are influenced not only by the intensity and duration of glacial erosion but also by the initial nonglacial topographic conditions (Barr et al., Reference Barr, Ely, Spagnolo, Evans and Tomkins2019). The expansion of cirque size occurs primarily during the early and late stages of glaciation, when cirques are typically occupied by small cirque glaciers (Barr et al., Reference Barr, Ely, Spagnolo, Evans and Tomkins2019). Note that this statement is valid for cases where glaciers during parts of a glaciation are too extensive for creating cirques, and not for locations where the glaciers never become larger than cirque glaciers during a glaciation. The vast majority of cirques are located above 3900 m asl in the Qilian Mountains, (Fig. 7; Supplementary Material), and the last glacial maximum (LGM) equilibrium-line altitude (ELA) of the Qilian Mountains was about 3800 m asl (Su et al., Reference Su, Zhao and Zheng2014). The LGM ELA is lower than the altitude of cirques in the Qilian Mountains, which indicates that, during LGM, most paleo-glaciers of the Qilian Mountains advanced beyond the outline of cirques. In the study area, the cirque size parameters generally increase from east to west (Table 1; Fig. 4), which is a trend that reflects the combined influence of multiple factors on cirque development.
First and most importantly, climate is a key driving force in the morphological evolution of cirques (Barr and Spagnolo, Reference Barr and Spagnolo2015). During the early stages of cirque development, cirques typically experience rapid expansion, and their morphological evolution is largely driven by the prevailing climatic conditions at that time (Barr et al., Reference Barr, Ely, Spagnolo, Evans and Tomkins2019). Understanding the impact of climate on the morphological development of cirques requires reconstructing the paleoclimate conditions during their formation period. However, because cirques are influenced by multiple glacial events and reliable dating proxies are difficult to obtain, accurate formation ages are often unavailable. When investigating the impact of paleoclimate on cirque development, it is commonly assumed that the last glaciation played a critical role in cirque formation (Barr and Spagnolo, Reference Barr and Spagnolo2015; Barr et al., Reference Barr, Ely, Spagnolo, Evans and Tomkins2019; Zhang et al., Reference Zhang, Dong, Dou, Dong and Zech2021; Li et al., Reference Li, Zhang and Wang2022). During the last glaciation, glaciers on the Tibetan Plateau were alternately controlled by the Asian monsoon and westerly wind circulation (Murari et al., Reference Murari, Owen, Dortch, Caffee, Dietsch, Fuchs, Haneberg, Sharma and Townsend-Small2014; Zhu et al., Reference Zhu, Lu, Wang, Peng, Kasper, Daut and Haberzettl2015). For example, during Marine Isotope Stage (MIS) 3, the Asian monsoon was stronger, whereas the westerly winds were weaker, resembling modern temperature and precipitation distribution patterns (Murari et al., Reference Murari, Owen, Dortch, Caffee, Dietsch, Fuchs, Haneberg, Sharma and Townsend-Small2014; Fig. 2). In contrast, during MIS 4 and MIS 2, westerly winds dominated, and the Asian monsoon weakened, leading to a colder and drier climate. On the basis of paleoclimate data from PaleoClim, the temperature and precipitation in the study area showed a decreasing trend from east to west during the LGM (Fig. 2c and d; data from PaleoClim; Karger et al., Reference Karger, Conrad, Böhner, Kawohl, Kreft, Soria-Auza, Zimmermann, Linder and Kessler2017). The precipitation in the study area is significantly negatively correlated with the cirque size parameters; although the correlation coefficient is small (Table 2). The quadratic fitting of the precipitation and cirque size parameters also showed a similar trend (Fig. 10). Although ample rainfall provides glaciers with sufficient snowfall and meltwater, enhancing their mobility and erosion capacity, excessive precipitation can cause cirque glaciers to grow into valley glaciers (Zhang et al., Reference Zhang, Fu, Yi, Wang, Wang, Capolongo and Zech2020; Li et al., Reference Li, Zhang and Wang2022), which is unfavorable for further cirque development. Based on the RGI v. 7.0, the percentage of valley glaciers in the eastern region (about 60%) of the Qilian Mountains is higher than that in the western region (about 40%). The eastern region of the study area is influenced by monsoons, which bring abundant precipitation (Fig. 2b). As a result, cirques in the eastern Qilian Mountains have smaller size parameters. In contrast, the western region is controlled by the Chinese regime, and the westerly circulation is influencing the precipitation. Compared with the eastern region, the western region receives less precipitation but is characterized by higher mountain elevations and lower temperatures, which favor snow accumulation. This results in better-developed cirques, with significantly larger size parameters, such as H, W, and CS. On the other hand, temperature has a weaker relationship with cirque morphology, showing a significant positive correlation only with the L, H, and CS parameters but with small correlation coefficients. Thus, although changes in temporal temperature lead directly to glacial advances and retreats (Oerlemans, Reference Oerlemans2001, Reference Oerlemans2005; Anderson and Mackintosh, Reference Anderson and Mackintosh2006), our analysis implies that present spatial temperature may have a more indirect or limited effect on cirque development. This observation aligns with studies of cirques in the central Tibetan Plateau (Zhang et al., Reference Zhang, Dong, Dou, Dong and Zech2021) and further suggests that spatial temperature variations may not be the primary factor driving changes in cirque size.
Quadratic fitting plots of cirque morphological parameters versus temperature (T) and precipitation (P).

Second, the variations in glacial erosion caused by lithological differences also play an important role in shaping the morphology of cirques (Zhang et al., Reference Zhang, Fu, Yi, Wang, Wang, Capolongo and Zech2020). In the eastern region, cirques are located mainly on harder, more erosion-resistant rocks, such as granite and intermediate acidic volcanic rocks (Fig. 9), leading to smaller cirque sizes. In contrast, cirques in the central and western regions are located on more easily erodible sandstone, which results in larger size parameters (L, H, and CS) in these areas.
The aspect of cirques can provide valuable paleoclimatic information, such as solar radiation, the paleowind direction, and cloud cover (Evans, Reference Evans2006a; Barr and Spagnolo, Reference Barr and Spagnolo2015). In the Northern Hemisphere, cirques typically exhibit a distinct NNE aspect, influenced by two main factors. First, under clear-sky conditions, the northern slopes are cooler than the southern slopes. Second, the eastern slopes receive solar radiation in the morning when temperatures are lower, leading to cooler conditions (Khandsuren et al., Reference Khandsuren, Seong, Rhee, Lee, Sarikaya, Oh, Sandag and Yu2023). Both factors limit glacial melting, extending the duration of glacial processes on northern and eastern slopes, which is favorable for glacial formation and cirque development (Evans, Reference Evans2006a).
Previous studies have shown that cirque aspect is influenced by a combination of factors, such as the prevailing wind direction, solar radiation, and mountain aspect (Mîndrescu et al., Reference Mîndrescu, Evans and Cox2010; Zhang et al., Reference Zhang, Dong, Dou, Dong and Zech2021). In the Qilian Mountains, the VM of cirque aspect is 358.2°, indicating a predominantly northern aspect (Fig. 8a). The eastern part of the Qilian Mountains is influenced primarily by monsoons, with prevailing winds from the south. Cirques in this region typically develop on the lee side, resulting in a more northerly aspect (VM 346.0°; Fig. 8b). In the central Qilian Mountains, both monsoon and westerly wind systems influence the area, with a more varied lithology and a higher elevation than those in the eastern section. As elevation increases, the distribution of cirques across different aspects becomes more dispersed (Barr and Spagnolo, Reference Barr and Spagnolo2013). Consequently, compared with the eastern section (VS of 25%; Fig. 8b), the central section has a similar northward aspect (VM of 11.4°; Fig. 8c) but a more dispersed distribution (VS of 8%; Fig. 8c). In the western Qilian Mountains, cirques are oriented toward the northwest and have a more scattered distribution (VM of 335.3°, VS of 8%; Fig. 8d). This phenomenon is likely associated with the NW–SE aspect of the mountain range and its higher elevation. The aspect of the mountains locally influences the development of cirques parallel to the mountain range (Zhang et al., Reference Zhang, Fu, Yi, Wang, Wang, Capolongo and Zech2020, Reference Zhang, Dong, Dou, Dong and Zech2021), and the higher elevation in the western section leads to a more dispersed distribution of cirques.
The size parameters of cirques are positively correlated with E_mean of the cirque floors, with significant correlations observed between E_mean and parameters such as L, H, and CS. Although the correlation coefficients are small, the relationships are statistically significant (Table 2), indicating that as elevation increases, the size of the cirques gradually increases. This trend is consistent with those of previous studies (e.g., the Cantabrian Range [Ruiz-Fernández et al., Reference Ruiz-Fernández, Poblete-Piedrabuena, Serrano-Muela, Martí-Bono and García-Ruiz2009], Kamchatka Peninsula (Barr and Spagnolo, Reference Barr and Spagnolo2013), Iceland (Ipsen et al., Reference Ipsen, Principato, Grube and Lee2018), western Fuegian Andes (Oliva et al., Reference Oliva, Cioccale and Rabassa2020), Gangdise Mountains (Zhang et al., Reference Zhang, Fu, Yi, Wang, Wang, Capolongo and Zech2020), and Central Tibetan Plateau (Zhang et al., Reference Zhang, Dong, Dou, Dong and Zech2021)). This phenomenon likely reflects the developmental advantage of cirques at relatively high altitudes. During glacial periods, glaciers in high-elevation areas have been the first to develop, and during glacial retreat, glaciers in these regions have been the last to melt, leading to a longer period of glacial activity. As a result, cirques in high-altitude areas tend to develop more fully and are relatively large (Olyphant, Reference Olyphant1981; Haynes, Reference Haynes1998; Barr and Spagnolo, Reference Barr and Spagnolo2015). Additionally, the number of cirques on northern slopes (N, NE, and NW directions) is significantly greater than that on southern slopes (S, SE, and SW directions) in the study area. Furthermore, the minimum (E_min), maximum (E_max), and mean (E_mean) elevations of cirques on northern slopes are all lower than those on southern slopes. This phenomenon may be related to the greater amount of solar radiation received by southern slopes. Under similar elevation conditions, southern slopes typically experience higher temperatures than northern slopes do, which is less favorable for glacial formation and maintenance. As a result, glaciers at lower elevations on southern slopes have a later onset, leading to fewer cirques and higher elevation parameters on these slopes.
Erosion processes
The relative importance and regional variability of horizontal and vertical erosion can be revealed through analysis of the relationships of the allometric growth of cirques (Olyphant, Reference Olyphant1981; Evans, Reference Evans2006a; Delmas et al., Reference Delmas, Gunnell and Calvet2014). The characteristics of the morphological development of cirques in the study area exhibit significant regional differences. In the eastern Qilian Mountains, the growth rate of length (the slope of the linear regression trend line between the log10L and log10CS; applicable to L and H equally) significantly exceeds that of the W and H (Fig. 11a), indicating that the development of cirque glaciers in this region is driven primarily by longitudinal erosion along the valley. This is due to higher precipitation, which provides abundant accumulation for cirque glaciers, promoting glacial development and flow. Additionally, higher temperatures cause glaciers to flow primarily along the valley, accelerating the extension of cirque length (Paul et al., Reference Paul, Dar and Romshoo2022). In the central Qilian Mountains, cirque development shows a more uniform growth pattern (Fig. 11b), mainly due to intermediate temperatures and precipitation levels (Fig. 2) and more diverse lithologies (Fig. 8), resulting in relatively balanced longitudinal and lateral erosion by cirque glaciers (Li et al., Reference Li, Zhao and Evans2023). In the western Qilian Mountains, the growth rate of W significantly exceeds those of L and H (Fig. 11c), suggesting that the development of cirques in this region is dominated by lateral erosion, with a more prominent erosional effect on the cirque sidewalls. Compared with the eastern and central regions, the western area receives less precipitation, and lower temperatures limit glacial mobility, restricting the extension of cirque glaciers. Moreover, during cirque development, longitudinal erosion is generally more prominent than vertical erosion (Barr et al., Reference Barr, Ely, Spagnolo, Evans and Tomkins2019). Therefore, cirque development in the western Qilian Mountains is characterized mainly by lateral erosion, with widths increasing at a significantly greater rate than lengths and heights.
Cirque log10LL, log10WW, log10HH, and log10CS scatter scatter-fitting plots:. (a) Eastern eastern Qilian Mountains;. (b) Central central Qilian Mountains; and. (c) Western western Qilian Mountains. Note that the log10LL/ log10CS, log10WW/ log10CS, and log10HH/ log10CS are the growth rates of length (LL), width (WW), and (height) HH, respectively;. CS, the cubic root of L*W*H.

Comparison with cirque studies on the Tibetan Plateau and surrounding mountain ranges
The morphological characteristics of cirques on the Tibetan Plateau and surrounding mountain ranges exhibit significant spatial differentiation patterns (Table 6). The VM of cirque aspect indicates that, except for the Altai Mountains dominated by the westerlies (southern Altai VM = 57°, northern Altai VM = 66°), which show a southeastward aspect, cirques in other regions predominantly face north or northeast. This distribution pattern of cirque aspect across the plateau and surrounding mountains reveals that cirque aspect is primarily controlled by the combined effects of solar radiation and prevailing wind direction: cirques generally develop on leeward slopes (Evans, Reference Evans2006a, Reference Evans2006b). The Altai Mountains, influenced by the westerlies, exhibit a SE-ward cirque aspect, while monsoon-influenced regions (e.g., the central Himalayas and Haizishan Plateau) with prevailing southerly winds promote the development of cirques on north-facing slopes.
Comparison of average cirque metrics on the Tibetan Plateau and surrounding mountain ranges.

a P data are sourced from https://www.worldclim.org//data//worldclim21.html and Fick and Hijmans, (Reference Fick and Hijmans2017). L, length; W, width; H, height; CS, the cubic root of L*W*H; E_min, minimum elevation.
E_min is commonly used as a proxy indicator for past climate conditions, specifically representing the ELA of past glaciers (Barr and Spagnolo, Reference Barr and Spagnolo2015). The E_min data for cirques on the Tibetan Plateau and surrounding mountain ranges generally show a circular “high-internal, low-external” distribution pattern (Table 6), which corresponds to the spatial distribution of the ELAs of modern glaciers in these regions. However, as mentioned earlier, the precise ages of formation of cirques are difficult to obtain, making it challenging to attribute them to specific glacial events. Therefore, it is not feasible to use cirque E_min as a direct indicator of the ELA for a particular glacial period. Furthermore, cirques are influenced not only by climatic factors but also by non-climatic factors, such as topography and lithology (Zhang et al., Reference Zhang, Fu, Yi, Wang, Wang, Capolongo and Zech2020; Dou et al., Reference Dou, Mou and Zhang2022; Li et al., Reference Li, Zhang and Wang2022). Even if two regions share similar climatic and topographic conditions and glaciers have similar scales, the E_min values of their cirques may still differ. Actually, the ELA of a valley glacier is lower than the E_min, while that of a cirque glacier is higher than the E_min (Porter, Reference Porter2001). Thus, caution should be exercised when using cirque E_min as a proxy for past climates at larger regional scales, as there is no inherent or direct link between E_min and climate.
Conclusion
In this study, 1132 ice-free cirques in the northeastern Qilian Mountains of the Tibetan Plateau were mapped, and their morphological parameters were analyzed via the ACME2 toolbox. We explored the spatial distribution patterns and factors influencing cirque development in the study area in light of existing cirque morphology data from the Tibetan Plateau and surrounding mountain ranges. The results reveal the following key findings.
First, controlled by solar radiation and the wind direction, the average cirque aspect in the study area is predominantly northward, with the greatest number of cirques facing northeast (NE).
Second, Compared with cirques in the eastern Qilian Mountains, those in the central and western Qilian Mountains develop predominantly on erodible sandstone, with moderate precipitation, leading to larger cirque sizes. In contrast, cirques in the eastern Qilian Mountains are more often found on erosion-resistant granite, and excessive precipitation inhibits cirque development, resulting in smaller cirque sizes.
Third, In the eastern Qilian Mountains, cirques are shaped mainly by longitudinal erosion, significantly promoting the growth of cirque length. Cirques in the western Qilian Mountains are influenced primarily by lateral erosion, with width increasing faster than length and height. In the central Qilian Mountains, cirque erosion is more balanced both horizontally and vertically.
Finally, comparison with cirque data from the Tibetan Plateau and surrounding mountain ranges reveals that cirque aspects are primarily influenced by solar radiation and prevailing wind directions. The E_min values of cirques in the Tibetan Plateau and surrounding regions exhibit a circular “high-internal, low-external” distribution, corresponding to the spatial distribution of the ELA of modern glaciers. However, because the exact ages of formation of cirques are difficult to determine and E_min is also influenced by topographic and lithological factors, caution is advised when using E_min as a proxy for the past climate at large regional scales.
Supplementary material
The supplementary material for this article can be found at https://doi.org/10.1017/qua.2025.10034.
Acknowledgments
This work was funded by the National Natural Science Foundation of China (grant nos. 42161003, 41801032).
Competing interests
The authors declare that they do not have any commercial or associative interest that represents a conflict of interest in connection with the work submitted.