
I. INTRODUCTION
To enhance the energy and power densities of electrodes for energy storage systems, the formulation and processing of electrode slurries proved to be a critical issue in determining the electrode performance. Carbonaceous materials such as carbon black (CB), nanotubes, and nanofibers are main conductive additives in the electrode slurries.Reference Flandrois and Simon1,Reference Armand and Tarascon2 These materials are characterized by exceptional chemical stability and electrical and mechanical properties derived from their large diversity of structure that extends from the sp 2-hybridization of carbon atoms to the crystalline structure (degree of graphitization). Among various kinds of carbonaceous materials, semispherical (three-dimensional) CB has a unique place in the formulations of electrodes for energy storage systems.Reference Zhang, Uchaker, Candelaria and Cao3,Reference Yao, Pham and Lee4
CB is initially formed from semispherical primary particles of nanometric (few hundred nm) size, which are fused to form aggregates (few μm size scale) in suspensions. The van der Waals attraction forces drive the aggregates to bind into larger loosely agglomerates (10–100 μm).Reference Youssry, Madec, Soudan, Cerbelaud, Guyomard and Lestriez5 The surface area and surface chemistry of CB play a pivotal role in determining the strength of binding forcesReference Amari and Watanabe6 which determines the microstructure and hence the flow behavior of CB suspensions.Reference Genovese7 Above a critical concentration, the so-called percolation threshold, a three-dimensional network is formed across the CB suspension showing abrupt increase of the rheological parameters (viscosity, shear modulus, and yield stress) and electrical conductivity of the suspension.Reference Youssry, Madec, Soudan, Cerbelaud, Guyomard and Lestriez5,Reference Rwei, Ku and Cheng8 This behavior is a consequence of formation of the percolated network composed of branches (paths) of aggregated CB resulting in a 3D network.Reference Youssry, Madec, Soudan, Cerbelaud, Guyomard and Lestriez5 It has been reported that the particle size of CB impacts on their rheological behavior where large particles form a weaker percolated network consisting of less dense agglomerates with numerous branches and hence lower rheological parameters and electrical conductivity.Reference Youssry, Madec, Soudan, Cerbelaud, Guyomard and Lestriez5 Of course, the surface chemistry of CB, dispersion medium, and dissolved salt (type and concentration) might influence the rheological and electrical behaviors of CB suspensions. Nevertheless, no systematic study has been appeared so far, addressing the influence of such parameters on the properties of CB suspensions. Such a study is mandatory since CB is the conductive additive used in commercial energy storage systems such as lithium-ion batteries (at a concentration of approximately 2 wt%).
Commonly, electrode slurries are prepared in organic electrolytes due to the compatibility with the highly hydrophobic solid materials, especially CB. Recently, the organic electrolyte was replaced by an aqueous-based one,Reference Chang, Yang, Li, Wang and Wu9,Reference Luo, Cui, He and Xia10 but the limited cell voltage remained an obstacle toward commercial applications. The advantages of aqueous electrolytes, such as environmentally friendly, highly safe, low viscosity, etc., challenge us to examine the replacement of some amount of water by an organic solvent in the presence of a nonionic surfactant (Triton X100) which is commonly used in the formulation of electrode slurries.Reference Madec, Youssry, Cerbelaud, Soudan, Guyomard and Lestriez11 At specific composition, this novel electrolyte is the microemulsion.
Microemulsions are transparent thermodynamically stable fluids made up, essentially, of surfactants, oil, and water and sometimes cosurfactants (such as medium chain length alcohols).Reference Evans, Mitchell and Ninham12,Reference Shinoda and Lindman13 Their formation is entropy-driven, and thus it is quite different from coarse emulsions.Reference Rosano, Cavallo, Chang and Whittam14 Depending on the concentration, temperature, and salinity (for ionic surfactants), they may be Winsor I (oil-in-water; O/W microemulsion), Winsor II (water-in-oil; W/O microemulsion), or Winsor III (bicontinuous microemulsion).Reference Cazabat, Langevin, Meunier and Pouchelon15 Both Winsor I and II microemulsions contain isolated aggregates (droplets) of a typical size of 10–100 nm, and they are called swollen micelles. On the other hand, Winsor III (bicontinuous) microemulsion has continuous water and oil phases. O/W and bicontinuous microemulsions have nearly similar conductivity to that of homogenous aqueous electrolyte solutions; therefore, they were used for electrochemical studies.Reference Iwunze, Sucheta and Rusling16,Reference Rusling and Bard17
In this study, we attempt to study the microstructure and shear-induced transitions for a percolated dispersion of CB at 2 wt% in a microemulsion system composed of Triton X100, decanol, and water.Reference La Mesa, Ranieri and Terenzi18
II. EXPERIMENTAL
A. Materials and samples preparation
Ketjen black EC-300 (KB, density = 1.90 g/cm3, BET [Brunauer-Emmett-Teller] surface area = 800 m2/g1) was purchased from Akzo-Nobel (Sundsvall, Sweden), Triton X100 (t-octylphenoxypolyethoxyethanol; average molecular weight = 625 amu, critical micelle concentration, cmc = 0.9 mM at 25 °C, with a cloud point = 65 °C), and 1-decanol (99%) was obtained from Sigma Aldrich (Saint-Quentin-Fallavier, France). Distilled water was used in the preparation of samples.
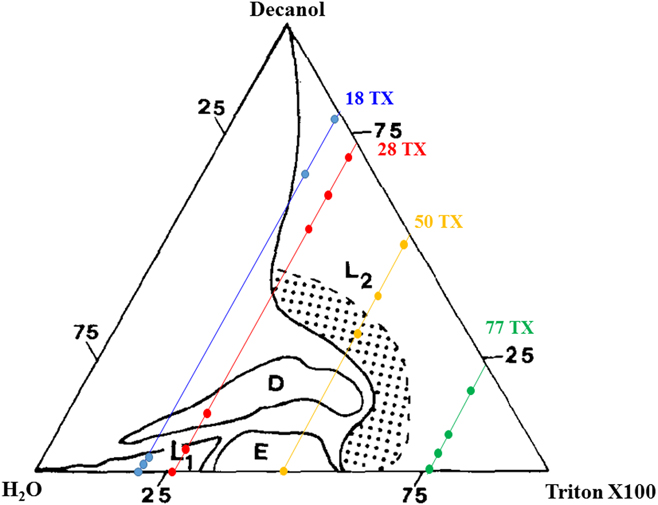
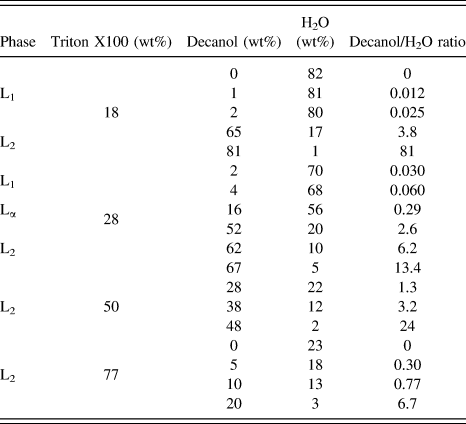
First, selected microemulsion systems along four dilution lines [Fig. 1] were prepared by stirring an appropriate amount of Triton X100 with decanol and distilled water. Table I depicts the composition (in weight-by-weight percentage w/w) of the microemulsions used in this study.
Ternary phase diagram of Triton X100–decanol–water at 20 °C. Reproduced with permission from Ref. Reference La Mesa, Ranieri and Terenzi18. The colored lines are the four dilution lines at 18, 28, 50, and 77 wt% Triton X100.

Composition of microemulsions in weight/weight percentage and the corresponding phase type.

The KB suspensions were prepared by mixing a fixed amount (at 2% w/w) of KB with the microemulsions by using a planetary ball-mill (Planetary Micro Mill PULVERISETTE 7 classic line, FRITSCH, Idar-Oberstein, Germany) at 500 rpm for one hour at ambient temperature.
B. Rheo-dielectric measurements
In a stress-controlled rotational rheometer (Physica MCR 101, Anton Paar, Courtaboeuf, France) the dynamic and steady shear rheological measurements were conducted at 25 C using a plate–plate geometry with a plate diameter of 50 mm and a gap of 1 mm. The electrochemical impedance spectra represented by Nyquist plots were simultaneously recorded under shear flow using a potentiostat/galvanostat (SP200, Bio-Logic Science Intruments, Seyssinet-Pariset, France) connected to the rheometer.
To avoid the effect of aging on the rheological and electrical behaviors, the freshly prepared KB suspensions were directly examined. The samples were first pre-sheared at 100 s−1 for 10 min to eliminate the shear history and guarantee a similar treatment for all samples. Then, the samples were left for 5 min at rest to recover the equilibrium structure.
The impedance spectra were recorded over a frequency range of 10−2–105 Hz with an ac of amplitude = 100 mV. The impedance spectra under flow conditions were recorded at the end of each shear flow sessions (15–30 min) where the steady shear conditions were almost achieved.
C. Rheo-microscopy
The optical inspection of the samples was done using the optical shear system (CC450, Linkam, Tadworth, United Kingdom). The samples were placed between two polished quartz plates at 1 mm gap and 25 °C. The photographs were recorded using a CCD (charged couple device) camera at defined shear rate.
III. RESULTS AND DISCUSSION
A. The phase diagram of Triton X100–decanol–water system
Figure 1 represents the phase diagram of the Triton X100–decanol–water system at 20 °C.Reference La Mesa, Ranieri and Terenzi18 The authors described the phase diagram to be dominated by a very large region of an isotropic reverse micellar solution (denoted by L2) at the Triton–decanol corner and a small direct micellar region (L1) in the water-rich part. The two micellar phases are separated by two lyotropic liquid crystalline phases: lamellar (Lα) and hexagonal (E) phases. Nevertheless, the isotropic phases are not usual micellar systems, instead they are microemulsion systems. The L1 phase is an oil-in-water (O/W) microemulsion (Winsor I), but the L2 phase is a water-in-oil (W/O) microemulsion (Winsor II).
B. Rheology of microemulsions
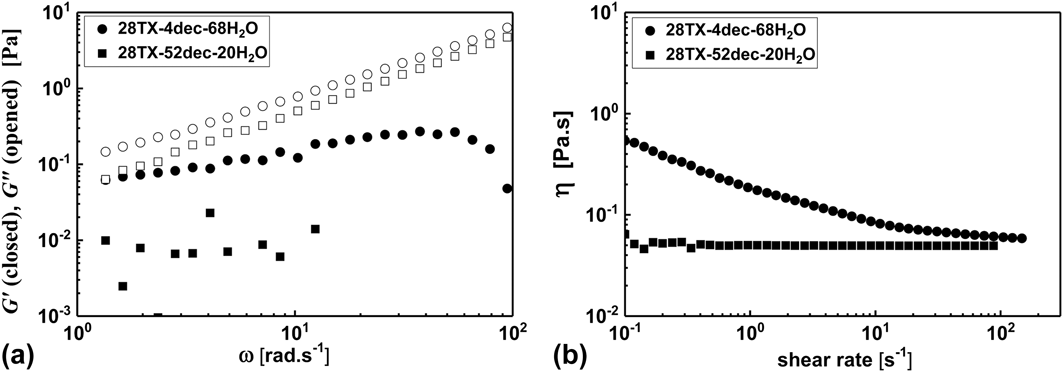
The rheological properties of microemulsions reflect the evolution of microstructure from discontinuous to bicontinuous microemulsion. By comparison, Fig. 2 demonstrates the dynamic frequency sweep [Fig. 2(a)] and steady shear rheology [Fig. 2(b)] for two microemulsions in L1 and L2 phases at constant surfactant concentration (28 wt%). It can be seen that both O/W and W/O microemulsions show a liquid-like rheogram where the loss modulus (G′) is higher than the storage modulus (G″) and both dynamic moduli are somewhat dependent on the angular frequency (ω). Moreover, the magnitude of the dynamic moduli of the O/W microemulsion is slightly higher than those of the W/O microemulsion [Fig. 2(a)]. Rationally, the W/O microemulsion exhibits a pure Newtonian behavior where the steady shear viscosity (η) is independent of the shear rate [Fig. 2(b)]. This is in accordance with the behavior exhibited by discontinuous O/W microemulsions of analogous surfactant/oil/water systems.Reference Warr19 However, the W/O microemulsion exhibits a weak shear-thinning behavior at low shear rates and becomes Newtonian at higher shear rates [Fig. 2(b)]. This behavior is in contrast to previous studies that showed shear-thinning only at very high shear rates.Reference Sharma, Wilson, van der Walle, Sattar, Petrie and Kumar20,Reference Acharya and Hartley21 Such a discrepancy may attribute to probable weak interaction between the clustered droplets of the percolating microemulsion so that they rearrange under low shear rates. It should be stated that the rheology of microemulsion systems is strongly influenced by the type, morphology, and degree of clustering of droplets as well as the interaction between droplets. However, rheology is not sensitive enough to elucidate the shear-induced microstructure encountered in microemulsions.
(a) Dynamic frequency sweep tests and (b) steady shear rheology of two samples in the L1-phase (O/W microemulsion) at 28 wt% Trion X100-4 wt% decanol–68 wt% H2O and L2-phase (W/O microemulsion) at 28 wt% Trion X100-52 wt% decanol–20 wt% H2O.

C. Dispersions of CB in microemulsions: equilibrium microstructure
CB is the common electrically conductive additive in the formulation of electrode slurries in rechargeable and semisolid redox batteries. It lends the electrical conduction when a three-dimensional network is constructed above a critical concentration, the so-called percolating threshold where the pathways (branches) are fully built through the dispersion. Conductive KB is a highly conductive commercial type of CB that has a percolating threshold at 2 wt% in organicReference Youssry, Madec, Soudan, Cerbelaud, Guyomard and Lestriez5 and aqueousReference Youssry, Kamand, Magzoub and Nasser22 media. Accordingly, 2 wt% KB was selected in the current study to examine its dispersion in microemulsion systems. Along the four dilution lines [Fig. 1], various dispersions of KB in L1 and L2 phases were prepared and examined by rheology, impedance spectroscopy, and optical inspection under flow conditions. The detailed composition of various dispersions is depicted in Table I.
To assure the minimal perturbation for the microstructure of the KB dispersions, the linear viscoelastic regimes were identified by the dynamic strain sweep tests (data not shown). In general, the dispersions show a gel-like response where the storage modulus (G′) is higher than the loss modulus (G″) and both moduli are independent of the strain at low strain amplitude. This is the linear viscoelastic region above which the G′–G″ crossover appears and G′ becomes lower than G″ where the dispersions behave liquid-like indicating the serious perturbation of the microstructure.
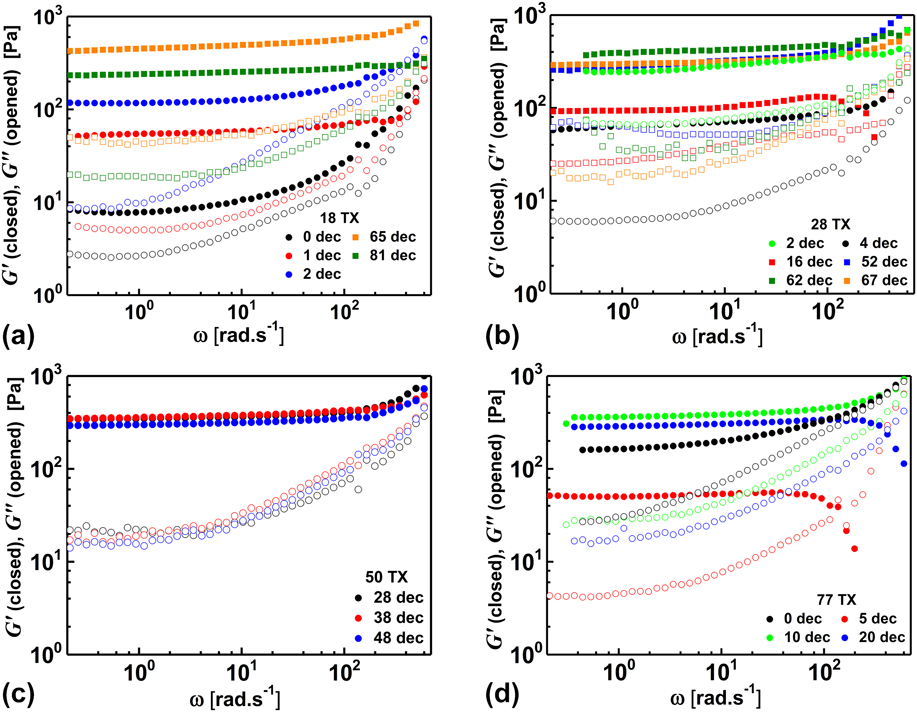
Figure 3 depicts the dynamic frequency sweep tests for dispersions of 2 wt% KB in various microemulsions along the four dilution lines. This is a dynamic rheology where the flow is induced by applying the pre-defined (from strain sweep experiments) minimal strain amplitude, and the variation of dynamic moduli (G′, G″) is monitored with the angular frequency (ω).
Variation of storage (G′) and loss (G″) moduli with the angular frequency (ω) for carbon black dispersions at 2 wt% KB in various microemulsion systems (L1: circles and L2: squares). The composition of the microemulsion is represented by wt% (e.g., 18 TX 1 dec denotes 18 wt% Triton X100, 1 wt% decanol, and 81 wt% H2O).
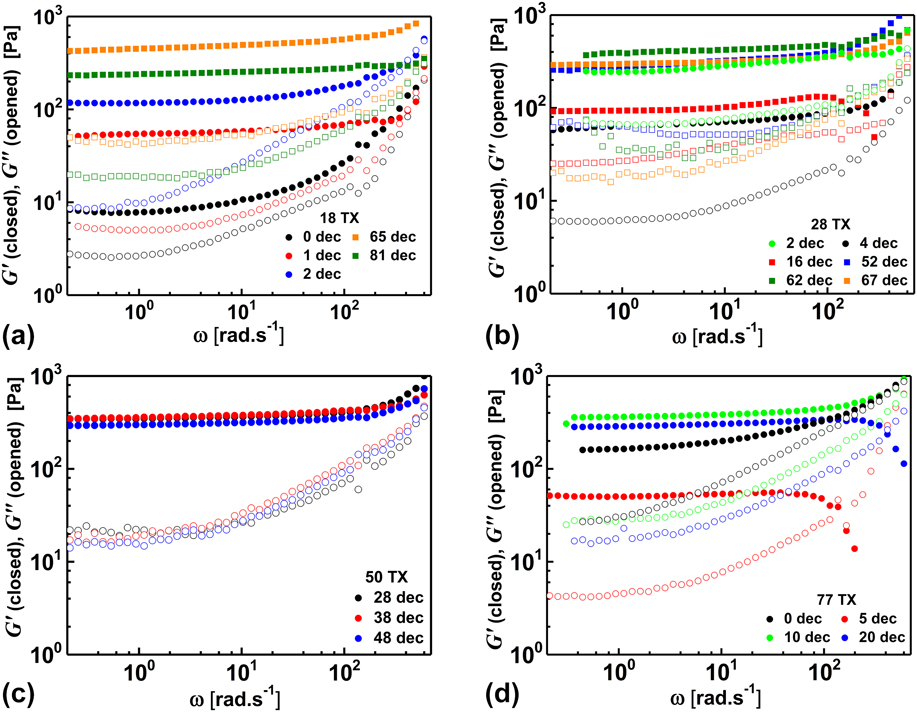
It can be seen from Fig. 3 that all the KB dispersions present a weak gel-like rheological response where G′ is one decade higher than G″, and G″ shows some dependency on the frequency until the moduli crossover at higher frequency. This qualitative description reveals the percolated nature of the KB dispersions, but the density of KB branches is not high enough to form a strong gel. It is worth noting that the KB dispersions in L1 microemulsions (circles in Fig. 3) have lower magnitudes of dynamic moduli than their analogous prepared in L2 microemulsions (squares in Fig. 3). This trend is independent of the concentration of the surfactant. Moreover, the magnitudes of G′ and G″ for KB dispersions in the L1 phase are strongly influenced by the decanol/water ratio [Fig. 3(a)] much more than those prepared in the L2 phase [Fig. 3]. In general, the dispersions of 2 wt% KB in microemulsions exhibit a weaker gel-like rheological response and lower magnitude of dynamic moduli than the dispersion of 2 wt% KB in pure Triton X100 (at only 5 wt% Triton).Reference Madec, Youssry, Cerbelaud, Soudan, Guyomard and Lestriez11
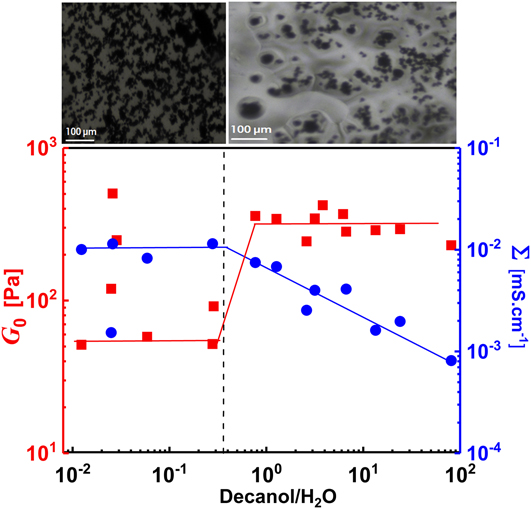
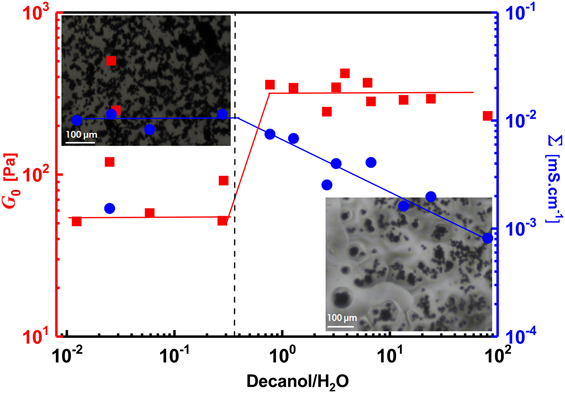
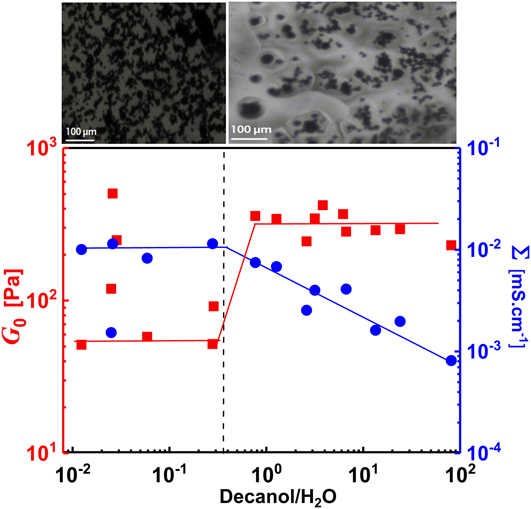
To quantitatively account for the effect of decanol/water ratio on the rheological behavior of the dispersions, the variation of the plateau modulus (G 0) with decanol/water ratio is depicted in Fig. 4. At very low decanol/water ratios (<0.03), the L1-based KB dispersions are very sensitive to decanol addition and G 0 strongly increases. Above a ratio of 0.03, G 0 abruptly decreases again. This behavior may be ascribed to a structural transition from normal micelles, over a very limited region, to O/W microemulsions that stabilize the KB dispersion. The inset micrograph (left) reveals the microstructure of the KB dispersion at equilibrium where a fully percolated KB network is well constructed [Fig. 4]. For the L2-based KB dispersions (decanol/water ratio >0.3), G 0 increases by one decade and almost remains independent of the decanol/water ratio. This implies that hydrophobic KB agglomerates and “encapsulates” in the organic droplets of the W/O microemulsion so that any increase in the decanol content does not alter the rheological behavior. The inset optical photograph (right) is evident to the equilibrium microstructure of KB in W/O microemulsions where the KB agglomerates are encapsulated in isolated domains where the KB network loses its percolation identity.
Variation of the rheological plateau modulus (G 0) and electrical conductivity (Σ) with the decanol/H2O ratio. The solid lines are a guide to the eyes, and the dashed line separates the KB dispersions in L1 and L2 microemulsions. The inset photographs are KB dispersions in L1 (left) and L2 (right) phases. Using EC-Labs software (Bio-Logic Science-Instruments), the Nyquist plots [Fig. 5] were fitted by an equivalent circuit proposed in Ref. Reference Youssry, Madec, Soudan, Cerbelaud, Guyomard and Lestriez5 to obtain the electrical conductivity of dispersions.
It is well stated that the impedance spectra and extrapolated electrical conductivity of dispersions are very sensitive to the microstructure.Reference Mewis, de Groot and Helsen23 The equilibrium microstructure of KB dispersions can be revealed by monitoring the electrochemical impedance spectra, represented by Nyquist plots (variation of the imaginary part of impedance Z″ versus the real component Z′) as shown in Fig. 5. In general, all the KB dispersions show semicircle Nyquist plots implying the conductive nature of dispersions at the 2 wt% KB content, consistent with previous findings for CB dispersions.Reference Youssry, Madec, Soudan, Cerbelaud, Guyomard and Lestriez5 For each dilution line (i.e., at constant Triton concentration), the semicircles get narrower as the decanol concentration increases, implying the increased electrical conductivity. To better account for the effect of decanol on the electrical behavior of dispersions, the Nyquist plots were fitted by previously proposed equivalent circuitReference Youssry, Madec, Soudan, Cerbelaud, Guyomard and Lestriez5 using EC-Labs software (Bio-Logic Science-Instruments) to extrapolate the electrical conductivity (Σ) of dispersions.
Impedance spectra, represented by Nyquist plots (imaginary Z″ versus real Z′ component of impedance), of 2 wt% KB in L1 (circles) and L2 (squares) microemulsions at rest, at 25 °C (at 100 mV).
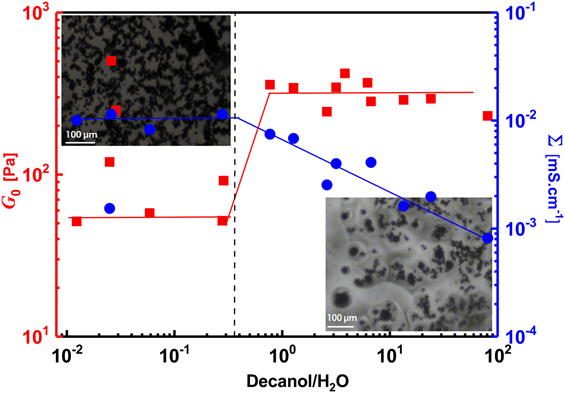
As can be seen from Fig. 4, the L1-based KB dispersions show higher electrical conductivity than those prepared in the L2 phase. In addition, the conductivity of L2-based KB dispersions is very sensitive to decanol addition and exhibits a monotonic decrease as the decanol concentration increases. This behavior may be attributed to the isolation of KB aggregates due to the decrease of the number density of conductive branches when the decanol concentration increases. On the other hand, O/W microemulsions stabilize the KB dispersions and the percolated network is still constructed.
In conclusion, the dispersion of 2 wt% KB in the O/W microemulsion system (at 2–4 wt% decanol) showed the optimal rheological (less rigidity) and electrical (higher conductivity) properties that render them adequate conductive substrates to formulate electrode slurries with sufficient colloidal stability.
D. Dispersions of CB in microemulsions: effect of shear flow
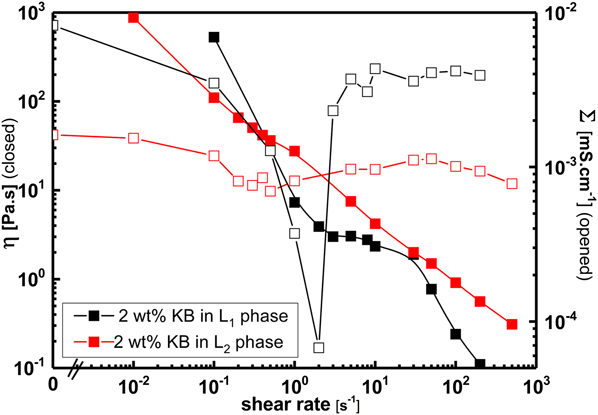
Since the linear viscoelastic rheology revealed the equilibrium microstructure of KB dispersions, it worth examining their flow behavior under destructive conditions to account for probable shear-induced structural transitions. The steady-shear rheology represented by the variation of steady viscosity (η) with shear rate is depicted in Fig. 6 for two selected KB dispersions in L1 and L2 phases. In general, the two KB dispersions show a non-Newtonian behavior with yield stress where the dispersions exhibit two shear-thinning regimes at low and high shear rates separated by a shear-thickening region over intermediate rates. Such a complex rheological behavior had previously been reported for analogous dispersions of CB and nanofibers.Reference Youssry, Madec, Soudan, Cerbelaud, Guyomard and Lestriez5,Reference Youssry, Guyomard and Lestriez24 In terms of shear-induced structural transitions, the first shear-thinning is mainly attributed to the breaking up of the percolated network into small KB aggregates so that the viscosity tremendously decreases. As the shear rate increases, the anisometric KB aggregates erode under flow, showing leveling-off (shear-thickening) at intermediate rates. Upon further increase of the shear rate, the aggregates align with the flow showing the second shear-thinning. By comparison, the L1-based dispersion shows a shear-thickening region at relatively higher shear rates than the L2 dispersion. This implies the strength of the percolated network of KB in the L1 phase.
Variation of steadyi viscosity (η) and electrical conductivity (Σ) with shear rate for 2 wt% KB dispersions in L1 (28 wt% Triton X100, 4 wt% decanol, and 68 wt% H2O) and L2 (28 wt% Triton X100, 67 wt% decanol, and 5 wt% H2O) phases.

Simultaneous measurements of the electrical conductivity under shear flow support the trend of viscosity with shear rate. As can be seen from Fig. 6, the KB dispersion in the L1 phase has higher electrical conductivity than its analogous in the L2 phase over the extended shear rate. In line with the three-regime flow curve, the electrical conductivity first decreases with the shear rate showing a minimum over intermediate shear rate in tandem with the shear-thickening region. Further increase of the shear rate results in increasing of the electrical conductivity. It should be noted that conductivity minimum is much more pronounced for the KB dispersion in the L1 phase than the dispersion in the L2 phase.
The optical inspection of the KB dispersions under shear flow introduces direct evidence for the structural transitions. Figure 7 represents the textures of two KB dispersions in L1 and L2 phases. At rest (0 s−1), the L1-based dispersion shows a percolated KB network that undergoes shear-induced breaking up into anisometric aggregates at 0.5 s−1 [Fig. 7(a)], in agreement with the decrease in viscosity and electrical conductivity as discussed above. At higher shear rates (100 s−1), the anisometric aggregates come in contact and align under flow leading to recovered electrical conductivity. On the other hand, the L2-based dispersion [Fig. 7(b)] lacks the three-dimensional percolated network and the KB aggregates seem to be encapsulated in the large droplets at rest (0 s−1). Under shear flow, the droplets and encapsulated KB aggregates become smaller as the shear rates increase.
Optical photographs of KB dispersions in (a) L1 and (b) L2 microemulsions at rest (shear rate = 0 s−1) and flow conditions (shear rates = 0.5 and 100 s−1).

IV. CONCLUSION
In this article, we demonstrate a comparative study for the rheological and electrical properties of CB (KB) dispersions in the oil-in-water (O/W) and water-in-oil (W/O) microemulsion systems composed of a nonionic surfactant (Triton X100), decanol, and water. Besides the traditional rheology, simultaneous measurements of the impedance spectra (rheo-electrical) and optical texture (rheo-microscopy) of the KB dispersions at equilibrium and under shear flow proved to be powerful techniques to elucidate the equilibrium microstructure and shear-induced structural transitions in CB dispersions.
The percolated KB dispersions (at 2 wt%) in O/W microemulsions at relatively low (2–4 wt%) decanol concentration exhibited optimal rheological (low plateau modulus, i.e., less rigidity) and electrical (higher electrical conductivity) properties with enhanced colloidal stability than those prepared in W/O microemulsions or in micellar systems of Triton X100 (decanol-free).
The shear-induced structural transitions reflected by the three-regime (thinning-thickening-thinning) flow curve and inverted-bell conductivity curve of KB dispersions were clearly discussed, for the first time, in light of the visual inspection of textures by rheo-microscopy.