Introduction
Currently, anxiety disorders are highly prevalent among the elderly (Pearson, Reference Pearson1998; Bryant et al., Reference Bryant, Jackson and Ames2008). A review indicated that 1.3%–7.1% of adults aged 55 years or older may have generalized anxiety disorders (Bryant et al., Reference Bryant, Jackson and Ames2008). Zhang and colleagues (Reference Zhang, Zeng and Yang2010) reported that 21.63% of healthy older people in the Chongqing Province of China have anxiety symptoms, and that proportion is elevated to 48.19% when elderly adults with some physical illness are included. Anxiety strongly influences people's lives, and it can be a burden to both the person and society. At the individual level, anxiety symptoms have been found to be associated with increases in sleep disturbances (Brenes et al., Reference Brenes, Miller, Stanley, Williamson, Knudson and McCall2009), increased intakes of anxiety-related medications (Goncalves et al., Reference Goncalves, Pachana and Byrne2011), increases in disability (Brenes et al., Reference Brenes, Guralnik, Williamson, Fried, Simpson and Simonsick2005), and decreases in cognitive functioning (Stanley et al., Reference Stanley, Roberts, Bourland and Novy2001). At the societal level, anxiety is related to increased utilization of health services. Many factors, including gender (Schaub and Linden, Reference Schaub and Linden2000; Jia, Reference Jia, Shi, Zhou, Fu and Lv2007), age (Kogan et al., Reference Kogan, Edelstein and McKee2000), education (Schaub and Linden, Reference Schaub and Linden2000), marriage (Pachana et al., Reference Pachana, Byrne, Siddle, Koloski, Harley and Arnold2007), and illness (Wolitzky-Taylor et al., Reference Wolitzky-Taylor, Castriotta, Lenze, Stanley and Craske2010), may affect the levels of anxiety experienced by elderly adults. However, the investigations into these different factors have yielded different results.
Moreover, anxiety remains less well studied in elderly adults compared to other problems such as depression and dementia. Although existing anxiety scales, such as the Beck Anxiety Inventory (BAI), the Short Anxiety Screening Test (SAST) and the State-Trait Anxiety Inventory (STAI), have produced normative data for elderly populations, these scales were not designed specifically for elderly adults and have some deficiencies (Pachana et al., Reference Pachana, Byrne, Siddle, Koloski, Harley and Arnold2007). To overcome the deficiencies, Pachana developed the Geriatric Anxiety Inventory (GAI) in 2007 (Pachana et al., Reference Pachana, Byrne, Siddle, Koloski, Harley and Arnold2007).
The GAI is a 20-item self-reported instrument that is able to discriminate between those with and without anxiety symptoms and between those with and without DSM IV Generalized Anxiety Disorder (GAD) (Pachana et al., Reference Pachana, Byrne, Siddle, Koloski, Harley and Arnold2007; Rozzini et al., Reference Rozzini2009). The GAI is characterized by the following features: relative brevity (to minimize fatigue), simple wording of the items (Nancy and Gerard, Reference Nancy and Gerard2007), a dichotomous response format that is easy for people with poor education or mild cognitive impairment to use (Byrne and Pachana, Reference Byrne and Pachana2011), and the ability to be used as a self-rated instrument or administered by a trained health professional (Pachana and Byrne, Reference Pachana and Byrne2008). Due to these features, the GAI had gained rapid acceptance and become increasingly popular (Edelstein et al., Reference Edelstein2007). Previous research has provided strong psychometric support for the GAI; the GAI has excellent reliability, strong convergent validity, and greater utility for the classification of patients with and without anxiety symptoms.
The GAI has been translated into several languages, including Spanish, French, German, Polish, and Portuguese (Byrne and Pachana, Reference Byrne and Pachana2011; Ribeiro et al., Reference Ribeiro, Paúl, Simões and Firmino2011). To our knowledge, no Chinese translation or any validation of the scale in China has yet been completed. To explore the anxiety levels of Chinese elderly adults, the development and validation of appropriate Chinese-language instruments in needed. Therefore, the first goal of this study was to analyze the psychometric properties of the Chinese version of the GAI (GAI-CV) with both classical test theory (CTT) and item response theory (IRT). The second goal of this study was to explore the anxiety conditions and related factors of the elderly adults living in Beijing communities using the GAI-CV.
Methods
Sample
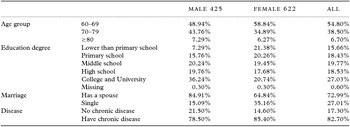
Overall, 1,047 people (59.4% female) living in the communities of Beijing participated in this study. All participants were 60 years of age or older, and the mean age was 70.83 years (SD = 7.06). Their other basic information is shown in Table 1.
Basic sample information (n = 1,047)

Measures
All participants completed three scales.
GAI-CV – the Chinese version of the GAI was developed in collaboration with the authors of the original version. The original GAI was first translated into Chinese by ten graduates who majored in aging psychology. Second, the Chinese GAI was back-translated into English by ten graduates who majored in English. We next compared the back-translated version with the original version. Only one significant adaptation was deemed necessary because of cultural differences in expressing anxiety symptoms. Specifically, the original item, “I often feel like I have butterflies in my stomach,” was replaced with the idiom, 我经常觉得心里七上八下的 because the context of this reference to butterflies is not common in the Chinese language.
Beck Anxiety Inventory (BAI) – the BAI is a 21-item self-report instrument for measuring the anxiety severity in adolescents and adults, and the responses range from 0 to 3. The BAI has been proven to be highly internally consistent and valid in previous research (Fydrich et al., 1992; Steer et al., Reference Steer, Ranieri, Beck and Clark1993).
Self-Rating Anxiety Scale (SAS) – the SAS is a 20-item self-report instrument that has been widely used for the assessment of generalized anxiety and treatment effects. Responses range from 1 (“rarely or never”) to 4 (“most or all of the time”). The SAS has been found to be a good indicator of anxiety (Lindsay and Michie, Reference Lindsay and Michie1988; Olatunji et al., Reference Olatunji, Deacon, Abramowitz and Tolin2006).
BAI and SAS have been translated into Chinese several years ago and have proved to be effective instruments to measure adults’ anxiety. Both of them have good psychometric properties when used in China.
CTT was used to analyze the GAI-CV's reliability, validity, and the relationship between GAI total scores and sociodemographic information. IRT can be regarded as the central component of modern psychometrics and makes stronger assumptions than the CIT; specifically, CIT includes the assumption of local independence and the assumption of logistic relationships between item responses and the underlying trait. IRT models allow for the precision of measurements of the underlying latent trait to be established at any point, which makes IRT more informative and precise than CTT. Therefore, IRT was used to analyze the appropriateness and precision of the GAI-CV. IRT analyses include model fits, parameter estimations and information estimations. There are many models of IRT. Based on the structure of the data, we chose a two-parameter logistic item response model (2PLM): Pj (θ i ) = 1/[1 + exp(− α j (θ i − β j )]. In this model, Pj(θ i ) denotes the probability that an individual with trait level θ i will endorse item j in the keyed direction. The item difficulty parameter (β j ) represents the level of the latent trait necessary for an individual to have a 0.50 probability of endorsing the item in the keyed direction. The item discrimination parameter (α j ) represents an item's ability to differentiate between people with contiguous trait levels.
Procedure
Fifteen communities of Beijing, China were randomly selected. One hundred randomly selected elderly adults between the ages of 60 and 90 participated in the interviews. Data were collected with questionnaires. Each participant provided detailed sociodemographic data that included gender, age, education, marital status, and physical health status. Participants then completed the 20-item GAI-CV, the 20-item SAS and the 21-item BAI. Two trained psychology graduate students were present during the interviews in each community and answered all questions of the participants. The average time for the interview was 30–45 minutes. Research assistants checked questionnaires for missing data and asked participants to complete any missing data points. If they refused to do this and the questionnaires had many missing points, their data would be deleted. After cleaning the data, 1,047 effective data were left finally.
Results
Reliability and concurrent validity analyses
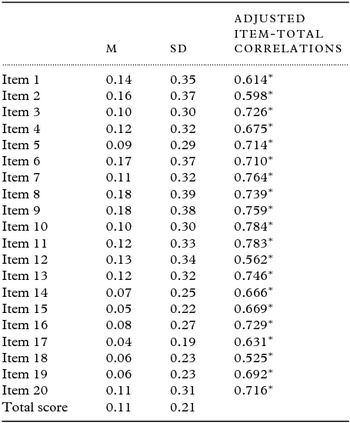
According to the CTT analysis, the Cronbach's α coefficient was 0.94. The item-total correlations for the 20 items are shown in Table 2. Concurrent validity was assessed using Pearson product-moment correlations between the GAI-CV and the other two measures of anxiety: GAI-CV × SAS (0.523, p < 0.05), GAI-CV × BAI (0.560, p < 0.05). The GAI-CV had high reliability and concurrent validity in older adults from Beijing communities.
Item-total correlations of the 20 items of the GAI-CV (n = 1,047)

Note: *p < 0.01.
Item Response Theory (IRT) analyses
Unidimensionality and model fit
Byrne and Pachana (Reference Byrne and Pachana2011) described their scale as being unidimensional. Confirmatory factor analysis (CFA) with maximum-likelihood estimation supported the unidimensionality of the scale. The fit indices suggested a good fit between the single factor model and the observed data; the CFI was 0.969, the TLI was 0.992, and the RMSEA was 0.057.
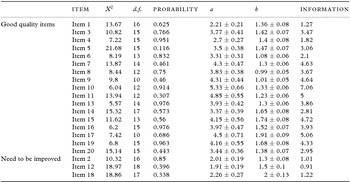
The IRT for Patient-Reported Outcomes, version 2.0 (IRT PRO 2.0) was used for the IRT analyses. The global fit of an IRT model may be assessed by goodness-of-fit statistics, such as the Pearson goodness-of-fit statistic X2 , which asymptotically follows a X2 distribution. Table 3 shows the results. None of the differences between the actual responses and the estimated responses of the participants were significant, which indicates an excellent model-data fit.
2PLM fit results, parameter estimates, and information (n = 1,047)

IRT parameter estimation
The item difficulty (threshold) and discrimination parameters are presented in Table 3. As seen from this table, the item discrimination parameters were in the moderate to high range, and most were greater than 2.0; these results indicate that the GAI-CV discriminated individuals with high and low anxiety severities.
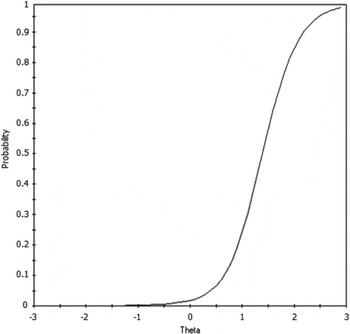
The item threshold parameters ranged from 0.97 to 2, which indicates that the items were endorsed by those with the most severe anxiety. Therefore, the test is more precise for those with the most serious anxiety; this was especially true for items 14, 15, 17, 18, and 19, which had threshold parameters greater than 1.6. The example test item response function (IRF) for the anxiety levels of the elderly people presented in Figure 1 uses the estimated item discrimination and item threshold parameters from Table 3. As seen in this figure, the test's IRF has a steep slope, and the threshold value is greater than 0. The information functions, which are inversely related to the standard error of the estimate of the latent trait score for anxiety severity (
 $SE(\theta_\alpha ) = 1/\sqrt {\sum {I_j(\theta _\alpha )} }$
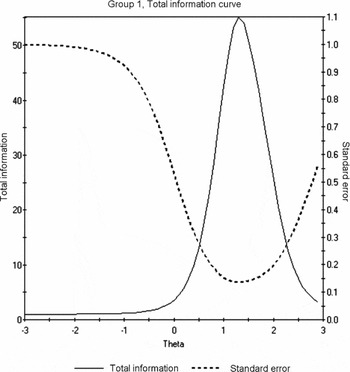
), were obtained for each item. Table 3 displays the amount of information that each item yielded on its own. The more information provided by an item or by a test, the greater the precision with which that item or test score is estimated. The test information function is derived by simply summing the information functions of the diagnoses at each level of anxiety severity. The standard error should generally not be greater than 0.2, which means that the test information score should be greater than 25. If the standard error is between 0.2 and 0.25, the test information score should be in the range of 16 to 25 (Tu and Cai, Reference Tu and Cai2005). The test information function is presented in Figure 2. As seen in this figure, the test information curve (TIC) is characterized by a single sharp peak. The TIC illustrates the large measurement error that is present for the estimation of anxiety severity in participants who are in the lower range of the anxiety severity trait. In general, participants in the high range of this trait had more accurate severity estimates. The most accurate estimates can be obtained when anxiety severities are approximately 1.5 with maximum information scores of 55 and standard errors of 0.13. Because the total information is the sum of each item's information, the information of each item should be greater than 25/20 = 1.25. If an item's information is between 0.8 (16/20) and 1.25, that item should be reconsidered and adjusted. Table 3 indicates that items 2, 12 and 18 should be adjusted.
Test item response functions of the GAI-CV (n = 1,047).

Test information curves (TICs) of the GAI-CV. The solid line indicates information, and the dashed line indicates the standard error (n = 1,047).

Relationship with sociodemographic variables
The average score across all participants was 2.17 (SD = 4.19), which is less than the cut-off score of 10/11 set by Pachana et al. (Reference Pachana, Byrne, Siddle, Koloski, Harley and Arnold2007). This finding indicates that the anxiety severity of elderly people in Beijing communities is not high. Women scored higher on the GAI-CV than men (t = −4.712, p < 0.05). A significant association was found between age group and score (F(2,1044) = 3.345, p < 0.05). Post hoc tests showed that there was a significant difference in anxiety severities between the 60–69 and 70–79 age groups (mean difference = 0.349, p < 0.05). No difference in anxiety severity due to education level was found (F(4,1038) = 1.705, p > 0.05). Marital status was not related to anxiety severity (F(1,1041) = 0.11, p > 0.05). People with chronic diseases tended to be more anxious than those without chronic diseases (t = −4.782, p < 0.05).
Discussion
The main aim of this study was to analyze the psychometric properties of the Chinese version of the Geriatric Anxiety Inventory (GAI-CV) with both CTT and IRT approaches. Simultaneously, we investigated the severity of anxiety and related factors among elderly people in Beijing communities. The internal consistency and concurrent validity obtained for the scale were excellent and similar to those obtained for the English version (Pachana et al., Reference Pachana, Byrne, Siddle, Koloski, Harley and Arnold2007). All 20 items had item-total correlations of 0.48 or more, and most items were above 0.50. Concurrent validity was assessed using Pearson product-moment correlations between the GAI and the other two measures of anxiety: BAI and SAS. The correlation coefficient shows that GAI-CV is an effective instrument to measure people's anxiety. Regarding item properties, the items clearly differed in terms of their discrimination and threshold parameters. Considering the scale as a whole, the standard error plot shows that the GAI-CV accurately measured anxiety across the middle to high trait level scores; however, at the lower trait level scores, the standard error rapidly increased. Thus, as a whole, the scale is less well suited for participants with lower levels of anxiety, which may be related to item wording. In the scale, 11 items use “always” and “often” to describe the symptoms, which may lead participants with more serious anxiety to choose “agree.” Items 14 (I always anticipate that the worst will happen), 15 (I often feel shaky inside), 17 (My worries often overwhelm me), 18 (I sometimes feel a great knot in my stomach) and 19 (I miss out on things because I worry too much) had the largest threshold parameters. In these items, certain words, such as “shaky inside,” “overwhelm,” and “too much,” suggest high-level anxiety and serious consequences, and some words represent actual outcomes, such as “the worst will happen” and “miss out on things.” Moreover, there are some words that represent the physical reactions caused by anxiety, such as a “great knot in my stomach.” Thus, as a whole, the scale is less suited for participants with lower levels of anxiety. The development of new items that describe lower levels of anxiety should be considered for these participants. New items that describe lower levels of anxiety and would only be “agreed” to by persons with low trait anxiety levels should be included.
Importantly, item information curves can represent the relative precision of each item across different levels of the trait continuum. Thus, summing the information from each item can produce information about the entire scale. In IRT models, measurement precision can potentially differ for people with different trait levels. Unlike classical test theory, which typically represents measurement precision with a single number (such as Cronbach's α), there are as many standard errors of measurement as there are unique trait estimates in IRT. By analyzing the information from each item, we found that most of the items were sufficiently precise, with the exceptions of items 2, 12, and 18, the information values of which were smaller than the standard. Item 12 (“I get an upset stomach due to my worrying”) and item 18 (“I sometimes feel a great knot in my stomach”) are about physical reactions. Although other research has found that somatic symptoms may be an important part of anxiety (Olatunji et al., Reference Olatunji, Deacon, Abramowitz and Tolin2006; Marquez-Gonzalez et al., Reference Marquez-Gonzalez, Losada, Fernandez-Fernandez and Pachana2012), the GAI-CV items related to somatic symptoms did not measure the anxiety of the elderly precisely enough. This insufficient precision may be because older adults tend to experience many somatic symptoms that could make it difficult to determine whether these symptoms are caused by anxiety or other conditions. Another potential explanation may be related to the fact that items related to somatic sensations are difficult to translate and thus, may have some limitations in terms of cross-cultural validity. Item 2 (I find it difficult to make a decision) is an item related to making decisions. This item may discriminate normal participants based on decision-making abilities and not on the basis of anxiety. Generally, these GAI-CV items need to be reconsidered and modified.
The average score across all participants was 2.17, and 92.4% of the participants received scores lower than 10/11. These results indicate that the levels of anxiety among the elderly of Beijing communities were not high. The ANOVA analysis showed that females tended to be more anxious than males, which is consistent with previous studies (Schaub and Linden, Reference Schaub and Linden2000; Jia, Reference Jia, Shi, Zhou, Fu and Lv2007; Bryant et al., Reference Bryant, Jackson and Ames2008). However, Pachana et al. (Reference Pachana, Byrne, Siddle, Koloski, Harley and Arnold2007) noted that the GAI is not significantly related to age or gender; this discrepancy may be due to the limitations of the sample of Pachana. The association between anxiety and chronic illness that we observed is also consistent with the literature related to anxiety in later stages of life (Vink et al., Reference Vink, Aartsen and Schoevers2008; Gum et al., Reference Gum, King-Kallimanis and Kohn2009). Our finding regarding the association between anxiety and marriage is not consistent with previous studies (Schaub and Linden, Reference Schaub and Linden2000; Vink et al., Reference Vink, Aartsen and Schoevers2008; Gum et al., Reference Gum, King-Kallimanis and Kohn2009). The main reason for this discrepancy may be cultural differences. In China, people tend to live with their children when they get old. In this sample, 216 (76.38%) of the elderly participants who did not have a spouse were living with their children or others. This housing situation may relieve some degree of anxiety. The ANOVA analysis results showed that we can get similar results with previous researches focusing on the relationship between anxiety and some sociodemographic variables when using GAI-CV. Even though, cultural differences may have effect on the results to some degree. This means that GAI-CV has a good validation and is effective in China.
Several limitations of this study should be acknowledged. The sample was composed solely of non-clinical elderly people living in Beijing communities; thus, the findings may not be generalizable to other groups of elderly adults, such as psychiatric samples. This limitation prevented us from constructing receiver operating characteristic (ROC) curves and determining a cut-point like that provided by Pachana. Additionally, as noted in other studies, anxiety is closely related to depression. However, this study included no assessment of discriminant validity. Thus, future studies should further analyze the GAI-CV.
Conclusion
The results of this study suggest that the GAI-CV has good psychometric properties. Furthermore, our data suggest that the scale can be recommended for measuring anxiety in non-clinical elderly Chinese people and that it may be a useful instrument for future research studies that seek to analyze anxiety and its correlates among older adults. The IRT analyses showed that the GAI-CV is more suitable for elderly adults with high levels of anxiety. This instrument is more precise and provides more information when applied to these types of participants. To improve the precision of the GAI-CV, items 12 and 18, which are related to somatic symptoms, and item 2, which is related to decision-making abilities, need to be modified. Future studies should test the properties of this Scale and explore the correlates of anxiety as measured with the GAI-CV in clinical samples of elderly participants of different populations, such as those who reside in the community or in nursing homes.
Conflicts of interest
None.
Description of the authors’ roles
Yan Yue and Xin Tao designed the study, analyzed the data, and wrote the paper; Wang Dahua collaborated on the adaptation of the scale, the implementation of the study, data analysis, and the writing of the paper; and Tang Dan collaborated on data collection from the elderly adults in the sampled districts.