The economic position of African Americans improved dramatically during the Second World War and the subsequent decades, both absolutely and relative to whites. In 1940 the average black worker earned only 43 percent as much as the average white worker; by 1970 the black-white earnings ratio rose to 64 percent.Footnote 1 This relative growth in black wages can be attributed both to a rise in the supply of skills offered by an increasingly well-educated black workforce and to a rise in the demand for black labor as discrimination in the labor market abated. Interregional migration also played a role. From 1940 to 1970 four million blacks moved from the low-wage South to the higher-wage North. James Smith and Finis Welch estimate that migration accounts for around 20 percent of black-white wage convergence during this period.Footnote 2
Scholarship on the Great Black Migration has focused almost exclusively on the wage gains realized by migrants themselves.Footnote 3 However, a migration this large likely had ramifications for the receiving economy as well. In particular, competition from migrant arrivals may have reduced the wages of existing northern workers. While black migration only increased the northern labor force by 4.5 percent, the number of black workers in the North more than doubled. If the average black and white worker were perfect substitutes, black migration would have been a drop in a very large bucket, and may have had a negligible effect on the average northern wage. If instead black migrants were closer substitutes to existing black workers, the negative wage effects of black migration would be concentrated among the small group of northern blacks.
In this article, I calculate what the pace of black and white wage growth in the North would have been from 1940 and 1970 in the absence of southern migration. The key parameter in this counterfactual exercise is the elasticity of substitution by race. Following George Borjas and Gianmarco Ottaviano and Giovanni Peri, I start with a production function in which an aggregate labor input is subdivided into skill groups by education and experience level.Footnote 4 Workers are assumed to be perfect substitutes with others of the same race and skill group, but to be imperfect substitutes with those of a different race or skill level. The elasticity of substitution by race can be recovered by estimating the relationship between changes in the black-white wage gap and changes in the ratio of black to white labor supply within a skill group over time. Southern migration generates shocks to the racial composition of northern skill groups that can be used to identify this parameter.
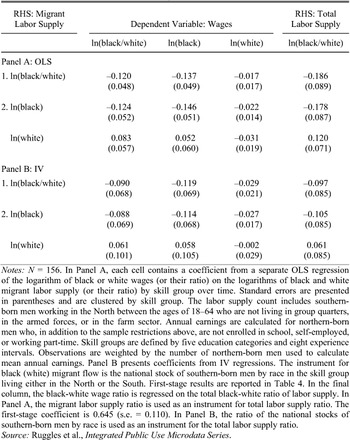
I find that white wages fall as either black or white labor flows into a skill group, but that black wages are only sensitive to black labor supply. The implied elasticity of substitution between similarly skilled black and white men ranges from 8.3 to 11.1 and is estimated with enough precision to reject perfect substitution. This finding is robust to using an instrumental variables procedure to address the concern that southerners chose to move North when wages in their race-by-skill cell were high. By this metric, blacks and whites were more substitutable in the postwar North than foreign- and native-born workers within similarly defined skill groups are today (elasticity = 5.6).Footnote 5 However, we must use caution when comparing across time periods because, as I show below, substitutability in the labor market, both across education groups and across experience levels, also appears to have been higher in the past.
The low elasticity of substitution between black and white workers in the same skill group could be driven by either direct discrimination in job assignment or differences in unobserved skill.Footnote 6 The average black student likely attended schools of lower quality than the average white student, particularly in the de jure segregated South. Southern black schools offered fewer resources per pupil and shorter school terms.Footnote 7 To disentangle direct discrimination from unobserved skill, I reestimate the model with skill groups defined by likely days, rather than years, of completed schooling and I find that school quality can explain around two-thirds of the imperfect substitutability by race with the broader skill cells.
Using the estimated elasticity of substitution by race within skill groups, I calculate what the black-white wage gap would have been in the North under a no-migration scenario. The actual wage gap between blacks and whites in the North declined by 15 log points from 1940 to 1970. I predict that, without southern migration, the wage gap would have declined by an additional five to seven points (30 to 50 percent). Incorporating the effect of new arrivals on existing black workers modifies the prevailing view of the Great Black Migration. Smith and Welch estimate that the average black migrant experienced a 30 percent increase in annual earnings by moving northward.Footnote 8 This figure translates into a gain of $1,972 per migrant per year in $2,000, or an aggregate gain of $7.88 billion for the four million migrants who made the journey. The three million blacks already in the North in 1940 started with higher average annual earnings of $10,509 in $2,000. A 7 to 10 percent decline in wages due to labor market competition translates into an aggregate loss of $2.21 to $3.15 billion for this group. While this exercise does not capture all of the gains and losses from migration—for example, it does not take into account possible wage gains in the South with a falling labor supply—we can conclude that the migration had clear winners and losers.
REGIONAL DIFFERENCES IN BLACK-WHITE WAGE CONVERGENCE, 1940–1970

Notes:
The first column presents the log wage gap between black and white men in 1940. Subsequent columns show changes in this gap over the following three decades. Wages are reported for men aged 18–64 who are not living in group quarters, in the armed forces, or in the farm sector. In addition, men must not be enrolled in school, be self-employed, or work part- time. All states in the southern census region are assigned to the South, with the exception of Delaware, the District of Columbia, and Maryland. The Northeast contains the New England and Mid-Atlantic Census divisions (as well as Delaware, DC, and Maryland). The Midwest encompasses the East and West North Central Census divisions and the West includes the Mountain and Pacific divisions.
Source:
Ruggles et al., Integrated Public Use Microdata Series.
WAGE CONVERGENCE AND INTERREGIONAL MIGRATION, 1940–1970
Black-White Wage Convergence by Region
African Americans experienced two major episodes of wage convergence in the twentieth century, one during the 1940s and the other during the late 1960s and early 1970s. Table 1 presents decadal changes in the black-white wage gap, both nationally and by region. In every region, the sharpest decline in the black-white wage gap occurred in the 1940s, with blacks experiencing the largest relative gains in the Midwest and the West. Both of these regions exhibited strong labor demand during World War II, particularly in defense-related industry, where black wages may have been further buoyed by President Roosevelt's executive order forbidding discrimination on the basis of race in firms holding government contracts.Footnote 9
Black wages diverged slightly from white wages in the 1950s, a decade of slow growth following the war. Convergence returned in the 1960s, particularly in the South. John J. Donohue and James Heckman argue that, given the uniformity of black wage growth by age group, it is unlikely that black educational attainment can explain this round of convergence. Instead, they suggest that strong convergence in the South is most consistent with an increase in the demand for black labor following a series of federal interventions in the southern labor market.Footnote 10 Since 1975 black wage growth has kept pace with—or even fallen below—that of white wages.Footnote 11
Southern Migration to the North
The growth of industrial production during World War II attracted southern migrants to northern cities. Table 2 demonstrates that the black share of the northern workforce increased from 3.9 to 5.3 percent (36 percent) over the 1940s, with 80 percent of this increase due to new migrant arrivals. The relative size of this flow is akin to the high rate of immigration to the United States in the 1990s, when the foreign-born share of the population increased from 7.4 to 10.3 percent (39 percent). The war also ushered in a large flow of white southern migrants, which is apparent in the third column of Table 2.Footnote 12 The pace of southern migration slowed in the 1950s, and then reversed in the 1960s.
In-migration generated a 102 percent increase in the black labor supply in the average skill cell.Footnote 13 The extent of this migration-induced increase in black labor supply varied by education level. In 1940, 9.6 percent of northern workers with an elementary education (0–5 years of schooling) were black southerners. The black migrant share of the labor force in this group doubled by 1960. In contrast, while only 1.5 percent of men with 8–10 years of school were black migrants in 1940, the black migrant share of this group tripled over the next 20 years. The counterfactual exercise at the heart of this article calculates alternative wage levels for black and white workers under different assumptions about the percentage change in black labor supply. In general, lower education groups had a larger black presence in 1940, but experienced smaller migration flows in percentage terms over the next 20 to 30 years.
SOUTHERN MIGRANT SHARE OF THE NORTHERN LABOR FORCE, 1940–1970

Notes:
Regional definitions are described in the notes to Table 1. Means reported for men aged 18–64 who are not living in group quarters, in the armed forces, or in the farm sector.
Source:
Ruggles et al., Integrated Public Use Microdata Series.
Evidence of Labor Market Segmentation by Race
In the mid-twentieth century, blacks and whites in the northern workforce possessed very different skill levels. Figure 1 presents the distribution of educational attainment for three groups of men working in the North in 1950: whites, southern-born blacks, and northern-born blacks.Footnote 14 While northern-born blacks were better educated than their southern-born counterparts, both groups lagged behind whites in the North. For example, 19 percent of young southern-born blacks had graduated from high school, compared to 28 percent of northern-born blacks and 39 percent of whites. Among older workers, only 5 percent of southern-born blacks had graduated from high school, compared to 10 percent of northern-born blacks and 16 percent of whites.
EDUCATIONAL ATTAINMENT OF MEN IN THE NORTHERN LABOR FORCE BY RACE AND BIRTH PLACE, 1950

Even among men with the same years of schooling and job experience, black workers often found themselves limited to a proscribed set of occupations and tasks. Case studies document that blacks were prevented from working at some firms, holding certain occupations—including skilled crafts, retail, and clerical work—and ascending to supervisory positions.Footnote 15
Overtly discriminatory hiring practices were banned in many northern states in the 1940s and 1950s.Footnote 16 Before that time, some firms simply refused to hire black workers. For example, for many years Ford Motor Company was the only automobile manufacturer in Detroit willing to hire black employees. As a result, in the early 1940s Ford employed 50 percent of black Detroiters and only 14 percent of local whites.Footnote 17
Even within “integrated” firms, blacks faced limited job opportunities. In manufacturing, blacks were often restricted to the hottest, dirtiest, or most dangerous parts of the factory. At the United States Steel Corporation in Pittsburgh, for example, “black men could advance no higher than first helper in the open hearth department.”Footnote 18 Joe William Trotter describes a similar process in Milwaukee, whereby tanneries employed blacks only in “the beam house, where dry hides were placed into pits filled with lime to remove hair,” and packinghouses “relegated Afro-Americans to the worst occupations … [in which they] unloaded trucks, slaughtered animals, transported intestines, and generally cleaned the plant.”Footnote 19
Case studies of particular industries emphasize that race-based job assignments cannot be satisfactorily explained by skill differentials alone.Footnote 20 Many factory positions required only a few weeks of on-the-job training. As one of Peter Gottlieb's interview subjects in Pittsburgh, Wesley M., attests: “I worked in that mill and I have learned those white boy[…] jobs. [They] would put them on my job, [and I would] learn them their jobs, but still I couldn't get the [better] job.”Footnote 21 Blacks were barred from crafts and trade work not for lack of ability, but because all-white or segregated unions limited their access to apprenticeships.Footnote 22 Similarly, blacks were bypassed for promotion because many white workers refused to report to a black boss.Footnote 23 Even in West Virginia's relatively equitable coal mining industry, in which blacks had access to high-skilled machine-cutting jobs, black workers rarely attained a supervisory position.Footnote 24
Census records provide supporting evidence of occupational segregation by race.Footnote 25 As one illustration, Figure 2 depicts the fifteen most commonly held occupations among northern-born men with exactly an eighth grade education in 1950. Only three jobs—truck drivers, mechanics, and clerical workers—employ a sizeable share of men of both races. Black men are most likely to work in the stereotypical positions of janitor, cook, porter, and service worker, while white men hold three union posts (mine operatives, carpenters, and machinists), two supervisory positions (foremen and managers), and one position that requires interaction with the public (salesman).
COMMON OCCUPATIONS FOR NORTHERN-BORN MEN WITH EXACTLY EIGHT YEARS OF EDUCATION BY RACE, 1950
A FRAMEWORK FOR ESTIMATING THE EFFECT OF BLACK MIGRATION ON NORTHERN WAGES
Theoretical Framework
The historical record provides suggestive evidence that similarly skilled blacks and whites were not perfect substitutes in the northern labor market. The migration of black southerners may therefore have represented a larger competitive shock to existing black workers than to their white counterparts. This section uses a simple production function to demonstrate the conditions under which black in-migration from the South would have slowed relative black wage growth in the North. The rest of the article will use this framework, along with estimated elasticity parameters, to calculate the effect of migration on the wages of existing black workers.
The analysis is based on a Cobb-Douglas production function in which capital (K) and labor (L) are combined to produce output

Following Borjas and Ottaviano and Peri, I model labor as a composite of education groups (e), experience levels within education groups (x), and two racial groups (black and white) within each education-experience cell (r).Footnote 26 Each nested function exhibits constant elasticity of substitution (CES). The construction of the labor composite is detailed in the Theory Appendix.
This production function embeds a set of assumptions about the role of race in the northern labor market. First, as with any neoclassical production function, it is assumed that workers are paid the value of their marginal product. In this model, black workers may be paid less than whites with the same level of education and experience only because of discrimination in job assignment, not because of unequal pay for the performance of identical tasks. This assumption appears to be consistent with the historical evidence; available payroll data show that black and white men employed in the same job at the same firm were usually paid the same wage.Footnote 27 Of more concern is the assumption that the wages of workers in one skill group can only be affected by the labor supply in another group if the elasticity of substitution between these groups is high. In the presence of statistical discrimination, the arrival of low-skilled blacks from the South could harm the job prospects of all black workers, including those of high skill, if employers use a single category to form expectations about black workers.Footnote 28 Concerned that rural migrants would reflect poorly on existing black workers, northern black newspapers published cartoons and editorials admonishing migrants to arrive punctually at work and to dress appropriately.Footnote 29 In the presence of such widespread statistical discrimination, the wage effects estimated here would be a lower bound.
In a competitive equilibrium, we can recover the wages of men with education level e, experience x, and race r by differentiating equation 1 with respect to Lexr Footnote 30

Wages depend positively on the own education-, experience-, and race-specific productivity terms (θ) and negatively on own-group labor supply. The extent to which labor supply in adjacent groups reduces own-group wages is determined by the elasticities of substitution by education (δ), experience (η), and race (σ).
Equation 2 allows us to analyze the effect of black migration on the wages of white and black workers in the North.Footnote 31 Let's start with the case of white workers in the education-experience group e-x. A portion of the black migration flows directly into this skill group. Black migration into group e-x has the following effect on the wages of white workers in this cell

where sexr refers to the share of income earned by men in education-experience-race group e-x-r. Other migrants have the same amount of education but different experience levels, while still others are in different education groups. These arrivals further influence the wages of white works in e-x


Adding equations 3–5 across all skill groups contributing to the migration flow indicates the total effect of the migration on the wage of white workers in group e-x

Equation 6 demonstrates that white wages will fall with migrant entry into the group's own education level and education-experience cell (terms 2 and 3). As a counterweight, wages will rise with an increase in labor supply into skill cells that are complements in production (term 1). For the time being, I will maintain the assumption that capital completely adjusts with the new labor supply, in which case we can ignore the impact of this inflow on K or the capital-labor ratio. I will relax this assumption below.
The effect of black migration on the wages of black workers in skill group e-x is nearly identical to equation 6, but contains an additional term capturing the potentially imperfect elasticity of substitution between men of different races in the same skill group

In the case of perfect substitution, σ is equal to ∞ and black migration will have an equal effect on black and white wages in the same skill group. If σ is less than ∞, the arrival of new black workers will have a larger negative effect on existing black workers.
Equations 6 and 7 demonstrate the effect of an increase in black labor supply on the wages of white and black men in a specific skill cell (e-x). The effect on average black and white wages will be a weighted sum of these cell-specific effects. Black migration will have a larger effect on average black wages if: (1) the skill distributions of whites and blacks are sufficiently different, or (2) the elasticity of substitution by race (σ) is low, augmenting the effect of black migration on black wages within each skill cell.
Estimating Equation
Obtaining an unbiased estimate of the elasticity of substitution by race (σ) is central to understanding the effect of black migration on relative black wage growth in the North. A simple expression for σ can be found by taking the ratio of black to white wages in a skill group e-x from equation 2

The black-white wage gap in skill group e-x is a function of the ratio of black to white labor supply in that group and the ratio of the race-specific productivity terms. If blacks and whites are perfect substitutes (σ = ∞), the wage ratio will be invariant to relative supply. A positive coefficient on the relative supply term implies that black and white workers in the same skill are not used interchangeably in production (σ ≠ ∞).
I estimate a version of equation 8 by pooling data from four census years (1940–1970)

The regression contains fixed effects for education levels (e), work experience (x), and census year (τ), and all two-way interactions. The interactions (e ⋅ τ) and (x ⋅ τ) allow the returns to schooling and experience to change over time, and the interaction (e ⋅ x) allows experience profiles to differ by education. The implied elasticity of substitution (σ) is equal to –1/β. β is identified from changes in relative black-white labor supply within a skill group over time. These changes can occur with differential rates of either educational attainment or in-migration. In the empirical analysis, I will focus on changes driven by migration.
DATA AND DEFINITIONS
I construct a skill group-level data set from census samples compiled by the Integrated Public Use Microdata Series (IPUMS). The northern economy is partitioned into 40 skill cells in each year based on five education categories and eight experience intervals.Footnote 32 I define five levels of educational attainment: elementary school (0–5 years of schooling), middle school (6–9 years of schooling), high school attendees (10–11 years of schooling), high school graduates (12 years of schooling), and men with at least some college (13 or more years of schooling). I consider alternative divisions as a robustness exercise below.
Because the census does not collect information on work experience, I assign each individual a predicted level of work experience based on his age and years of completed schooling. I allow men to begin accruing labor market experience in the year after they leave school, but constrain the earliest age of labor market entry to be 13. Work experience is thus defined as [age – max{education + 6, 12}]. I consider individuals who, by this measure, have one to forty years of work experience and divide this group into five-year intervals (1 to 5 years, 6 to 10 years, et cetera).Footnote 33
The dependent variable in the estimating equation is the ratio of annual earnings for blacks and whites in a skill cell.Footnote 34 The earnings ratio is calculated only for northern-born men who are not enrolled in school, self-employed, or working part-time (fewer than 40 hours per week).Footnote 35 Including southern migrants in the earnings measure would lead to composition bias. Migrants contribute more toward average earnings in cells with higher in-migration rates. Because southern black migrants earned more than their northern-born counterparts, even upon first arrival in the North, including migrants in the earnings ratio would bias against finding negative wage effects of migration.Footnote 36
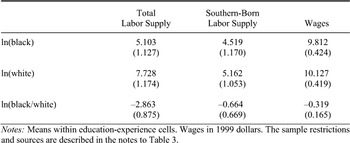
The key right-hand side variable in the estimating equation is the black-white labor supply ratio in a skill cell. Temporal variation in this ratio is driven by changes in skill levels across birth cohorts due either to migration from the South or to changes in the distribution of education among the northern-born.Footnote 37 Men are more likely to stay in school if they perceive high returns to doing so. As a result, educational upgrading across cohorts may be positively correlated with the race-specific productivity terms in equation 8. To avoid this source of bias, most of the article focuses on variation induced by migration flows. I discuss concerns with this source of variation in the next section. Southern migrants include all men who were born in a southern state and reside in the North.Footnote 38 For brevity, I often refer to a change in the number of black southerners in a skill cell as a “flow” of new black migrants, though this change could, in principle, be due to reverse migration to the South. Summary statistics for annual earnings and labor supply by skill group are presented in Appendix Table 1.
ESTIMATING THE ELASTICITY OF SUBSTITUTION BY RACE WITHIN SKILL GROUPS
Baseline Results: Skill Groups Defined by Education and Experience Level
Table 3 investigates the relationship between changes in the black-white wage gap and in the ratio of black to white migrant labor supply within skill cells. Every cell in the table reports the main coefficient from a different specification of equation 9 where the logarithm of black and white earnings (or their ratio) are regressed on the logarithm of black and white migrant labor supply. As the first row demonstrates, black wages fall both in absolute terms and relative to white wages in skill cells that experience a migration-induced increase in relative black
RELATIVE BLACK LABOR SUPPLY AND THE BLACK-WHITE WAGE GAP IN THE NORTH, 1940–1970

Notes:
N = 156. In Panel A, each cell contains a coefficient from a separate OLS regression of the logarithm of black or white wages (or their ratio) on the logarithms of black and white migrant labor supply (or their ratio) by skill group over time. Standard errors are presented in parentheses and are clustered by skill group. The labor supply count includes southern-born men working in the North between the ages of 18–64 who are not living in group quarters, in the armed forces, or in the farm sector. Annual earnings are calculated for northern-born men who, in addition to the sample restrictions above, are not enrolled in school, self-employed, or working part-time. Skill groups are defined by five education categories and eight experience intervals. Observations are weighted by the number of northern-born men used to calculate mean annual earnings. Panel B presents coefficients from IV regressions. The instrument for black (white) migrant flow is the national stock of southern-born men by race in the skill group living either in the North or the South. First-stage results are reported in Table 4. In the final column, the black-white wage ratio is regressed on the total black-white ratio of labor supply. In Panel A, the migrant labor supply ratio is used as an instrument for total labor supply ratio. The first-stage coefficient is 0.645 (s.e. = 0.110). In Panel B, the ratio of the national stocks of southern-born men by race is used as an instrument for the total labor supply ratio.
Source:
Ruggles et al., Integrated Public Use Microdata Series.
labor supply.Footnote 39 The coefficient in the first column implies an elasticity of substitution by race within skill group of 8.3 (= 1/0.120). In the next two rows, I split the labor supply ratio in two and separately enter the levels of black and white migration. The wages of northern-born black men fall when black southerners in their skill cell move North, but increase slightly with white southern in-migration. On the other hand, an increase of either black or white labor supply reduces the wages of white workers to an equal degree. Interestingly, foreign-born whites appear to be much more easily substituted for black workers in their skill group than are native-born whites. We cannot reject the possibility of perfect substitutability between blacks and foreign-born whites (estimated elasticity = 16.4). In contrast, the elasticity between native-born whites and blacks is 7.9 and statistically different from zero.Footnote 40
Estimating the relationship between the black-white wage gap and the full labor-supply ratio, rather than the ratio of migrant labor supply, produces a coefficient that is only half as large and is not statistically significant (not shown). However, educational improvements across cohorts will bias the estimate upward—that is, towards zero—if men invest in education when (expected) wage offers are high. Column 4 uses migration-induced changes to instrument for all changes in labor supply. The implied elasticity of substitution is similar to the earlier results obtained from entering the migrant labor supply ratio directly. We can think of the main OLS equation as the reduced form of this two-stage least squares estimation process.
Southerners might choose to migrate when northern wages in their race-by-skill cell are high. In this case, migration flows will be correlated with unobserved race-specific productivity terms and OLS coefficients will be biased upward (see equation 8). A possible solution is to instrument for black and white migrant flows using the stock of southern-born men by race in a skill cell. The stock of southern-born men includes both men who chose to migrate North and men who chose to remain in the South.Footnote 41 The validity of this instrument rests on the assumption that neither demographic patterns nor educational upgrading in the South—two factors that affect the stock of southern-born men in each skill cell—are influenced by northern wages. This assumption may be violated if southerners consider the option of migrating to the North when making their human capital decisions. However, education decisions occur early in life. While these decisions are forward looking, it is unlikely that southerners would have been able to predict race-specific wage patterns in the North 20 or 30 years into the future.
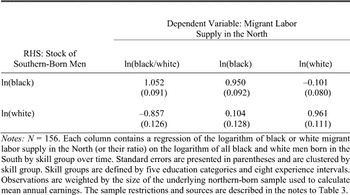
Table 4 presents a set of first stage results in which the national stock of southern-born men in a skill cell is used to predict the flow of
FIRST STAGE RESULTS: PREDICTING THE FLOW OF NEW SOUTHERN MIGRANTS TO THE NORTH USING THE NATIONAL STOCK OF SOUTHERN-BORN MEN WITHIN SKILL CELLS, 1940–1970

Notes:
N = 156. Each column contains a regression of the logarithm of black or white migrant labor supply in the North (or their ratio) on the logarithm of all black and white men born in the South by skill group over time. Standard errors are presented in parentheses and are clustered by skill group. Skill groups are defined by five education categories and eight experience intervals. Observations are weighted by the size of the underlying northern-born sample used to calculate mean annual earnings. The sample restrictions and sources are described in the notes to Table 3.
southern migrants to the North. The first-stage regressions include the full set of dummy variables contained in the second stage. Not surprisingly, the stock of black southerners in a cell strongly predicts the southern black migrant flow into that cell in the North and the stock of white southerners predicts the white migrant flow; neither stock is significantly associated with the migration patterns of men of the opposite race.
The second panel of Table 3 contains second stage coefficients from an IV regression that instruments for the migrant flows with the southern-born stocks. The qualitative pattern in the IV regressions is similar to OLS, but the standard errors increase. As a result, the effect of relative labor supply on black wages and the black-white wage gap is no longer significant. However, in comparing the point estimates, there is no evidence that the OLS coefficients are biased downward by endogenous relocation. If the migrant flow into a skill cell increases when race-specific productivity (wages) are high, we would expect the IV coefficients to be larger in absolute value than their OLS counterparts. If anything, they are a little bit smaller. It is important to keep in mind that the migration decision entails a comparison of relative wages in the source and destination regions. Periods of increasing labor demand for black workers in the North could coincide with even larger increases in race-specific labor demand in the South.Footnote 42
Accounting for Imperfect Substitution: Discrimination versus Unobserved Skill
Thus far, the results suggest that blacks and whites with the same years of schooling and work experience were not used interchangeably in production in the postwar North. This lack of interchangeability could be due to discrimination in job assignment or to differences in unobserved skill, perhaps due to disparities in school quality. Derek A. Neal and William R. Johnson document that black men score well below white men with identical years of reported schooling on standardized tests, suggesting that years of education is not a sufficient measure of skill.Footnote 43 Some of this test score gap could be due to the lower quality of schools attended by the typical black student. De jure black schools in the South provided substantially fewer resources per pupil. As a result, black schools had higher pupil-teacher ratios and shorter-term lengths.Footnote 44 Other aspects of school quality, including the quality of teachers and peers, surely differed as well but remain unobserved.
To disentangle discrimination from differences in unobserved skill, I adjust years of schooling for differences in school quality and reestimate the elasticity of substitution within these more precisely defined skill groups. I focus on differences in the length of the school term because, while the literature is unequivocal that time spent in school earns a market return, it is mixed on the value added of small class sizes.Footnote 45 Using data on average term length by race, state of birth, and birth cohort, I convert years of completed schooling into likely days spent in the classroom.Footnote 46 I replace year-based education categories with day-based equivalents according to an 180-day school term. For example, the lowest education group translates into 900 or fewer days of likely school attendance, rather than five or fewer years of educational attainment.
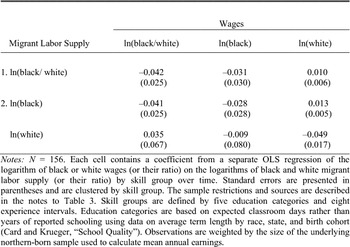
Table 5 reestimates the main results using these adjusted skill groups. The magnitude of the point estimates falls by two-thirds in this setting. The implied elasticity of substitution by race within skill cells is high (23.8 = 1/.042), but remains significantly different from perfect substitutability (that is, we can reject that β = 0). The qualitative
RELATIVE BLACK LABOR SUPPLY AND THE BLACK-WHITE WAGE GAP IN THE NORTH WITH EDUCATION LEVELS ADJUSTED FOR TERM LENGTH, 1940–1970

Notes:
N = 156. each cell contains a coefficient from a separate OLS regression of the logarithm of black or white wages (or their ratio) on the logarithms of black and white migrant labor supply (or their ratio) by skill group over time. Standard errors are presented in parentheses and are clustered by skill group. The sample restrictions and sources are described in the notes to Table 3. Skill groups are defined by five education categories and eight experience intervals. Education categories are based on expected classroom days rather than years of reported schooling using data on average term length by race, state, and birth cohort (Card and Krueger, “School Quality”). Observations are weighted by the size of the underlying northern-born sample used to calculate mean annual earnings.
patterns are similar to the results using the unadjusted skill groups. As before, black wages fall with an increase in black labor supply but are unaffected by changes in white labor supply. White wages are now sensitive only to white labor supply. One interpretation of this finding is that two-thirds of the estimated imperfect substitutability by race in Table 3 is driven by differences in the quality of education attained by blacks and whites, while the remaining one third is due to discrimination in job assignment for men with otherwise identical skill.Footnote 47 With better measures of school quality, the share of the imperfect substitution that can be attributed to discrimination may fall even further.
COUNTERFACTUAL RATES OF BLACK-WHITE WAGE CONVERGENCE
The theoretical framework illustrates how an influx of black workers could affect northern wages within the context of a neoclassical production function. According to the model, black migration would have had a larger effect on black wages if black and white workers occupied different portions of the skill distribution or if the elasticity of substitution within skill groups by race was low. In this section, I calculate counterfactual levels of wage convergence in the North within this framework. If there had been no new black migration to the North after 1940, would the wages of northern black workers have increased at a faster rate?
Equations 6 and 7 detail how the wages of white and black workers change following a percentage change in black labor supply. The magnitude of these changes depend on the size of the labor supply shift due to black migration (ΔLexb/Lexb); income shares for black workers by skill group (sexb); and three elasticity estimates (δ, η, and σ). The first two components can be calculated directly from census data. The elasticity of substitution by race within skill group (σ) was estimated in the previous section. Estimates of δ and η can be obtained by aggregating the workforce into education-experience groups or education categories alone and estimating the wage response to an increase in own-group labor supply over time. The resulting coefficients, which are based on data from 1940 to 1970, are 0.192 (s.e. = 0.044) and 0.266 (s.e. = 0.138). The elasticity of substitution implied by these coefficients is 5.20 across experience levels and 3.75 across education groups. Comparing these results with Borjas' more recent estimates of 3.47 and 1.35 suggests that there was a greater scope for substitution across skill categories in the mid-twentieth century.Footnote 48
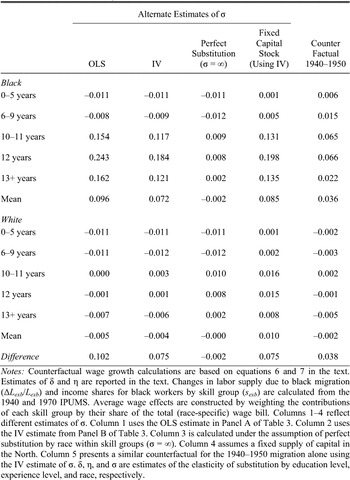
In the counterfactual scenario, the northern black labor force is only allowed to grow through natural increase. The black migration flow into every skill group is set to zero. The percentage increase or decrease in average wages from 1940 to 1970 under this scenario (relative to their actual levels) are reported in Table 6. Wage effects are aggregated into five education categories by race. A positive sign indicates that wages would have been higher if not for the black migration flow.
The wage effects in the first two columns are calculated using the OLS and IV estimates of σ respectively (Table 3). In both cases, limiting southern black migration would have had large positive effects on black wages, particularly for blacks with ten or more years of education. The lowest education groups already faced a large supply of black southerners from the first, World War I-based wave of migration. The flow of new migrants from 1940 to 1970 was only large
COUNTERFACTUAL WAGE INCREASE FOR BLACK MEN UNDER A “NO SOUTHERN MIGRATION” SCENARIO, BY EDUCATION CATEGORY FOR 1940 THROUGH 1970

Notes:
Counterfactual wage growth calculations are based on equations 6 and 7 in the text. Estimates of δ and η are reported in the text. Changes in labor supply due to black migration (ΔLexb/Lexb) and income shares for black workers by skill group (sexb) are calculated from the 1940 and 1970 IPUMS. Average wage effects are constructed by weighting the contributions of each skill group by their share of the total (race-specific) wage bill. Columns 1–4 reflect different estimates of σ. Column 1 uses the OLS estimate in Panel A of Table 3. Column 2 uses the IV estimate from Panel B of Table 3. Column 3 is calculated under the assumption of perfect substitution by race within skill groups (σ = ∞). Column 4 assumes a fixed supply of capital in the North. Column 5 presents a similar counterfactual for the 1940–1950 migration alone using the IV estimate of σ. δ, η, and σ are estimates of the elasticity of substitution by education level, experience level, and race, respectively.
enough to replace the preexisting stock (Table 2). As a result, for low-skilled workers, the dominant effect of the migration was to increase complementary factors, thus increasing wages slightly (by around 1 percent). In contrast, while there were few southern blacks among the high school attendees and graduates in the northern labor force in 1940, the stock of southern blacks in these education groups tripled by 1970 (Table 2). On average, I calculate that, if not for the ongoing southern migration, average black wages in the North would have been 7.2 to 9.6 percent higher by 1970. The distribution of wage effects is more uniform when focusing on the migrant flow in the 1940s (column 5). Over this decade, a larger share of the new arrivals entered the lowest education groups. Therefore, forestalling migration in this period would have buoyed the wages of black elementary and middle school attendees as well.
The second panel of Table 6 demonstrates that black migration had essentially no effect on white wages. Black migration simply did not represent a large enough increase in total northern labor supply to greatly influence white wages. Taken together, we can conclude that, absent migration, black workers would have experienced an additional 7 to 10 percent increase in wages relative to white workers. The foregone wage convergence in the North due to migration is large relative to actual wage growth. In 1940 northern blacks earned 45 percent less than northern whites (Table 1). Over the next thirty years, this gap declined by 15 log points. A 7 to 10 percent increase in black wages (absent migration) would have translated into an additional 5 to 7 percentage point reduction in the black-white wage gap.Footnote 49
The next two columns in Table 6 examine the impact of black migration on northern wages under two alternative sets of assumptions. Column 3 recalculates the wage effects under the assumption that black and white workers are perfect substitutes within skill groups (β = 0 or σ = ∞). While, in theory, black migration may still have had a larger effect on existing black workers due to differences in skill distributions by race, I do not find this to be the case. Instead, ending black migration would have increased the wages of high school attendees and graduates of both races by around 1 percent and decreased the wages of less-educated men by an equivalent amount. These two effects would have offset one another, and so black migration would have had little effect on the average wages of men of either race in this scenario.
The fourth column of Table 6 relaxes the assumption that capital adjusts perfectly to the expansion of the northern labor force. Instead, I assume that capital remains unchanged even as the labor supply increases, resulting in a reduction in the capital-labor ratio and an associated decline in wages for all skill groups. This channel can be expressed as –(1–α) ΣiΣj(sijbΔLijb/Lijb), where α is share of income earned by the labor aggregate. For α = 0.7, the 4.5 percent increase in the total northern labor supply due to black migration would lead to an additional 1.3 percent decline in wages for all groups. As a result, black wages fall by 8.5 percent (rather than 7.2 percent) and white wages fall by 1.0 percent (column 4). Whether one prefers the estimates in columns 2 or 4 depends on how responsive one believes capital to be.Footnote 50 However, the choice between an elastic or inelastic capital stock has no effect on the wage convergence results because capital adjustment would have an equal effect on both black and white wages.
CONCLUSION
Writing in the 1920s, W. E. B. Du Bois warned that the impending migration of a “great reservoir of [southern black] labor” to the North would generate competition for existing black workers in both the labor and housing markets.Footnote 51 The 1940s ushered in an era of interregional migration at levels that Du Bois could have hardly foreseen, driven in part by a wartime boom in northern industry. Between 1940 and 1970 southern migrants more than doubled the black labor supply above the Mason-Dixon Line. New black arrivals reduced the wages of existing black workers in the North but had no effect on average white wages. I estimate that northern black wages would have grown by an additional 7 to 10 percent in the absence of southern migration. This finding modifies the current view of the Great Black Migration as a general avenue for black economic advancement. While migration was an important step in the alleviation of black rural poverty, it was also impediment to black wage growth in the urban North.
Beyond competition in the labor market, an influx of southern migrants may have generated other externalities for the northern black community. Prices and rents may have increased in black neighborhoods, schools may have overcrowded, and the level of parental education in the student body may have declined. On the other hand, migration may have amplified black political power in northern cities and, more speculatively, may have hastened the Civil Rights movement by recasting the “negro problem” as national—rather than simply a southern—concern.Footnote 52 A more complete assessment of the effect of black migration on the northern economy awaits further research.
While this article has focused on the black migration, competition between new and established migrants may have been a more general phenomenon in twentieth-century cities. As this article illustrates, the extent of competition between new and established migrants depends on the specificity (or generality) of skills held by a particular ethnic group and the presence (or absence) of discriminatory barriers. One implication of this framework—which remains to be tested—is that, ironically, first and second generation European immigrants may have benefited from the strict immigration quotas established in the 1920s.
Theory Appendix
The theoretical framework presents a Cobb-Douglas production function in which capital and a labor composite combine to produce output. This appendix describes the labor composite in more detail. I model the labor composite as a nested set of functions, each of which exhibit constant elasticity of substitution (CES). The layers of the labor composite include education groups (e), experience levels within each education group (x), and two racial groups (black and white) within each education-experience cell (r).
Total labor supply can be written as an aggregation of the contributions from each education group (Le)

The θe terms are technology parameters that shift the relative productivity of education groups (normalized to sum to one). The variable δ > 0 denotes the elasticity of substitution between workers with different levels of educational attainment.
In turn, the labor supply of each education group is a combination of the contributions of workers with different levels of experience

η measures the elasticity of substitution across experience levels within an education category. It is likely that workers are closer substitutes within education categories than across them; in this case, we expect η > δ.
SUMMARY STATISTICS FOR MEN IN THE NORTHERN LABOR FORCE, 1940–1970

Notes:
Means within education-experience cells. Wages in 1999 dollars. The sample restrictions and sources are described in the notes to Table 3.
Finally, I allow black and white workers in the same skill group to be imperfect substitutes, perhaps due to discrimination in the labor market. The labor supply within an education-experience cell combines the contributions of black and white workers

The θexr terms (r = w, b) are race-specific productivity parameters and σ is the elasticity of substitution between black and white men in the same skill cell. Appendix Table 1 gives summary statistics for annual earning and labor supply by skill group.