Introduction
Obesity is becoming an increasing public health challenge globally. It reduces life expectancy and increases the risk of many systemic diseases.
Obesity may be associated with increased tissue bulk in the aerodigestive tract, neck and chest wall. Obese individuals have been demonstrated to have a narrowed aerodigestive tract, including the hypopharynx, oropharynx, nasopharynx and nasal cavities.Reference Hora, Nápolis, Daltro, Kodaira, Tufik and Togeiro1, Reference Tagaya, Nakata, Yasuma, Noda, Morinaga and Yagi2 The reduced diameter of the aerodigestive tract is due to thick lateral pharyngeal walls, medialised tonsillar pillars, and an elongated and flaccid velum.Reference Tagaya, Nakata, Yasuma, Noda, Morinaga and Yagi2
Voice production has three components: exhalation of air from the lungs (which supplies the power for phonation), vibration of the vocal folds (enabling sound creation), and modification of this sound via resonating cavities (e.g. the pharynx and oral and nasal cavities). Obesity could be expected to influence each of these components and thereby impair voice production. Obesity can alter the size and configuration of the aerodigestive tract, and tissue bulk in the vocal folds may vary with changes in overall body weight. Furthermore, obesity may impair pulmonary function and vocal quality as a result of increased adiposity around the ribs, abdomen and viscera.Reference Salome, King and Berend3
Two studies have previously investigated the effects of obesity on voice quality, but found conflicting results. Da Cunha et al. Reference da Cunha, Passerotti, Weber, Zilberstein and Cecconello4 evaluated the voices of obese patients (i.e. a body mass index greater than 35 kg/m2) using perceptual and acoustic methods. They detected the following modifications in voice: hoarseness, murmuring, vocal instability, altered jitter and shimmer, and reduced maximum phonation times, as well as the presence of voice strangulation at the end of emission.Reference da Cunha, Passerotti, Weber, Zilberstein and Cecconello4 In contrast, Solomon et al. Reference Solomon, Helou, Dietrich-Burns and Stojadinovic5 examined the effect of obesity and weight loss on vocal function after bariatric surgical procedures, and found no significant differences between groups either at pre-operative assessment or over time.
Therefore, the present study aimed to evaluate several objective and subjective voice parameters in order to further characterise the vocal quality and function of obese individuals, and to compare results with those of non-obese individuals.
Materials and methods
Twenty adult volunteers (8 men and 12 women), ranging in age from 27 to 49 years (mean age, 38.8 years) and with a body mass index greater than 35 kg/m2 (range, 35–43.9 kg/m2; mean, 37.6 kg/m2) were included in the study, and constituted the obese group. The control group consisted of 20 age- and sex-matched, healthy volunteers with a body mass index below 30 kg/m2.
Participants were asked to complete a questionnaire enquiring about the following: general health status, history of voice or speech training or singing lessons, and daily vocal activity.
The following criteria led to exclusion from the study: reported history of speech or voice disorders, history of laryngeal surgery, or prior history of pulmonary or neurological disease.
All participants consented to participate in this research project. The study protocol was reviewed and approved by the Gaziosmanpaşa University Ethics Committee.
All of the participants underwent voice evaluation via laryngoscopic examination, acoustic analysis, aerodynamic measurement and perceptual analysis. All participants received the same voice evaluations at the same voice laboratory.
For acoustic assessment, a microphone was placed 5 cm from the mouth and the subject was asked to phonate and sustain the vowel /a/ at the most comfortable pitch and loudness. Digitally recorded data were transferred to a computer at a sampling rate of 44.1 kHz. The middle 2-second portion extracted from each sustained /a/ phonation was analysed acoustically. Acoustic analyses were performed using the Praat program (a simple computer program measuring various aspects of the voice; Amsterdam, The Netherlands), and included assessment of fundamental frequency, intensity, jitter (relative average perturbation), shimmer (amplitude perturbation quotient) and harmonic to noise ratio.Reference Boersma6
For perceptual evaluation, participants were asked to read a text passage (the first paragraph of the diyet passage, commonly used in Turkey for perceptual voice evaluation) at a comfortable pitch and loudness. The grade-roughness-breathiness-asthenia-strain (‘GRBAS') scale was used to score the named subjective voice properties, from the subject's recorded voice. These properties were rated by a panel of four listeners, using the following points scheme: 0 = normal, 1 = mild, 2 = moderate and 3 = severe voice disorder. During evaluation, all listeners were blinded as to the speaker's group. The listeners were experienced in perceptual voice assessment. For each subject assessment, a group consensus was achieved, with the agreement of at least three members being required for the final result. This method aimed to minimise inter-observer variability.
For the subsequent stage of perceptual evaluation, subjects assessed their own voice using the Voice Handicap Index 10. This index includes 10 items on the impact of voice disorder on daily life. The scores range from 0 to 4 depending on the frequency of the problem: 0 = never, 1 = almost never, 2 = sometimes, 3 = almost always and 4 = always.
For aerodynamic assessment, maximum phonation time was determined by measuring the duration of the /a/ vowel following maximum inspiration. Maximum phonation time was elicited over three trials, the longest of which was considered definitive. Maximum phonation time was expected to be longer in professional voice users than non-professionals; therefore, in order to avoid any biased increase in maximum phonation time, control subjects were recruited from non-professional voice users. Subsequently, all subjects were asked to phonate /s/ and /z/ for as long as possible, after a deep inspiration. This procedure was repeated three times, and the measurement with the longest duration was recorded as the s/z ratio.
Statistical analysis was performed using the SPSS 18.0.0 software program (SPSS Inc, Chicago, Illinois, USA). The Mann–Whitney U test was used to analyse the differences between obese and control subjects. Statistical significance was assumed at p values of less than 0.05.
Results and analysis
The laryngoscopic examination was within normal limits in all participants.
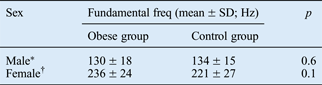
The average fundamental frequency is normally lower in men than women; therefore, a comparison was made between male subjects and between female subjects. Except for fundamental frequency, all other parameters were compared between groups regardless of gender. There was no difference in mean fundamental frequency between the obese and control groups, in either males or females (p = 0.6 and p = 0.1, respectively) (Table I).
Fundamental frequency

*n = 8; †n = 12. Freq = frequency; SD = standard deviation
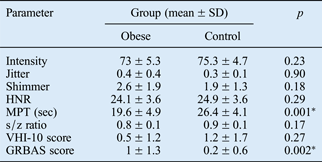
Results for the other acoustic analysis parameters, aerodynamic analysis parameters and perceptual ratings are shown in Table II. There was no statistically significant difference in intensity, perturbation parameters (jitter and shimmer) or harmonic to noise ratio between the two groups (p > 0.05). The mean maximum phonation time in the obese group (mean ± standard deviation (SD), 19.6 ± 4.9 seconds) was significantly shorter than that in the control group (26.4 ± 4.1 seconds) (p < 0.001), while the mean s/z ratio was very similar in the obese group (0.8 ± 0.1) and the control group (0.9 ± 0.1) (Table II).
Acoustic, aerodynamic and perceptual evaluation
*p < 0.05. SD = standard deviation; HNR = harmonic to noise ratio; MPT = maximum phonation time; VHI-10 = Voice Handicap Index 10; GRBAS = grade-roughness-breathiness-asthenia-strain scale
On perceptual evaluation using the grade-roughness-breathiness-asthenia-strain scale, the mean score ± SD was 1 ± 1.3 in the obese group and 0.2 ± 0.6 in the control group; this difference was statistically significant (p = 0.002).
There was no statistically significant difference in subjects' self-assessed perceptual evaluation scores: the mean Voice Handicap Index 10 score ± SD was 0.5 ± 1.2 in the obese group and 1.2 ± 1.7 in the control group (p = 0.27) (Table II).
Discussion
This study examined vocal quality and function in obese and non-obese individuals. Statistically significant differences emerged for clinician-based perceptual voice evaluation and aerodynamic voice analysis. However, no significant differences were found for acoustic analysis or patient self-assessed perceptual voice evaluation.
With regard to clinician-based perceptual assessment (using the grade-roughness-breathiness-asthenia-strain scale), vocal quality in the obese group was significantly altered in comparison with the control group.
Similar results were reported by da Cunha et al. Reference da Cunha, Passerotti, Weber, Zilberstein and Cecconello4 who characterised obese patients' voices as hoarse, breathy and unstable. They believed that these vocal characteristics were due to reduced phonation time, which provoked irregular vibration of the vocal folds owing to reduced subglottic pressure.
In contrast, Solomon et al. Reference Solomon, Helou, Dietrich-Burns and Stojadinovic5 reported that all their subjects' perceptual rating scores indicated normal voice characteristics, with no significant differences between the obese and non-obese groups. Our results for patients' self-assessed perceptual voice evaluation (using the Voice Handicap Index 10 tool) are in accordance with Solomon and colleagues' data: there was no difference between obese and non-obese participants.
Maximum phonation time represents glottic efficiency with regard to breathing. Da Cunha et al. Reference da Cunha, Passerotti, Weber, Zilberstein and Cecconello4 reported that individuals suffering from morbid obesity displayed very low maximum phonation time values compared with non-obese subjects. In our study, maximum phonation time was significantly shorter in the obese group; this would appear to be related to the accumulation of excessive fat around the ribs, abdomen and viscera. This increased adiposity influences respiratory function and decreases maximum phonation time. Furthermore, it appears that the amount of subglottic pressure required to move the vocal folds into oscillation is greater when participants are highly obese, and decreases to some extent as they lose weight.Reference Solomon, Helou, Dietrich-Burns and Stojadinovic5
• This study evaluated perceptual, acoustic and aerodynamic voice parameters in obese subjects
• Laryngoscopy, acoustic analysis, aerodynamic measurements and perceptual analysis were used
• Obese subjects had poorer clinician-assessed perceptual vocal quality and reduced maximum phonation time
• Results for acoustic analysis and self-assessed perceptual analysis did not differ from controls
Acoustic analysis is an objective method for the evaluation of several voice parameters, including jitter, shimmer and harmonic to noise ratio. Da Cunha et al. Reference da Cunha, Passerotti, Weber, Zilberstein and Cecconello4 hypothesised that obese individuals' voices are more aperiodic than non-obese individuals' voices, as jitter and shimmer were increased and harmonic to noise ratio was decreased in the former group in their study.Reference da Cunha, Passerotti, Weber, Zilberstein and Cecconello4 Our results do not support this hypothesis, as none of our subjects' acoustic analysis parameters were altered. Solomon et al. Reference Solomon, Helou, Dietrich-Burns and Stojadinovic5 examined obese patients before and six months after bariatric surgery, and also compared them with non-obese subjects. They reported similar results to ours: acoustic analysis parameters were within normal limits in both non-obese and obese participants, both pre-operatively and after bariatric surgery.Reference Solomon, Helou, Dietrich-Burns and Stojadinovic5
Conclusion
This study found that obese individuals' voices were of poorer quality, with reduced maximum phonation time and poorer clinician-based perceptual assessment scores (using the grade-roughness-breathiness-asthenia-strain scale).
Although we expected to find that obese subjects had altered acoustic analysis parameters and self-assessed perceptual voice evaluation scores (using the Voice Handicap Index 10), no significant differences were observed.
Our results lie midway between those of two previously published reports, the first of which found alterations in almost all objective and subjective voice parameters in obese individuals, compared with non-obese individuals, and the second of which found no alteration in any parameter.
The present study findings suggest that obese individuals possess perceptually different voices compared with non-obese individuals; however, these perceptual differences were not supported by the results of objective assessment (e.g. acoustic analysis).