I. INTRODUCTION
Magnesium alloys are replacing aluminum alloys as construction materials in many applications, particularly in the aerospace, aircraft, and automotive industries due to comparable strength and price, but lower density. Magnesium alloys with rare earth (RE) metals are quite interesting for scientific investigations because of their good mechanical properties.Reference Ogarevic and Stephens1–Reference He4 It has been reported that the recently developed Mg–Gd–Y–Zr magnesium alloys showed considerable precipitation strengthening, leading to improved specific strength at both room and elevated temperatures, and better creep resistant than conventional Al and Mg alloys.Reference He, Zeng, Peng, Gao, Nie and Ding5–Reference Janik, Yin, Wang, He, Chen, Chen and Boehlert7
Thanks to the high performance of Mg–Gd–Y–Zr magnesium alloys, much attention is paid to produce complicated structures by these alloys in a sand mold. Different parts of a casting may receive different chemical compositions, heat treatments, and microstructures during cooling especially for the large scale castings whose size is up to meters, which can affect the tensile strength and fatigue strength.Reference Ogarevic and Stephens1,Reference Lu, Taheri and Gharghouri8 In consideration of the safety and reliability, the fatigue properties of different regions of these castings need to be studied.
HorstemeyerReference Horstemeyer9 studied the high cycle fatigue properties of a die cast AZ91E-T4 magnesium alloy. Specimens from different locations were tested. It is indicated that the dimensions of the casting dictated the total cooling rate, which in turn produced a geometry dependent dendrite cell size and porosity level. Therefore, different locations showed varied fatigue behavior. Lu et al.Reference Lu, Taheri and Gharghouri8,Reference Lu, Taheri, Gharghouri and Han10 investigated the fatigue behaviors of different regions of a cast instrument panel made from AM60B magnesium alloy to illustrate the effect of microstructure and casting defects on the resultant fatigue properties, and they found that different regions showed varied fatigue strength.
The present work is conducted to better understand the tensile properties and high cycle fatigue behaviors of different regions in a low-pressure sand-cast Mg–10Gd–3Y–0.5Zr (GW103K) alloy component with large scale and complicated structure.
II. EXPERIMENTAL DETAILS
A. Materials
The materials used in this study were cut from a low-pressure sand-cast GW103K magnesium alloy component. The casting was produced by melting pure Mg, Mg–Gd, Mg–Gd–Y, and Mg–Zr master alloys. The details of the casting process were as follows. First, magnesium alloy was melted in a high-frequency induction furnace with appropriate MF magnesium covering flux. Then Mg–Gd and Mg–Gd–Y master alloys were added through the covering flux when the furnace temperature was up to 730–750 °C. The master alloys were completely melted at ∼780 °C for ∼30 min. The preheated Mg–Zr master alloy was added at ∼800 °C. The MJ refining agent for magnesium alloy was added when the temperature decreased to ∼760 °C. The slag was cleaned out after 4–6 min stirring. The molten metal was heated to ∼780 °C again after adding some MF flux. The molten metal was cast into the prepared sand mold by low-pressure casting after holding for ∼30 min. The mold was well designed with reasonable sprue runners, ingates, and overflow canals, and chill blocks were also used in the right place. The details of the casting shape were highly confidential, and an extremely simplified illustration was given in this study, as shown in Fig. 1. The actual chemical compositions of the alloy were determined by an inductively coupled plasma analyzer (ICP; Plasma-400, Perkin Elmer Inc., Waltham, MA), and the results are listed in Table I. To accurately map the local tensile properties and fatigue behavior of the casting, coupons were extracted from various regions of the complexly shaped and large scale casting. The casting was divided into 8 regions, marked as B1 to B4 and C1 to C4, based on their applications and the casting features such as turbulent flow, distance from the ingate and which were filled first or last. Then the materials were first solutionized at 525 °C for 12 h, cooled in the air and then aged at 250 °C for 10 h (designated as T6 heat treatment). Tensile properties of all the regions were examined, and the fatigue properties of three regions (B2, B3, C1) were carefully studied based on their application purpose, tensile properties, and the residual materials.
Simplified illustration of the sand casting.

Chemical composition in wt% determined by ICP.

B. Experimental procedures
The microstructures of specimens were examined with an optical microscope (OM) and quantified in terms of grain size. Specimens for microstructure analysis were polished and then etched in 4 vol% natal. The average grain size was measured using a linear intercept method in the OM and at least 400 grain boundaries were counted for each sample.
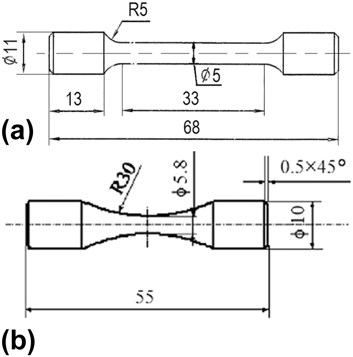
Tensile properties of the tested alloys were performed at a rate of 1 mm/min referred to the standard of ASTM: E8M-13a using cylindrical specimen with marked dimensions of 33 mm gage length and 5 mm diameter [Fig. 2(a)] on Zwick/Roell Z020 tensile machine (Zwick Roell Group, Ulm, Germany) at room temperature.
Shape and size of samples: (a) cylindrical tensile specimen, (b) hour-glass shaped round fatigue specimen.
Hour-glass shaped round specimens [Fig. 2(b)] were used for high cycle fatigue testing, and the dimensions of the specimens were as per the ASTM: E466-07 standard with a gage diameter of 5.8 mm. After machining, a layer with thickness of ∼100 μm was removed from the surface of the specimens by polishing to avoid the influence of machining on the fatigue results. Fatigue tests were performed under rotating bend loading (R = −1) at a frequency of about 100 Hz. The tests were conducted at room temperature in laboratory air. The stress-controlled fatigue testing was adopted to estimate the fatigue strength at a given number (107 cycles) of cycle-to-failure. 12 to 15 specimens were used for each group test in the present study.
The fracture surface of the tensile and fatigue specimens was investigated by scanning electron microscopy (SEM, Philips 505, Holland). Fatigue crack initiation and propagation behaviors during high cycle fatigue were investigated by observing the fracture surface of the specimen with SEM and OM.
III. RESULTS
A. Microstructure and mechanical properties
Figure 3 shows the microstructures of GW103K magnesium alloy in cast and T6 conditions. As can be seen from Fig. 3(a), the microstructure of the cast GW103K consists of equiaxed α-Mg matrix and network eutectic compounds which distribute along grain boundaries. It indicates that the cast GW103K magnesium alloy mainly consists of α-Mg solid solution and Mg24(Gd,Y)5 phase.Reference He, Zeng, Peng, Guo, Chang and Ding6
Microstructures of GW103K alloy in (a) cast and (b) T6 conditions.
After T6 heat treatment, the eutectic phases have almost dissolved into the matrix as shown in Fig. 3(b). Some unevenly distributed small granular black dots are observed along the grain boundaries and within the grains. These dots are cluster remnant secondary phase and small cube-shaped phase (γ phase) which is a compound with high RE elements content with a size of 2–5 μm. Besides, some Zr cores are also observed inner the grain of T6 treated alloy. According to Ref. Reference He, Zeng, Peng, Guo, Chang and Ding6, the microstructure of the T6 treated alloy mainly consists of α-Mg, γ, and β′ (Mg5(Gd,Y) precipitates). The average grain sizes of the different regions in the T6 treated GW103K magnesium alloy are shown in Table II. It indicates that the average grain sizes of different regions are almost the same.
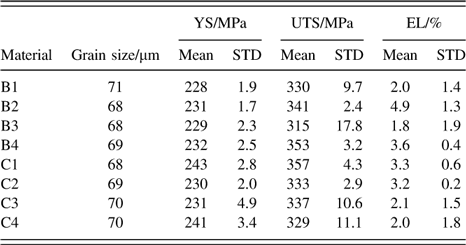
Average grain size and tensile properties of different regions.
STD refers to the standard deviation from the mean value.
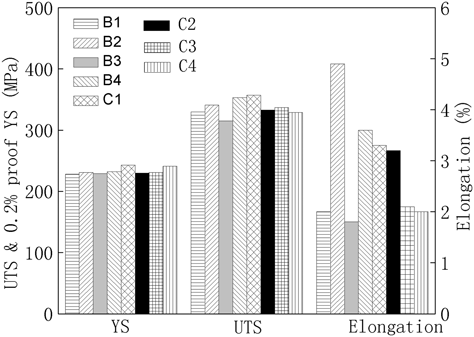
The tensile properties of all the regions are also listed in Table II, and Fig. 4 gives a presentation of the mean tensile properties of the tested regions. Some samples fracture when the stresses are just over the yield strength, and their elongations are less than 1.3% or even less than 1% in Regions B1, B3, C3, and C4, especially in Region B3. The data of these samples lead to large deviation of the tensile properties. As can be seen from Table II, the yield strength (YS), ultimate tensile strength (UTS), and elongation (EL) vary with the different regions. The YS varies from 228 to 243 MPa, and the UTS of Region C1 is up to 357 MPa while that of Region C2 is only 315 MPa. Region B2 shows the best ductility and the EL is up to 4.9%, while the EL of Region B1 is less than 2.0%. It is indicated that the UTS and EL are more sensitive to the inclusions than the YS from the tensile properties, especially for the brittle fractured specimens that fracture quickly after yield.
Mean tensile properties of the tested regions.
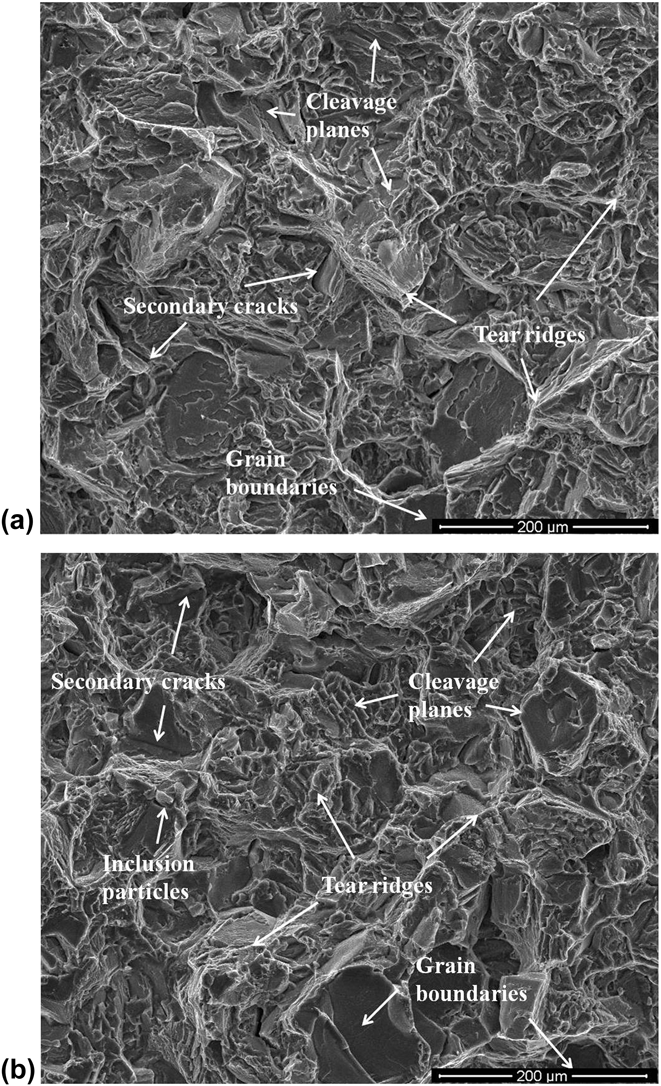
Figure 5 shows the fracture surfaces of tensile specimens of different regions. As can be seen from Fig. 5, the fracture surfaces of the T6 treated GW103K alloy are mainly composed of tear ridges, cleavage planes, secondary cracks, and some grain boundaries, and the fracture mode is quasi-cleavage. There are no obvious differences among the fracture surfaces except the number of inclusion particles.
The fracture surfaces of the tensile specimens: (a) Region B2; (b) Region B3.
Factors that influence the tensile properties of the T6 treated GW103K alloys are thought as the following: grain size, size and distribution of porosities and inclusion particles, size and distribution of precipitates. Solid solution strengthening and precipitation strengthening are important mechanisms that the T6 treated GW103K alloy shows excellent mechanical properties. Especially, the β′ phase is the main strengthening phase in T6 treated GW103K alloy.Reference He, Zeng, Peng, Gao, Nie and Ding5,Reference He, Zeng, Peng, Guo, Chang and Ding6,Reference Lin, Wang, Meng, Cui and Le11 In the present study, the grain size of different regions is almost the same due to the reasonable layout of chill blocks. These chill blocks lead to similar cooling rate of different regions, and the grain size is all ∼70 μm as a result. The fluctuation of chemical compositions is also in a limited scope due to the well-designed sprue runners and ingates. In addition, no porosities can be observed by x-ray inspection, as well as SEM images of the fracture surfaces of tensile and fatigue test. As analyzed, the variation of tensile properties is mainly caused by the distribution of inclusion particles. The inclusion content in the melt is further decreased by refining techniques, e.g., addition of flux, in the production process. However, inclusions inevitably exist in the melt and are inevitably brought by casting process. Though turbulence is minimized by the gating system design and process control, some regions of the component such as Region B3 are still subjected to turbulence due to the complicated structure. The inclusions are easily generated at these sites and hardly to be moved. The inclusions in the melt are also easily gathered at these sites. Both the reasons lead to the relatively high content of inclusions in these regions, such as Regions B1, B3, C3, and C4. As a result, these regions show relatively bad properties. The inclusions of other regions are mainly brought by the melt, so they are small and uniformly distributed. Then these regions show better tensile properties, particularly the UTS and EL.
B. High cycle fatigue properties
1. S–N curves
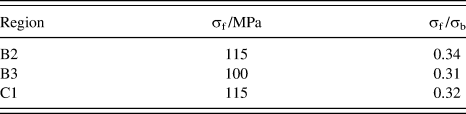
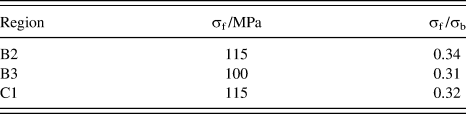
The S–N curves of different regions (B2, B3, C1) under rotating bending loading (R = −1) at a frequency of about 100 Hz in air are presented in Fig. 6. As mentioned above, these three regions were chosen to be studied based on their application purpose, tensile properties, and the residual materials. Regions B2 and B3 are junction sites and Region C1 is a bearing part, and these regions are most likely to be under cyclic loads. To correlate the fatigue strength (σf) (at 107 cycles) with the UTS (σb), the ratios σf/σb for the investigated regions are shown in Table III. The fatigue strength of T6 treated GW103K alloy is in the range from 100 to 115 MPa, and it is comparable to the result of previous work.Reference Liu, Dong, Zhang, Korsunsky, Song and Ding12 The ratios for T6 treated GW103K alloy are from 0.31 to 0.34, consistent with Ref. Reference Ogarevic and Stephens1. The ratio of Region B3 is the lowest, and it indicates that fatigue strength is more sensitive to defects than ultimate strength. The S–N curve of Region B3, which reveals the lowest fatigue strength, shows that the failures mostly happened in the range of less than 106 cycles. This phenomenon will be discussed later.
S–N curves of the T6 treated GW103K alloy. (The colorful figures indicate the number of run-out samples).
Fatigue properties of the T6 treated GW103K alloy.
2. Fractographic analyses
Fatigue is a localized damage of a component produced by cyclic loading. It is the result of the cumulative process consisting of crack initiation, propagation, and final fracture of a component. During cyclic loading, localized plastic deformation may occur at the highest stress site. This plastic deformation induces permanent damage to the component and a crack develops. As the component experiences an increasing number of loading cycles, the length of the crack increases. After a certain number of cycles, the crack will cause the component to fracture. In general, it has been observed that the fatigue process involves three stages: crack incubation and short crack growth (marked as crack initiation stage), long crack growth (crack propagation stage), and final fracture. Cracks start near high stress concentrations, such as persistent slip bands and inclusions. This step, crack nucleation and short crack growth, is the first step in the fatigue process. Once initiation occurs and cyclic loading continues, the crack tends to grow faster and lead to fracture. Crack initiation site is always flat and dark due to cyclic loads and some oxides may be formed. In this stage, the crack tip plasticity is greatly affected by microstructure due to comparable size of crack and microstructure. Long cracks usually propagate normal to the principal tensile stress plane. In this stage, crack propagation is less affected by the microstructure. After certain cycles, the component fractures. In this stage, the fracture surface has a rough appearance. These fatigue stages can be identified from the SEM images of the fracture surfaces, and Fig. 7 gives an illustration.
SEM image of the fracture surface (Region B2, S6 – 120 MPa – 2.8 × 10⁶ cycles).
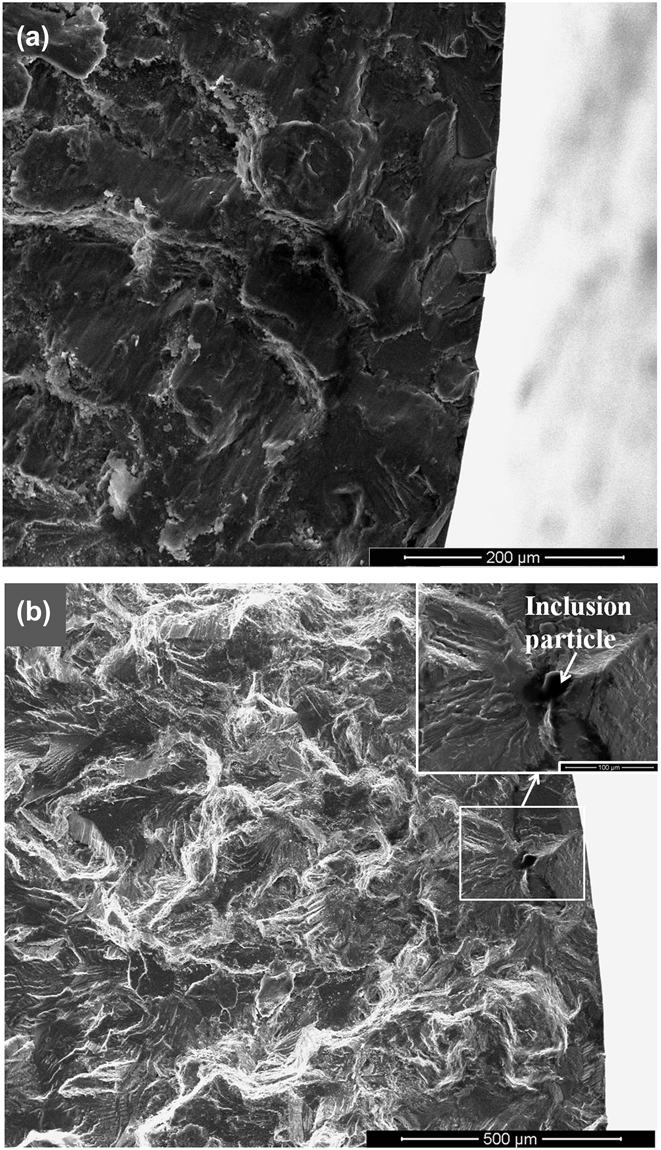
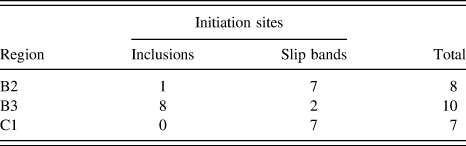
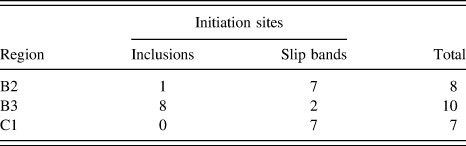
The micro-fractographic examination indicates that few porosities and nonmetallic inclusions are observed around the initiation sites in nearly all the specimens of Regions B2 and C1 [Fig. 8(a)], and fatigue cracks mainly originated from the free surface of the samples. But inclusion particles can be found in most specimens of Region B3 [Fig. 8(b)], these fatigue cracks originate from these inclusions. The initiation sites of all the samples are counted in Table IV. It is well accepted that fatigue cracks are always initiated at sites where stress concentration happens or low strength occurs. In defect-free specimens, such as the samples of Regions B2 and C1, fatigue cracks are initiated from the free surfaces of the samples mainly because the free surfaces experience the maximum tensile stress during rotating bend load fatigue. Once there are inclusion particles or porosities close to or at the free surface of the specimen, for example, Region B3, fatigue cracks mainly originate from these sites due to the stress concentration.
SEM images showing the fatigue crack initiation sites of (a) Region B2 (S6 – 120 MPa – 2.8 × 10⁶ cycles); (b) Region B3 (S8 – 105 MPa – 7.4 × 10⁵ cycles).
Statistics of fatigue crack initiation sites of fracture samples.
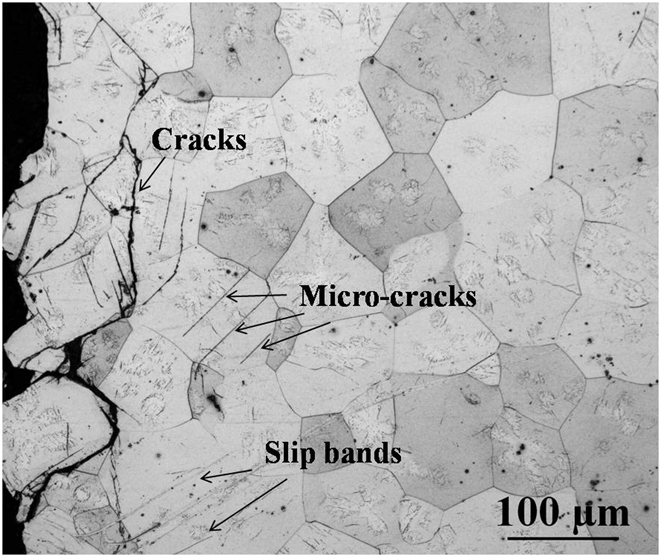
The initiation sites of the samples which contain inclusions can be easily identified by the fractograph, but the fatigue crack incubation mechanism of the defect-free specimens is not clearly identified from the SEM images. So the optical images of the position parallel to the gage length near the crack initiation beneath the fracture surface are observed, as shown in Figs. 9 and 10. No twins can be seen from the photograph, and it can also be seen from Fig. 10 that fatigue failure originates mainly from local sheering near the free surface of the T6 treated alloys during fatigue testing. Straight lines of local sheering can be observed. They are always parallel to each other in a grain and are usually identified as basal slip lines.Reference Harvey, Marsh and Gerberich13,Reference Li, Fu, Peng, Wang, Jiang and Wu14 The secondary microcracks are observed along the slip bands, and the long crack is also connected with the slip bands. This phenomenon indicates that the slip bands may lead to the final fatigue crack initiation.
Illustration of the OM observation surface.
Optical image of the section parallel to the gage length beneath the fracture surface of Region B2 (S6 – 120 MPa – 2.8 × 10⁶ cycles).
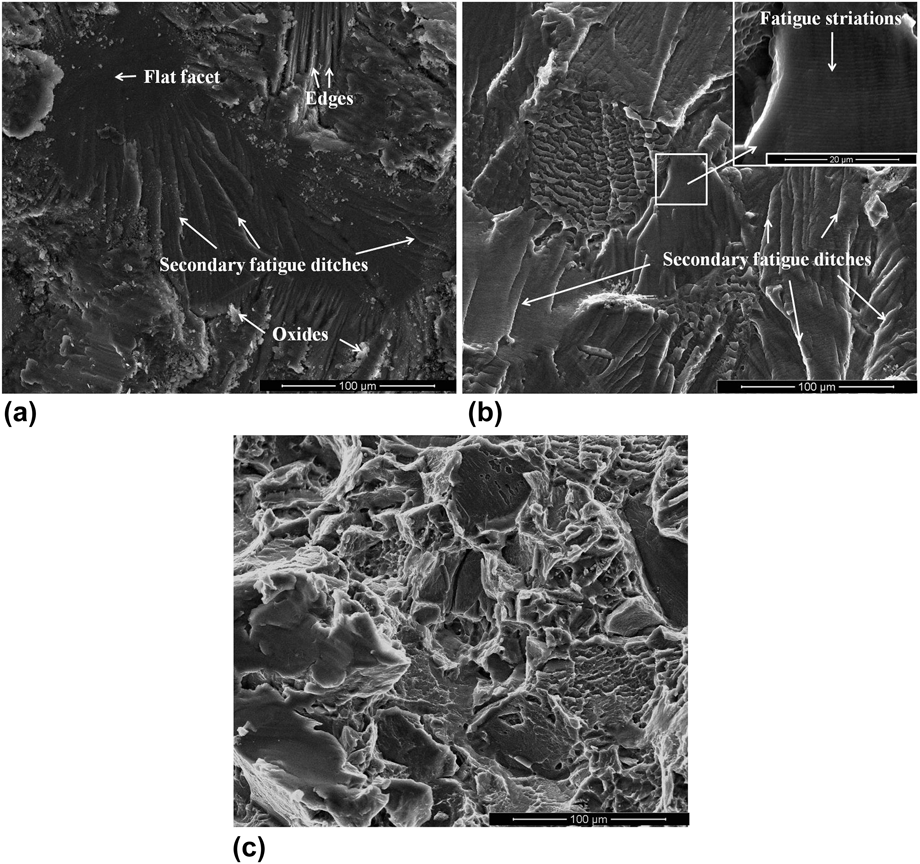
Figure 11 gives a high-magnification observation of different regions of the fatigue fracture surface. In Region I, crack initiation region, the fracture surface is extremely flat [Fig. 11(a)]. Around the initiation sites some oxides, which formed during cyclic loading, are found. And some edges, facets, and secondary cracks are observed. The cracks tend to preferentially grow with a transgranular mode, cutting straight the grains (Fig. 10). In Region II, crack propagation region, the fracture surface is also flat [Fig. 11(b)]. Secondary fatigue ditches, small beach marks, and fatigue striations are observed. The cracks still grow with a transgranular mode, and intergranular crack growth is found only over short distances. Compared with tensile–compression fatigue test, the propagations under rotating bend loads have their own characterizations, as shown in Region II in Fig. 7. It is a result of different growth rates of cracks due to higher stress amplitude near the sample surface than interior. In Region III, overloading region, the fracture surface has a rough appearance, which is very similar to the fracture surface under quasi-static loading [Fig. 11(c)].
SEM images from different regions of the fracture surface: (a) Region I; (b) Region II; (c) Region III.
IV. DISCUSSIONS
The fatigue strength of cast metal materials is generally determined by the microstructure, such as the matrix and the size and distribution of casting flaws which have bearing on the casting parameters. However, the dependence of microstructural features on casting parameters is beyond the scope of this study, and in the following part, the influence of matrix strength and inclusions on the fatigue behavior on low pressure sand cast GW103K alloy is discussed.
In defect-free specimens, as analysis above, fatigue cracks mainly initiate related to slip bands, which are also respectively indicated by Refs. Reference Li, Fu, Peng, Wang, Jiang and Wu14–Reference Höppel, Prell, May and Göken17, as twinning deformation hardly occurs due to the suppression effect of precipitates in the grains.Reference Clark18 Persistent slip bands, extrusions, and intrusions, which are closely related to dislocation glide, are formed in surface grains under cyclic load, and the fatigue cracks incubate at these sites.Reference Frost, Marsh and Pook19 In other words, all the factors that influence the dislocation glide have an effect on the fatigue initiation. He et al. indicate that the slip bands of GW103K are formed through basal slip system, and the β′ precipitates strengthen the GW103K alloy by Orowan mechanism.Reference He, Zeng, Peng, Guo, Chang and Ding6 These small and dense β′ precipitates pin dislocations, resulting in a higher threshold stress for slip. The threshold stress determines the stress amplitude for the formation of slip bands, and thus governs the resistance to fatigue crack nucleation.Reference Li, Fu, Peng, Wang, Jiang and Wu14,Reference Dong, Liu, Song, Zhang, Ding and Korsunsky20 When the cyclic load is above the fatigue strength limit, the persistent slip bands will form and the fatigue cracks nucleate at these places.
Different from defect-free specimens, fatigue cracks usually initiate from inclusions at or near the free surface of defect-containing specimens, which are also indicated by many researchers.Reference Li, Fu, Peng, Wang, Jiang and Wu14,Reference Höppel, Prell, May and Göken17 The stress amplitude is much higher in the vicinity of inclusions, especially for the ones near the surface of samples. In the case of different samples under 110 MPa, extrusions or intrusions are not formed in the defect-free specimens. But slip bands will easily form near the inclusions where the stress amplitude is more than 110 MPa due to the stress concentration. It is to say that the inclusions may not influence the threshold stress determining the stress amplitude for the formation of slip bands but may change the stress distribution state. As analyzed, the inclusions lead to fatigue crack nucleation under lower stress.
Once the fatigue cracks nucleate, the fatigue cracks will propagate under cyclic load. This procedure is also related to the dislocation glide. In defect-free specimens, the matrix and β′ precipitates determine the slip so as to the fatigue growth rate. Once inclusions are existed, the fatigue crack propagation behavior is also influenced by the inclusions. Li et al.Reference Li, Fu, Peng, Wang, Jiang and Wu14 discuss the effect of casting defects on the fatigue properties, and many other studies concentrating on fatigue properties are also related to inclusions and porosities.Reference Lu, Taheri and Gharghouri8–Reference Lu, Taheri, Gharghouri and Han10,Reference Kadiri, Xue, Horstemeyer, Jordon and Wang15,Reference Lorenzo, Alegre and Cuesta21–Reference Murugan, Raghukandan, Pillai and Pai23 For some specimens, there are no inclusions at or near the free surface, whose fatigue cracks mostly initiate from the free surface. The inclusions still affect the fatigue life because the fatigue crack growth rate is much higher when they propagate though the vicinity of the inclusions.Reference Ogarevic and Stephens1,Reference Frost, Marsh and Pook19
There exist a life gap between 106 and 107 cycles regarding the fatigue life of defect samples as mentioned above. The similar phenomenon is reported by He et al.,Reference He, Fu, Wu, Peng, Zhang and Li24 and this phenomenon is explained mainly caused by the fine-grain. It is thought to be related to the inclusions in this study. It is indicated by Ref. Reference Frost, Marsh and Pook19 that the fatigue strength is equal to the largest stress which just does not lead to the propagation of microcracks, rather than the highest cyclic stress leading to cyclic slip. It is supposed that the fatigue cracks nucleate but do not propagate below the fatigue strength (100 MPa) in samples containing inclusions, due to the stress concentration. It is well accepted that fatigue initiation controls the fatigue life under low stress (probably up to 80%). Once the stress amplitude is up to the propagation stress, the crack growth rate is fast, as analyzed above, leading to the short fatigue propagation life. Both the factors contribute to this phenomenon.
V. CONCLUSIONS
In the present study, the microstructures, tensile properties, and high cycle fatigue behavior of different regions in low pressure sand-cast Mg–10Gd–3Y–0.5Zr alloy component with large scale and complicated structure were investigated. The following conclusions can be drawn:
(1) The microstructure of sand-cast GW103K alloy is composed of α-Mg matrix and eutectic compounds Mg24(Gd,Y)5. After T6 heat treatment, the alloy mainly consists of α-Mg, γ, and β′ precipitates.
(2) Different regions of the component show almost the same grain size but have different amount of inclusions. Tensile properties particularly the UTS and EL vary with regions due to the distribution of inclusions.
(3) The fatigue strength of different regions varies in a range from 100 to 115 MPa. The cracks initiate from the free surface in defect-free samples while from inclusions if any inclusions are at or near the free surface.
(4) Inclusions have a detrimental effect on fatigue behavior. Samples containing inclusions show lower fatigue strength and shorter fatigue life under the same loads compared with the defect-free ones.
ACKNOWLEDGMENTS
This work is sponsored by Shanghai Rising-Star Program (B type, 14QB1403200), National Natural Science Foundation of China (No. 51275295), Research Fund for the Doctoral Program of Higher Education of China (Nos. 20120073120011 and 20130073110052), and IPP program in SJTU (No. IPP7036).