I. INTRODUCTION
Manipulation of magnetic properties by stimuli other than external magnetic fields and temperature is a research topic of both fundamental and applied interests. Reference Heron, Trassin, Ashraf, Gajek, He, Yang, Nikonov, Chu, Salahuddin and Ramesh1–Reference Cherifi, Ivanovskaya, Phillips, Zobelli, Infante, Jacquet, Garcia, Fusil, Briddon, Guiblin, Mougin, Ünal, Kronast, Valencia, Dkhil, Barthélémy and Bibes4 For example, magnetic properties of materials can be directly affected by external pressure, Reference Kouvel and Wilson5–Reference Kouvel and Hartelius7 light, Reference Kirilyuk, Kimel and Rasing8 electric field, Reference Ohno, Chiba, Matsukura, Omiya, Abe, Dietl, Ohno and Ohtani9–Reference Chernyshov, Overby, Liu, Furdyna, Lyanda-Geller and Rokhinson11 and electrical current. Reference Berger12–Reference Slonczewski14 While these effects can be important in single-component materials, a new class of materials with a greater range of functionality can be engineered using thin-film hybrid structures. Reference Zutic, Fabian and Das Sarma15,Reference Stamps16
Thin-layered materials offer a greater range of tunability due to the interaction of the constituent components. Reference Eerenstein, Mathur and Scott17,Reference Ramesh and Spaldin18 In such layered heterostructures the interface takes a dominant role in determining the overall physical properties, Reference Eliseev, Morozovska, Glinchuk, Zaulychny, Skorokhod and Blinc19,Reference Zubko, Gariglio, Gabay, Ghosez and Triscone20 and the materials behavior may vary drastically from the bulk properties. Reference Velev, Dowben, Tsymbal, Jenkins and Caruso21,Reference Rondinelli and Spaldin22 Structural distortions, chemical diffusion, proximity effects, and magnetic or electronic exchange coupling between the materials generate new degrees of freedom. Reference Velev, Jaswal and Tsymbal23 Important examples are the giant magnetoresistance effect, Reference Baibich, Broto, Fert, Van Dau, Petroff, Etienne, Creuzet, Friederich and Chazelas24–Reference Prinz26 exchange bias, Reference Nogués and Schuller27 and multiferroicity. Reference Vaz10,Reference Ramesh and Spaldin18 In general, nanostructured materials show a higher susceptibility to external driving forces, such as light, electric and magnetic fields (AC and DC), EM waves, temperature, pressure, sound waves, and stress.
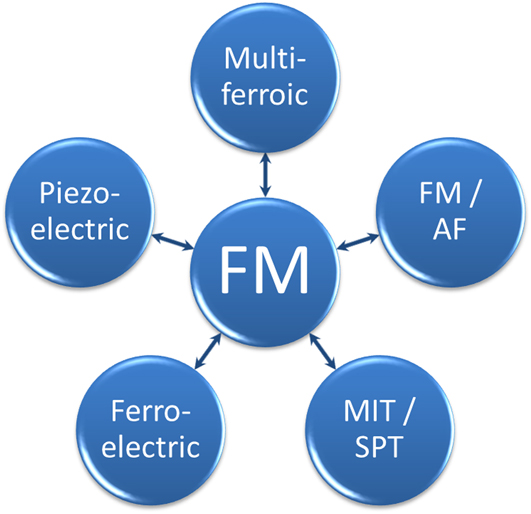
Figure 1 illustrates some possibilities for combining materials with fundamentally different properties into hybrid structures to achieve control over the ferromagnetic (FM) behavior. One of the most famous hybrid materials consists of a ferromagnet in direct contact with an antiferromagnet (AF). Reference Nogués and Schuller27–Reference Kiwi30 Direct magnetic coupling at the interface between the materials typically leads to a horizontal shift of the FM hysteresis along the applied field axis, the so-called “exchange bias.” This effect provides an effective stabilization of the magnetization within one FM layer, while allowing freely rotatable magnetic layers further along the materials stack. The phenomenon of exchange bias in thin film and nanostructured systems has been investigated extensively and the effect has been observed in a range of different materials. Reference Nogués and Schuller27,Reference Nogués, Sort, Langlais, Skumryev, Suriñach, Muñoz and Baró31
Sun-wheel illustration of possible magnetic hybrid structures. The lower right field of MIT/SPT stands for the class of transition-metal oxides that undergo a MIT in combination with a structural transition of the atomic arrangement.

A more recent development in thin film heterostructures is the combination of magnetic oxides to create materials with a coexistence of at least two ferroic order phenomena, i.e., ferroelectric, FM, or ferroelastic. Only a few single phase multiferroic materials exist, Reference Hill32–Reference Khomskii34 but a large amount of composite structures with even greater flexibility can be engineered. Reference Vaz10,Reference Eerenstein, Mathur and Scott17 Between the materials properties indicated in Fig. 1 several new effects and possibilities of control can be imagined.
Direct control of the magnetic orientation in FM semiconductors has been suggested by using electric fields Reference Ohno, Chiba, Matsukura, Omiya, Abe, Dietl, Ohno and Ohtani9,Reference Chiba, Yamanouchi, Matsukura and Ohno35 and recently shown experimentally in (Ga,Mn)As via spin-orbit-induced polarization of charge and spin carriers. Reference Chernyshov, Overby, Liu, Furdyna, Lyanda-Geller and Rokhinson11,Reference Rokhinson, Overby, Chernyshov, Lyanda-Geller, Liu and Furdyna36 The coupling of FM materials to ferroelectric and multiferroic materials has gained much attention due to the possibility of controlling magnetization via electric fields. For example, coupling between magnetic moments in the multiferroic BiFeO3 (BFO) and the FM CoFe leads to FM/multiferroic heterostructures in which the FM magnetization can be reversed by electric fields. Reference Heron, Trassin, Ashraf, Gajek, He, Yang, Nikonov, Chu, Salahuddin and Ramesh1,Reference Chu, Martin, Holcomb and Ramesh37 Most multiferroic oxides have an AF spin structure in the ground state, which couples to the FM and leads to the observation of exchange bias. Due to the multiferroic properties, this bias can be effectively tuned, and this has been demonstrated using several different FM oxides on BiFeO3, for example La0.7Sr0.3MnO3, Reference Wu, Cybart, Yu, Rossell, Zhang, Ramesh and Dynes38 YMnO3, Reference Laukhin, Skumryev, Martí, Hrabovsky, Sánchez, García-Cuenca, Ferrater, Varela, Lüders, Bobo and Fontcuberta2 LuMnO3, Reference Skumryev, Laukhin, Fina, Martí, Sánchez, Gospodinov and Fontcuberta39 and Cr2O3. Reference Borisov, Hochstrat, Chen, Kleemann and Binek40,Reference He, Wang, Wu, Caruso, Vescovo, Belashchenko, Dowben and Binek41
This review focuses on the control of magnetic properties of a FM material using magnetoelastic coupling without the aid of external fields. In particular, we discuss interfacial strain coupling between FM and materials that undergo a structural transition as a function of temperature or electric field. FM materials are susceptible to strain and a change in interatomic distances can lead to changes in the saturation magnetization. Reference Freeman and Wu42,Reference Hattox, Conklin, Slater and Trickey43 Section II provides an overview of recent examples of tuned magnetic behavior in such hybrid materials. Section III shows that the effect is more general and can be applied also to nonferroelectric materials. In particular, we discuss the coupling between the structural phase transition (SPT) of vanadium oxides and elemental FMs. A different combination of physical properties can be exploited, as the change in magnetic properties coincides with a large change in electrical resistivity due to a metal-to-insulator transition. We discuss the observation of the effect in different systems using VO2 and V2O3 and highlight the possibilities of tuning the system through FM materials choice and sample morphology.
II. INTERFACIAL STRAIN MAGNETIC COUPLING
FM materials are key ingredients for magnetoelectronics and spintronics. Reference Chappert, Fert and Dau44 Both magnitude and direction of the spontaneous magnetization are used in storage media and sensors, while the FM hysteresis provides the stability of the information. However, nanoscale control of the magnetic properties is limited by the external magnetic field, which has a finite spatial extent. Magnetoelastic coupling offers a different route to alter magnetic properties directly without the need of external fields. Strain affects the magnetic properties of a FM because of the inverse magnetostriction, i.e., strain in the material induces changes in magnetization. Reference Kittel45,Reference Lee46 FM rare-earth manganites are particularly sensitive to pressure and strain Reference Dagotto, Hotta and Moreo47–Reference Haghiri-Gosnet and Renard50 and therefore appear to be prime candidates for this approach. Successful manipulation of the magnetization in La0.7A0.3MnO3 (A = Sr, Ca) on piezoelectric Reference Thiele, Dörr, Bilani, Rödel and Schultz51,Reference Srinivasan, Rasmussen, Levin and Hayes52 and ferroelectric Reference Lee, Nath, Eom, Smoak and Tsui53,Reference Eerenstein, Wiora, Prieto, Scott and Mathur54 substrates has been reported. Changes in the magnetization of 25% are reported at nonsaturating fields, but no change in coercivity or saturation magnetization was observed. Using Fe3O4, Brandlmaier et al. showed a shift in the magnetic anisotropy axis orientation leading to a rotation of magnetization. Reference Brandlmaier, Geprägs, Weiler, Boger, Opel, Huebl, Bihler, Brandt, Botters, Grundler, Gross and Goennenwein55
Magnetoelastic coupling with simple nonoxide ferromagnets was first predicted theoretically, Reference Duan, Jaswal and Tsymbal56 and later experimentally realized in a system of Fe in contact with BaTiO3. Reference Sahoo, Polisetty, Duan, Jaswal, Tsymbal and Binek57 In addition to the ferroelectric properties of BaTiO3, several structural phase transitions occur as a function of temperature. At each of the transition temperatures, a change of the Fe magnetization was observed in magnetic fields substantially below the saturation of Fe. This change in magnetization was accompanied with changes in the coercive fields of the FM hysteresis. Similar observations were made using Ni thin films as the FM counterpart. Reference Weiler, Brandlmaier, Geprägs, Althammer, Opel, Bihler, Huebl, Brandt, Gross and Goennenwein58,Reference Geprägs, Brandlmaier, Opel, Gross and Goennenwein59 With the films held at remanence, i.e., in zero external magnetic field, changes in the magnetization of 20% were observed as a function of the applied electric field. These changes, however, were not reversible without the application of larger external magnetic fields and therefore attributed to the formation of multidomain states in the Ni. To avoid clamping effects due to the substrate in a thin film structure, the FM material can be embedded in the driving material in the form of nanostructures, which has been shown for the case of BaTiO3/CoFe2O4 nanopillars. Reference Zheng, Wang, Lofland, Ma, Mohaddes-Ardabili, Zhao, Salamanca-Riba, Shinde, Ogale, Bai, Viehland, Jia, Schlom, Wuttig, Roytburd and Ramesh60,Reference Wu, Chai, Zhou, Zhang, Kitamura and Zhou61
The flexibility of hybrid structures was shown in epitaxially grown FeRh on BaTiO3 at room temperature. Reference Cherifi, Ivanovskaya, Phillips, Zobelli, Infante, Jacquet, Garcia, Fusil, Briddon, Guiblin, Mougin, Ünal, Kronast, Valencia, Dkhil, Barthélémy and Bibes4 FeRh exhibits a metamagnetic transition from FM to AFM order just above room temperature, which could be initiated by elastic strain from the underlying BaTiO3 by the application of an electric field. All the above examples have a common feature that the changes in magnetic properties, i.e., magnetization and coercivity, are caused by elastic deformations in the underlying substrates, which strains the FM due to magnetoelastic coupling. In the following section we present a similar effect without the use of a ferroelectric material. Instead, we focus on materials showing a metal-to-insulator transition (MIT) with several orders-of-magnitude change in resistance and SPT and the combined effect on magnetic properties in hybrid systems. The combination of the electronic phase transition in the vanadium oxide with magnetism represents an attractive possibility for future technological applications.
III. STRAIN EFFECTS AT VANADIUM-OXIDE/FM INTERFACES
Some transition metal oxides undergo electronic phase transitions that result in changes in the electrical resistivity of several orders of magnitude. This electronic phase transition may occur at the same temperature as other phase transitions, i.e., magnetic or structural. Several examples for this situation can be found in the vanadium-oxide family. Drastic changes in the magnetic coercivity of a FM brought in contact with two members of the vanadium oxides have been reported recently. Reference de la Venta, Wang, Ramirez and Schuller62,Reference de la Venta, Wang, Saerbeck, Ramírez, Valmianski and Schuller63 Bulk VO2 and V2O3 undergo a MIT at 340 and 160 K, Reference Imada, Fujimori and Tokura64,Reference Yethiraj65 respectively, characterized by several orders-of-magnitude change in the electric resistivity. Concurrent in temperature with the MIT, a SPT occurs from a high-temperature rutile (corundum) to a low-temperature monoclinic symmetry of the VO2 (V2O3) crystal. Both materials have attracted considerable attention in basic and applied research investigating the driving mechanism of the phase transition, the connection between the MIT and SPT, and potential technological applications. Reference Brockman, Samant, Roche and Parkin66 In particular, for technological reasons, VO2 is drawing attention because the transition temperature is close to room temperature, lifting the need for excessive cooling to cryogenic temperatures if the material is to be implemented in devices. To date, the research interest in V2O3 is mostly driven by the understanding of the role of electronic correlations in the MIT. Reference Mott67,Reference Mott68 An extra peculiarity arises in V2O3 due to antiferromagnetic ordering below the MIT and SPT transition temperatures. Reference Moon69,Reference Bao, Broholm, Aeppli, Carter, Dai, Rosenbaum, Honig, Metcalf and Trevino70 Whether a detectable magnetic coupling arises between the oxide and the ferromagnet will be addressed in Sec. III. B.
To investigate the coupling between an oxide and an elemental ferromagnet, VO2 (100 nm)/Ni (10 nm) and V2O3 (100 nm)/Ni (10 nm) bilayers were grown on (01-12) Al2O3 substrates by RF magnetron sputtering. Reference de la Venta, Wang, Ramirez and Schuller62 For both vanadium oxides a V2O3 target (>99.7%, ACI Alloys Inc., San Jose, CA) was used, with the difference that 8.5% ultra-high purity (UHP) O2 was mixed into the 4 mTorr UHP Ar for the deposition of VO2. The base pressure during the deposition of V2O3 (VO2) at 750 °C (600 °C) was 1 × 10⁻⁷ Torr. Ni was deposited on VO2 either at room temperature or at an elevated temperature of 420 K, which will be discussed in more detail below. Fe and Co were evaporated on V2O3 at room temperature.
A. The VO2/Ni system
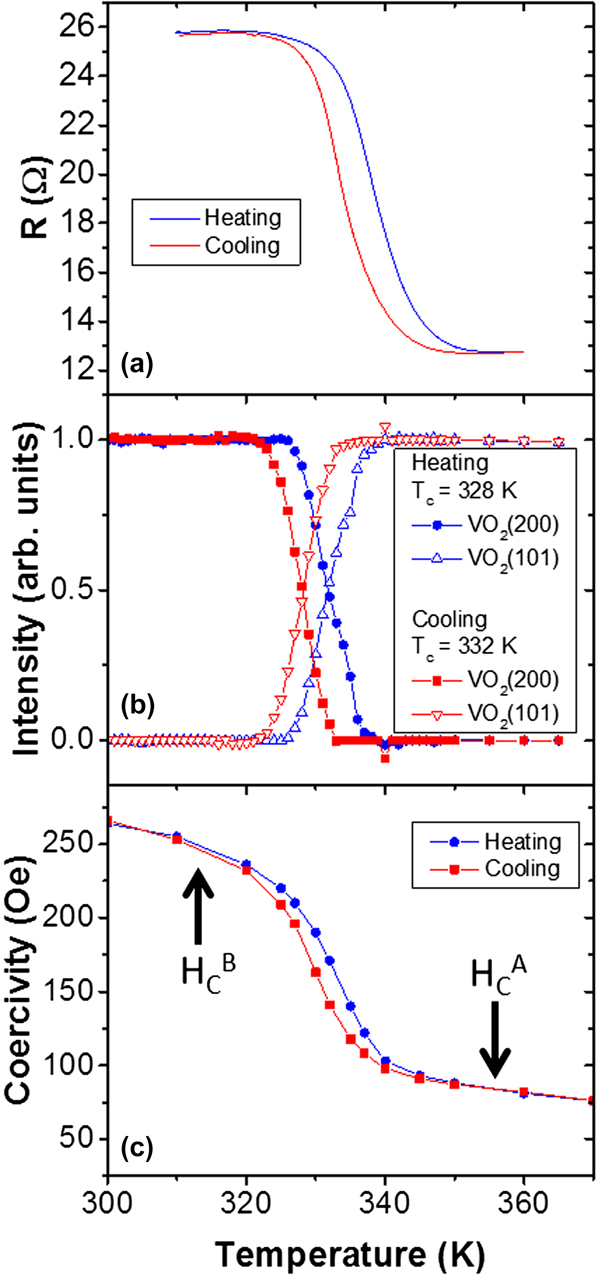
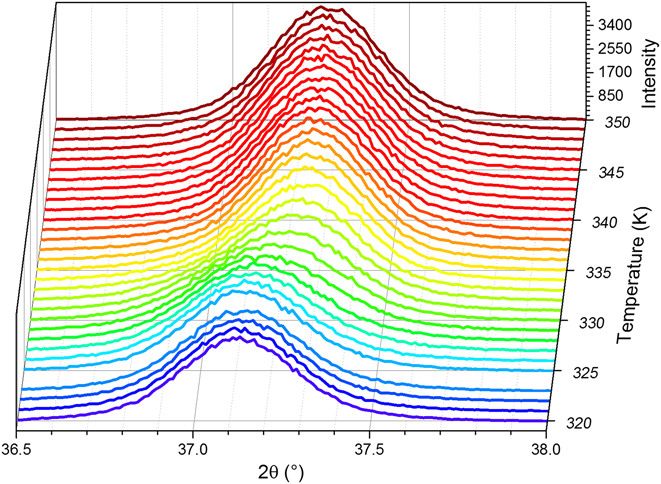
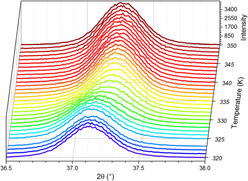
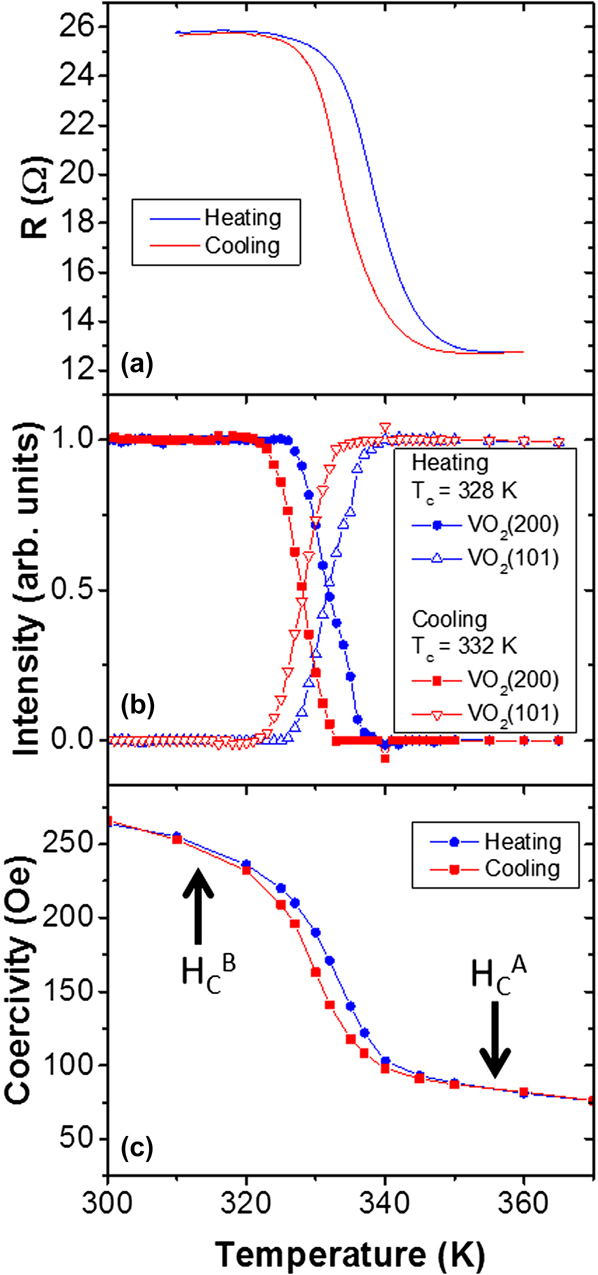
Figure 2(a) shows the resistance of a VO2/Ni bilayer as a function of temperature, measured in two-probe configuration. The contact resistance plays a negligible role on the combined resistance of the bilayer as a function of temperature. Typical VO2 films of similar thickness show changes in resistance from several tens of ohms in the metallic state to 106 Ω at room temperature. The resistance of a metallic Ni layer is on the order of ten ohms but only changes by a few ohms within the temperature region are shown in Fig. 2(a). Due to the parallel resistor configuration of the combined VO2/Ni system, the Ni film dominates the resistance and only 10 Ω change is observed as a result of the VO2 transition. A further indication of the VO2 MIT is the observation of a 5 K hysteresis between the measurements while heating (T c W = 339 K) and cooling (T c C = 334 K). This hysteresis is characteristic for VO2, whose T c is determined at 50% of the change in resistance. Figure 2(b) shows the structural transition illustrated as the normalized intensity of the x-ray diffraction peak from the rutile and monoclinic phase. This appears in the measurement as a change in lattice spacing along the out-of-plane direction as the surface normal changes from VO2(200) (2θ = 37.06°) to the VO2(101) (2θ = 37.17°) plane (Fig. 3). The intensity information was obtained from Gaussian fits to the diffracted intensity at fixed temperatures. Throughout the phase transition, only a redistribution of intensity between the 2θ values of the VO2(200) and VO2(101) lattice spacing is observed. During the phase transition two Gaussian peak profiles overlap and the transition appears as a peak shift from high to low 2θ values. However, the absolute value of the lattice spacing (position in 2θ) and the full-width-half-maximum (FWHM) of the individual diffraction peaks remain constant. The change in the diffraction intensity shows the same thermal hysteresis as the resistive transition. Both the MIT and SPT appear within the same temperature interval and fully characterize the VO2 thin film.
MIT (a) and SPT (b) of VO2/Ni and resulting coercivity enhancement of Ni deposited at 420 K (c) resulting from the SPT in VO2. Note that the change in resistance results from the MIT of VO2, which appears suppressed due to the shortening metallic layer on the oxide. The coercivity of the Ni film above the VO2 phase transition is labeled as H C A, while it is labeled as H C B below the MIT and SPT. (Parts of the figure are adapted from Ref. Reference Zheng, Wang, Lofland, Ma, Mohaddes-Ardabili, Zhao, Salamanca-Riba, Shinde, Ogale, Bai, Viehland, Jia, Schlom, Wuttig, Roytburd and Ramesh60.)
X-ray diffraction recorded along the surface normal as a function of temperature. At the SPT temperature of VO2 a change of the diffraction angle is observed as the surface plane changes from monoclinic (200) to tetragonal (101) of VO2.

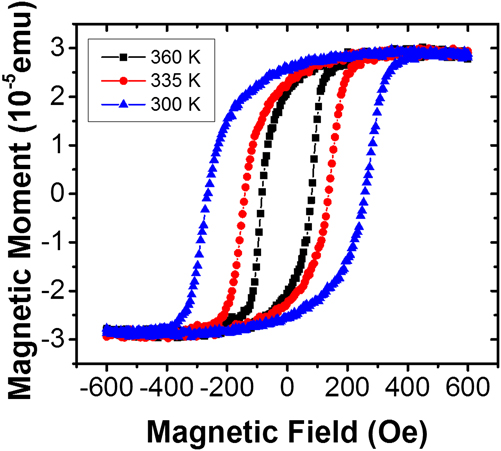
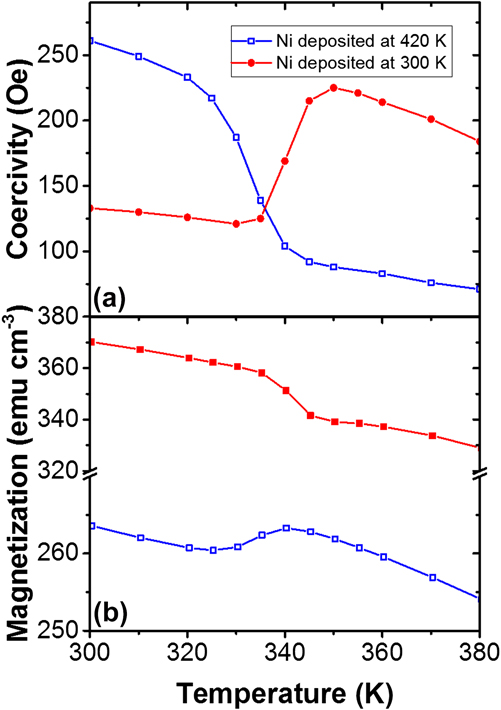
The temperature dependence of the Ni coercivity is shown in Fig. 2(c), extracted from the FM hysteresis loops measured with vibrating sample magnetometry (VSM). The Ni layer for this sample was deposited at 420 K, i.e., with VO2 in the metallic state. Within the narrow 40 K temperature range, the coercivity increases to three times the initial value as the temperature is reduced from 350 to 310 K. For clarity in the remainder of this review, the FM coercivity above the oxide phase transition will be labeled as H C A, while the coercivity below the transition, i.e., with the oxide in the insulating state, will be labeled as H C B. During the transition, only the coercivity is observed to change, while the saturation magnetization and shape of the hysteresis loops remain constant (Fig. 4). Reference de la Venta, Wang, Ramirez and Schuller62,Reference de la Venta, Wang, Saerbeck, Ramírez, Valmianski and Schuller63 However, if the moment M is recorded as a function of temperature in a field not sufficient to fully saturate the film, a change in M is observed at the same temperature as the coercivity change (Fig. 5). This change in moment, while the saturation magnetization M S stays constant, indicates an additional magnetic domain formation or domain realignment in nonsaturating fields. Therefore, the moment decrease is unrelated to intrinsic magnetic properties of Ni, but connected to the vanadium-oxide SPT, which leads to the formation of new magnetic domains in the Ni. We will address this phenomenon in more detail as we turn to the discussion of V2O3 bilayers. The effect is fully reversible and shows the thermal hysteresis of the VO2 transition.
Example magnetic hysteresis loops of VO2/Ni as a function of temperature. As the temperature decreases, the hysteresis loops widen, i.e., the coercivity increases, whereas the general shape and saturation magnetization remain constant.

Coercivity (a) and magnetization (b) of VO2 (100 nm)/Ni (10 nm) bilayer in which the Ni has been deposited on VO2 in the metallic (420 K, open symbols) or insulating (300 K, filled symbols) state. (Figure adapted from Ref. Reference Zheng, Wang, Lofland, Ma, Mohaddes-Ardabili, Zhao, Salamanca-Riba, Shinde, Ogale, Bai, Viehland, Jia, Schlom, Wuttig, Roytburd and Ramesh60.)

The increase in coercivity can be explained by the strain induced by the SPT, while the MIT does not have an effect. The SPT from the low-temperature monoclinic to the high-temperature rutile VO2 leads to an anisotropic volume expansion of 1%.
Reference Griffiths and Eastwood71–Reference Andersson73
Due to the single crystalline growth of the oxide, this volume expansion produces a lattice expansion in the VO2 surface plane. Due to the coupling at the interface, this strain is transferred into the FM, which leads to an inverse magnetostrictive effect.
Reference de la Venta, Wang, Ramirez and Schuller62,Reference Cullity and Graham74
The strain due to the lattice deformation has been estimated to be on the order of 100 MPa.
Reference Viswanath, Ko and Ramanathan75
An estimate of the effect on coercivity can be obtained using the general relation for the stress anisotropy field
 ${H_{{\rm{K}}\sigma }} = {{3{\lambda _{{\rm{si}}}}\sigma } \over {{M_{\rm{S}}}}}$
, in which λsi is the magnetostriction coefficient, M
S the saturation magnetization, and σ the stress in Pa.
Reference Cullity and Graham74
Since the Ni thin film is not epitaxial but textured along the out-of-plane direction, the polycrystalline Ni magnetostriction coefficient
 $\left( {{\lambda _{{\rm{si}}}} = - 34 \times {{10}^{ - 6}}} \right)$
can be used together with the saturation magnetization of 470 emu/cm3 to estimate the effect.
Reference de la Venta, Wang, Ramirez and Schuller62,Reference Cullity and Graham74
This leads to estimated coercivity changes of ∼200 Oe, which agrees well with the observed coercivity increase.
Figure 5 illustrates one possibility of tuning the effect. During preparation, the Ni layer can be deposited either with the VO2 in its metallic state at elevated temperatures (Figs. 2 and 5, open symbols) or in the insulating state at room temperature (Fig. 5, filled circles). Due to a high surface mobility during the growth, Ni grows relaxed at both temperatures. Therefore, when Ni is grown at 420 K, the volume decrease of VO2 to the low-temperature monoclinic phase causes a compressive strain on the Ni. With Ni grown at 300 K, i.e., with VO2 in the monoclinic state, the volume increase to the rutile phase of VO2 causes a tensile strain. As a result, the behavior of the coercivity and magnetization of Ni through the phase transition is reversed when both deposition temperatures are compared. We note that the exact values of the epitaxial strain are difficult to determine, since the lattice expansion is anisotropic with respect to the lattice directions and twin boundaries, Reference Yang, Aggarwal, Gupta, Zhou, Narayan and Narayan76,Reference Zhao, Hwan Lee, Zhu, Nazari, Chen, Wang, Bernussi, Holtz and Fan77 and structural phase coexistence during the transition Reference Qazilbash, Tripathi, Schafgans, Kim, Kim, Cai, Holt, Maser, Keilmann, Shpyrko and Basov78 add to the stress. The VO2 behaves the same, independent of the Ni deposition temperature. This highlights the interfacial coupling between the FM and the oxide, since the magnetic properties directly correlate with the resistive and structural properties. The magnitude of the change remains the same, which indicates that the mechanism is only reversed and a similar strain acts on the Ni. Therefore, the strain imposed on the FM layer is within the elastic limit.
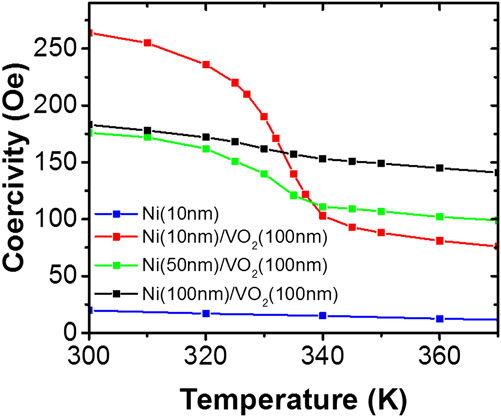
Because the coupling between Ni and VO2 is an interfacial effect, the magnitude of the coercivity change is expected to decrease with increasing Ni thickness. This behavior is shown in Fig. 6. In addition, Fig. 6 shows the temperature dependence of a single Ni (10 nm thick) film grown directly on r-plane Al2O3 substrate. For this sample, only the expected slow linear increase of coercivity is observed.
Coercivity enhancement in VO2/Ni bilayers as a function of Ni thickness. (Figure adapted from Ref. Reference Zheng, Wang, Lofland, Ma, Mohaddes-Ardabili, Zhao, Salamanca-Riba, Shinde, Ogale, Bai, Viehland, Jia, Schlom, Wuttig, Roytburd and Ramesh60.)

Although the absolute value of the coercivity varies depending on the thickness of Ni, the effect of the strain transition is observed in all samples containing VO2. With increasing Ni thickness on VO2, the absolute difference between H C A and H C B decreases, but remains visible up to a thickness of 100 nm. This illustrates that the strain effect at the interface can be transferred effectively into the metal and the thickness can be used as an additional method to fine-tune the hybrid materials response. For further tuning possibilities and generalizations of the vanadium-oxide/FM system, we turn to the discussion of V2O3/Ni bilayer structures in Sec. III. B.
B. The V2O3/FM system (FM = Ni, Fe, Co)
The generality of the interfacial magnetoelastic effect can be shown by comparing the VO2/Ni bilayer with V2O3/Ni bilayers. In addition to the transition temperature, the phase transition of V2O3 differs from VO2 in many ways. Most strikingly, the V2O3 SPT leads to a 1.4% volume increase when going from the high-temperature trigonal phase of V2O3 to the low-temperature monoclinic phase. Reference McWhan and Remeika79 Therefore, Ni is deposited on a material with a different underlying surface symmetry from that of VO2. In addition, the relative change in volume is larger than in VO2 and of opposite sign. The lattice transformation of V2O3 is anisotropic and the a-axis of the hexagonal unit cell is found to expand, whereas only the c-axis contracts.
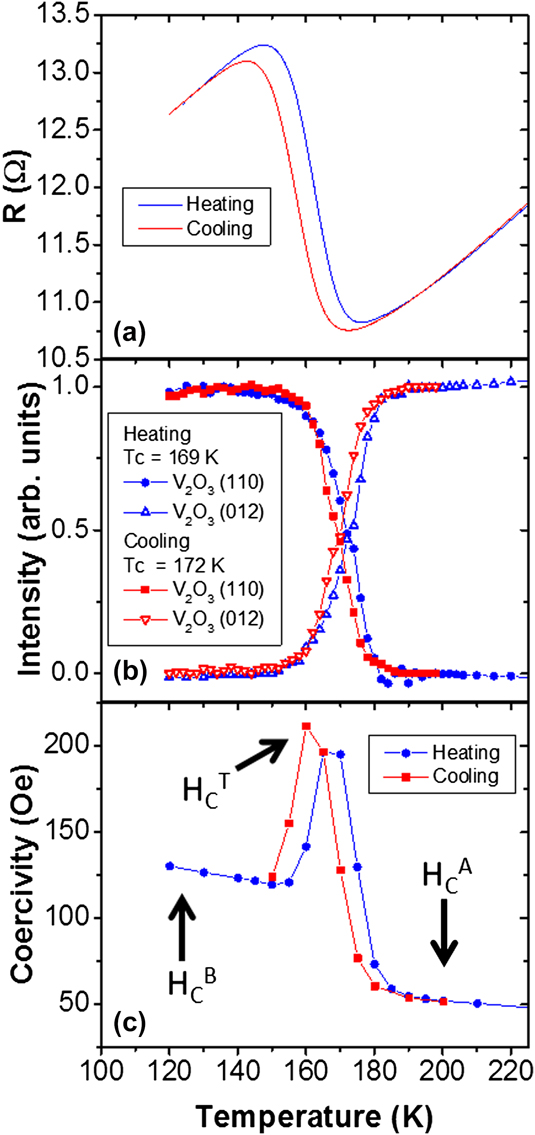
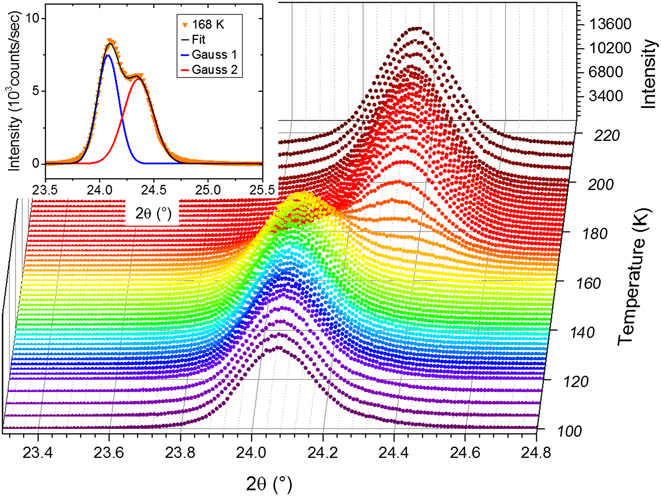
Figure 7 shows the MIT, SPT, and coercivity behavior as a function of temperature. Typical V2O3 samples without metallic capping layers show a transition from several tens of ohms at 200 K to about 107 Ω at 110 K. As before, the large MIT is masked by the metallic capping layer and Ni film on the V2O3. Nevertheless, a clear resistive transition of 2.5 Ω is observed reproducibly during heating or cooling of the sample with small thermal hysteresis of 6 K between T c W = 163 K and T c C = 157 K. The corundum to monoclinic SPT is shown as the evolution of the observed x-ray diffraction intensity of the out-of-plane V2O3(012) (2θ = 24.32°) and V2O3(110) (2θ = 24.00°) lattice planes. Similar to the VO2, the observed intensity (Fig. 8) has been fitted to two Gaussians centered at the 2θ values of the high-temperature (012) and low-temperature (110) lattice plane. The inset of Fig. 8 shows an example profile at 168 K fitted with two Gaussian peak functions. The individual Gauss profiles are shown in addition to the combined fit, which shows a good match to the data. The larger difference between diffraction angles compared to VO2 makes the two V2O3 phases more distinguishable. In particular, the fitting with two Gaussian profiles shows clearly that no intermediate values for the lattice spacing occur, but only a redistribution of the intensity between the high- and low-temperature 2θ values takes place.
MIT (a) and SPT (b) of V2O3/Ni in both heating and cooling branches. The change in resistance results from the MIT of V2O3, which appears suppressed due to the metallic layer on the oxide. (c) Coercivity enhancement of Ni due to the SPT of V2O3. (Figure adapted from Ref. Reference de la Venta, Wang, Saerbeck, Ramírez, Valmianski and Schuller63.)

X-ray diffraction recorded along the surface normal as a function of temperature. At the SPT temperature of V2O3 a change of the diffraction angle is observed as the surface plane changes from monoclinic (110) to hexagonal (012) of V2O3. The data have been recorded while cooling the sample. Inset: Scan at 168 K (symbols) and Gaussian fit (thin black line) resulting from two Gaussian profiles (blue and red lines).

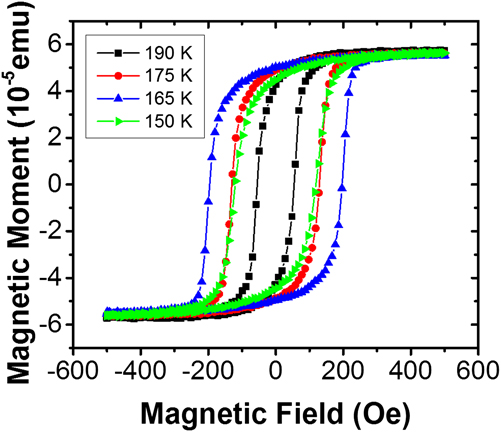
The Ni coercivity as a function of temperature is shown in Fig. 7(c), for which the values were extracted from the FM hysteresis loops recorded at different temperatures (Fig. 9). Reference de la Venta, Wang, Saerbeck, Ramírez, Valmianski and Schuller63 Figure 9 shows that the shape of the magnetic hysteresis loop is preserved for each temperature and only the width of the loops varies. In addition, no change in saturation magnetization is observed, similar to the case of Ni/VO2. At 120 K, the value of the coercivity H C B is three times higher than the value H C A at 200 K, above the transition. This increase can be interpreted using the same model: Stress anisotropy increases the coercivity in Ni due to the V2O3 SPT. While the increase between H C A and H C B is similar in magnitude and direction to the case of VO2/Ni bilayers, in the center of the transition a peak four times larger than the value at 200 K is observed. While the values well above and below the transition are independent of the temperature sweep direction, the maximum coercivity follows the thermal hysteresis of V2O3. This maximum enhancement of the coercivity will be discussed separately in Sec. IV.
Example magnetic hysteresis loops of V2O3/Ni as a function of temperature. Similar to the case of Ni/VO2, the shape and saturation magnetization of the samples is preserved at all temperatures, whereas only the coercivity changes as a function of temperature.

Regarding the overall enhancement of the coercivity, the antiferromagnetic transition of V2O3 (Ref. Reference Moon69) may provide an alternative explanation. The AF transition of V2O3 coincides with the SPT and MIT (T N ∼ 160 K). Reference Moon69,Reference Bao, Broholm, Aeppli, Carter, Dai, Rosenbaum, Honig, Metcalf and Trevino70 The magnetic order is FM within the monoclinic (010) planes and reversed in adjacent planes. Reference Moon69 In addition, the formation of a weak moment incommensurate spin-density wave has been reported. Reference Bao, Broholm, Aeppli, Carter, Dai, Rosenbaum, Honig, Metcalf and Trevino70 An increase in coercivity below the Néel temperature has been observed in other AF/FM systems showing exchange bias. Reference Nogués and Schuller27,Reference Stamps29,Reference Dimitrov, Zhang, Xiao, Hadjipanayis and Prados80–Reference Leighton, Nogués, Jönsson-Åkerman and Schuller82 Exchange bias has also been reported in V2O3/FM systems. Reference Sass, Buschhorn, Felsch, Schmitz and Imperia83 However, in the case of our V2O3/Ni bilayers, no evidence for such magnetic coupling between the FM and AF is observed. The FM hysteresis of Ni does not show a dependence on the field cooling to temperatures below the AF transition, i.e., no exchange bias Reference Nogués and Schuller27 or asymmetric magnetization reversal is observed, which often indicates magnetic coupling. Reference Fitzsimmons, Yashar, Leighton, Schuller, Nogues, Majkrzak and Dura84–Reference Manna and Yusuf88 The similarity to the effects observed in VO2, which does not show an AF spin ordering at any temperature, further supports the idea that the AF transition is not responsible for the coercivity enhancement. However, to fully rule out the influence of the AF transition on the FM properties, the magnetic interface can be decoupled from the structural interface by introducing a nonmagnetic spacer layer with varying thickness.
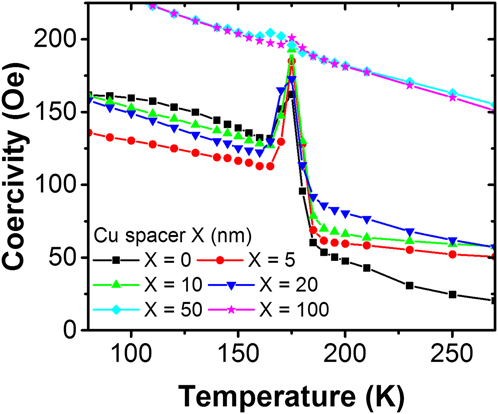
Investigating the coercivity enhancement with increasing Ni thickness grown on VO2 showed that the effect decreases as the stress in the Ni layer is allowed to relax along the vertical direction with respect to its surface. However, if the effect does not rely on a short-ranged magnetic exchange, it can be transferred through a nonmagnetic spacer layer (Fig. 10). Different thicknesses of Cu up to 20 nm have been grown between Ni and V2O3 with only little effect on the coercivity increase due to stress and the maximum H C. With 50 nm of Cu, the stress due to the SPT appears relaxed along the vertical direction. However, a small peak remains in the center of the transition, indicating that some of the underlying strain from V2O3 is transferred through the Cu spacer up to a thickness of 100 nm. This observation refutes the influence of AF spins and fully supports the suggested interface strain coupling. Cu and Ni have similar lattice constants and elastic properties. Therefore, the strain transferred onto the Cu from the V2O3 is directly transmitted into the Ni without great losses when the Cu thickness is below 20 nm.
Coercivity increase in a V2O3 (100 nm)/Cu(X nm)/Ni (10 nm) trilayer with varying Cu spacer layer thickness.

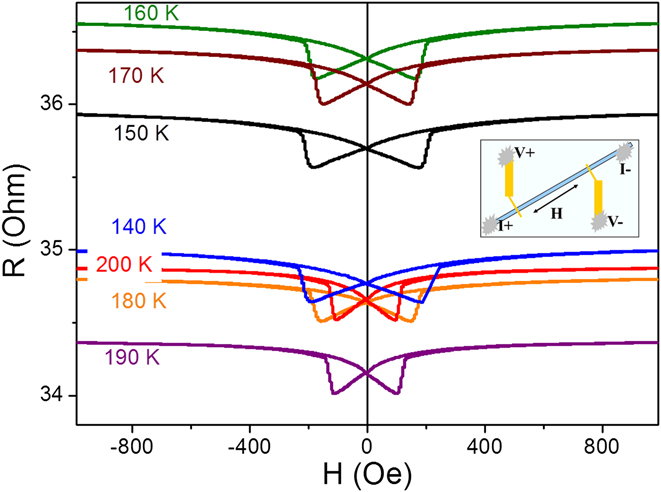
The magnetoresistance (MR) of V2O3 (100 nm)/Ni (15 nm) bilayers is shown in Fig. 11. For the measurement, 40 μm wide bars were etched in the film using standard photolithographic techniques. Since the resistivity of V2O3, even in the metallic phase, is higher than the resistivity of the FM layer, the majority of the current in the film was transmitted through the metallic FM and capping layers. Therefore the anisotropic magnetoresistance (AMR) reflects the switching fields of the FM layer. After the sample was cooled to 4.2 K in 1 kOe positive magnetic field, the MR was measured at different monotonically increasing temperatures. Figure 11 shows the field dependence of resistance at different temperatures. For each temperature there are two curves corresponding to different magnetic field sweep directions.
MR measurements at different temperatures in V2O3 (100 nm)/Ni (15 nm). Prior to the measurements, the sample was cooled from 300 K to 4.2 K with an applied field of 1000 Oe. The inset shows the geometry used in the measurement.

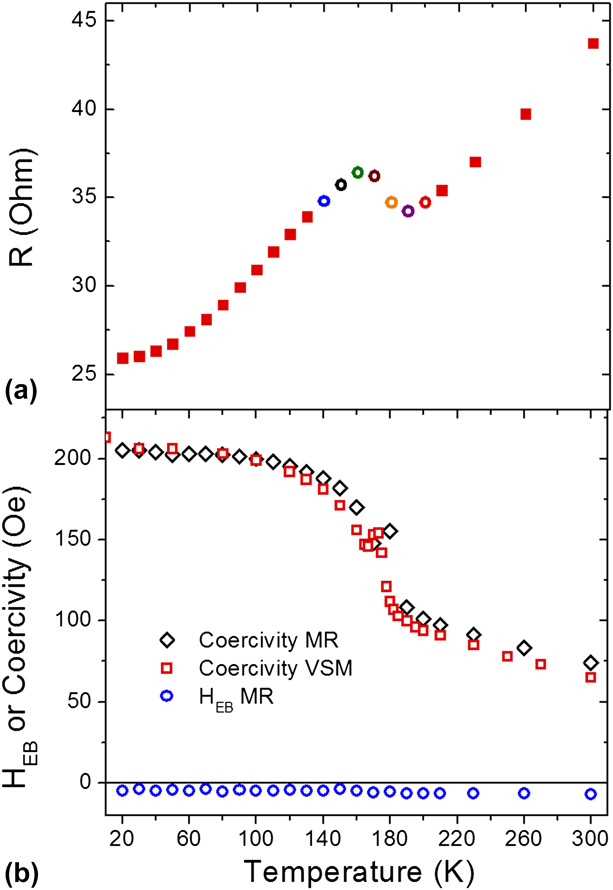
Figure 12(a) shows the saturated resistance (H = 1000 Oe) as a function of the temperature. Although the temperature dependence of the resistance is dominated by the Ni layer, it is still possible to observe the changes due to the V2O3 MIT. Instead of a monotonic linear dependence of the resistance with the temperature, the resistivity drops in the 160–190 K range similar to Fig. 7. At 140, 180, and 200 K, the resistances are close to each other [Figs. 9 and 10(a)]. However, the values of the coercivity at these temperatures are different (Fig. 12). The temperature dependence of the exchange bias field (H EB) and coercivity for V2O3 (100 nm)/Ni (15 nm) bilayers is plotted in Fig. 12(b). The bilayer MR is symmetric around zero fields at all temperatures (Fig. 11), i.e., H EB is zero. H EB plotted in Fig. 12(b) appears slightly below the zero line due to a constant experimental offset, but no change is observed at the AF transition. This indicates again the absence of EB in the samples as observed from the magnetic hysteresis. The coercivity extracted from MR measurements and VSM magnetometry is in good quantitative agreement. Figure 12(b) shows a coercive field behavior different from the sample discussed in Fig. 7 in that no coercivity peak is observed. The reason for this can be correlated with a different sample morphology, since the samples were grown at different times in different batches under slightly different conditions. However, it is possible to observe a small spike in the coercivity at 175–180 K. The correlation between the sample morphology and the maximum in coercivity will be discussed in Sec. IV.
(a) Resistance versus temperature at 1 kOe. The empty circles correspond to the MR measurements shown in Fig. 11. (b) Coercivity (and exchange bias field HEB blue circles) versus temperature extracted from MR (black diamonds) and VSM (red squared) measurements.

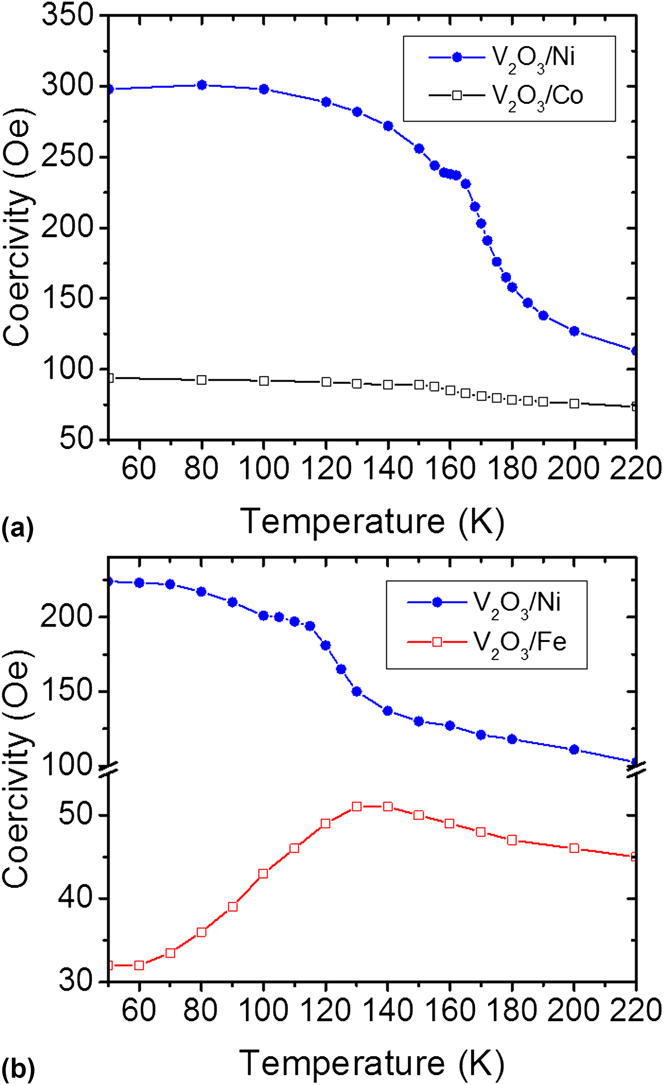
A final possibility of tuning the coercivity enhancement is illustrated by using different magnetic materials. Figure 13 shows a comparison between different elemental FM deposited on V2O3. If Co is used instead of Ni, the effect is substantially smaller due to the higher saturation magnetization and the lower magnetostriction coefficient of Co. The magnetostriction coefficient of Fe has the opposite sign of Ni, which leads to a decrease in coercivity at lower temperatures due to the SPT (Fig. 13). The two samples of V2O3/Ni shown in Fig. 13 were grown in different sets and indicate the spread in transition temperature and absolute value of coercivity depending on the individual sample morphology.
Coercivity behavior of V2O3/FM bilayer with FM = Ni, Co (a) and Fe (b).

IV. LENGTH-SCALE COMPETITION BETWEEN MAGNETIC AND STRUCTURAL DOMAINS
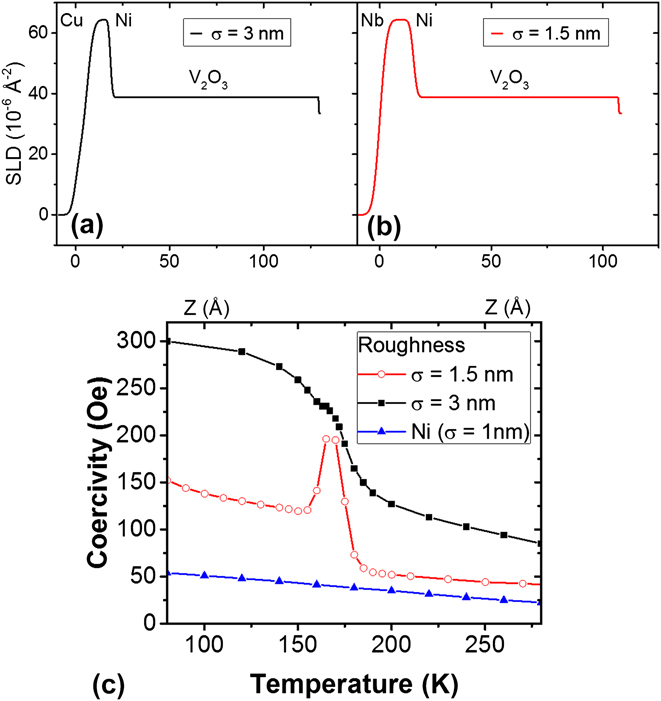
A comparison between different bilayers grown under slightly different conditions showed that the maximum coercivity is strongly influenced by the morphology of the V2O3/Ni interface. Reference de la Venta, Wang, Saerbeck, Ramírez, Valmianski and Schuller63 The morphologies reported here have been investigated with atomic force microscopy (AFM) and x-ray reflectometry (XRR) (Fig. 14). A 1.5 nm interface roughness has been reported for the sample showing the peak in the coercivity (Fig. 7), Reference Wu, Chai, Zhou, Zhang, Kitamura and Zhou61 while no peak in coercivity is observed in a sample with 3 nm interface roughness (Fig. 12). The roughness values were extracted from surface height line profiles across the images [Figs. 14(a) and 14(b)] and from fitting the reflectometry data to a slab model [Figs. 14(c) and 14(d)]. Large terraces of the order of a few 100 nm are observed for the sample which exhibits the peak in H C. In contrast, no terracing is observed in the sample which also does not show the drastic coercivity enhancement. Material density profiles obtained from the XRR fitting are shown in Figs. 15(a) and 15(b). The difference in the chemical depth profile of the samples is small, but leads to drastic differences in the magnetic behavior. The comparison between AFM and XRR shows that the roughness is not restricted to the surface of the sample, but indeed stems from the interface between V2O3 and Ni. Therefore, the determining factor is the surface of the oxide which can be modified during growth.
(a, b) Surface morphology obtained from AFM of samples with 3 nm (a) and 1.5 nm (b) mean surface roughness. (c, d) XRR and fits of the samples with 3 nm (c) and 1.5 nm (d) V2O3/Ni root mean square interface roughness.

(a, b) Scattering length density profiles (SLD) obtained from the fits of the XRR data. (c) Coercivity of the samples with 3 nm and 1.5 nm interface roughness in comparison to a Ni film grown directly on the Al2O3 substrate.

Figure 15(c) compares the coercivity of two V2O3/Ni bilayers with different interface roughness and a Ni film. For the case of V2O3/Ni bilayer with lower roughness and large terraces, the high-temperature values for the coercivity are close to the values of a Ni film. Samples with a higher roughness have a higher coercivity and do not show the coercivity maximum in the middle of the transition. This sensitivity to the roughness and lateral morphology of the V2O3/Ni interface indicates a length-scale competition between the structural domains of V2O3 and the magnetic domains of Ni. This competition is caused by the nanoscale phase coexistence of metallic hexagonal and insulating monoclinic phases during the MIT and SPT, Reference Qazilbash, Tripathi, Schafgans, Kim, Kim, Cai, Holt, Maser, Keilmann, Shpyrko and Basov78,Reference Guénon, Scharinger, Siming, Ramírez, Koelle, Kleiner and Ivan89–Reference Qazilbash, Brehm, Chae, Ho, Andreev, Kim, Yun, Balatsky, Maple, Keilmann, Kim and Basov91 whose relative volume and surface area vary with temperature. Due to the nucleation of insulating domains with decreasing temperature from above the SPT, small areas of the Ni layer become strained and therefore produce the increased H C below T c. Furthermore, strain is induced locally by the underlying V2O3 and the phase coexistence leads to the formation of a boundary between the stressed and relaxed Ni. Reference de la Venta, Wang, Saerbeck, Ramírez, Valmianski and Schuller63,Reference Guénon, Scharinger, Siming, Ramírez, Koelle, Kleiner and Ivan89 Upon magnetization reversal, this boundary effectively acts as a pinning center for domain wall motion. For samples with lower roughness the Ni magnetic domains have sizes larger than the V2O3 domains. Thus, the V2O3 phase coexistence creates additional magnetic domains, domain walls, and pinning in the Ni film. The combination of these three effects produces a sharp increase in the coercivity, showing a maximum value when the phase coexistence is also maximum, i.e., in the middle of the transition. Reference de la Venta, Wang, Saerbeck, Ramírez, Valmianski and Schuller63 In the case of rougher samples, the Ni domains are smaller and less additional domain walls are created by the V2O3 SPT. Therefore, no peak is observed in the coercivity in the middle of the transition.
A micromagnetic model was developed using magnetic domains with different lateral extensions produced by the V2O3 and Ni crystallographic grains. Reference de la Venta, Wang, Saerbeck, Ramírez, Valmianski and Schuller63 A good agreement between data and simulation 92 is achieved only by adjusting the width and additional anisotropies due to stress at the boundary. This highlights the importance of the lateral length scales in magnetic hybrid structures, here caused by the phase coexistence of a first-order transition. In addition to showcasing the importance of lateral inhomogeneities, the sharp peak observed in smooth samples may be important in applications requiring high temperature stability. The 4-fold increase occurs over a narrow temperature range and is fully reversible.
V. CONCLUSION
This review shows a method for tuning magnetic properties of materials by magnetoelastic coupling in hybrids between dissimilar materials. Thin film heterostructures offer a wide range of tunability by choice of materials with individually favorable parameters. Magnetoelastic coupling is a general phenomenon not restricted to a single materials class. The control of magnetization can be achieved by using not only ferroelectric materials but also materials that undergo a MIT. The observed changes in coercivity within V2O3/Ni and VO2/Ni bilayers are higher than reported in other heterostructures using ferroelectric BaTiO3 or multiferroic BiFeO3. In addition, the changes are fully reversible and show a typical hysteresis of a first-order transition. The simultaneous change of resistance and structure in vanadium oxides eliminates the need for high electric fields to tune the magnetic properties. The magnitude of the induced changes can be adjusted with different FM materials, their thickness, or by including spacer layers. In addition, a lateral length-scale competition is observed due to the nanoscale phase coexistence during the first-order phase transition. A peak in the coercivity is observed based on the lateral disorder due to the phase coexistence in V2O3. The coercivity changes of Ni are among the largest observed for any FM material. The variable temperature either above or well below room temperature, the narrow temperature window, and the full reversibility of the effect make interfacial strain coupling in vanadium-oxide-based devices potentially interesting for future technological applications. For example, the VO2 transition temperature being just above room temperature makes the material interesting for heat-assisted magnetic recording because the coercivity can be varied in a narrow temperature window. Absolute coercivity values can be chosen by the appropriate FM material. Further applications can be imagined in sensor technologies since the hybrid material connects resistive, thermal, and magnetic properties. The effect presented here is general and a range of materials combinations can be imagined with tailored properties for the desired application.
ACKNOWLEDGMENTS
The magnetism aspects of this work were supported by the Office of Basic Energy Science, U.S. Department of Energy, BES-DMS funded by the Department of Energy's Office of Basic Energy Science, DMR under grant DE FG03 87ER-45332 and the oxide related science by the AFOSR (Grant No. FA9550-12-1-0381).