


1 Introduction
The Richtmyer–Meshkov instability (RMI) (Richtmyer Reference Richtmyer1960; Meshkov Reference Meshkov1969) occurs as a shock wave passes across a corrugated interface separating two fluids of different properties. The characteristics of inducing intensive fluid mixing make RMI a crucial but attractive issue in the fields of inertial confinement fusion (Lindl et al. Reference Lindl, Landen, Edwards, Moses and Team2014), supernova explosions (Arnett et al. Reference Arnett, Bahcall, Kirshner and Woosley1989) and supersonic combustion (Yang, Kubota & Zukoski Reference Yang, Kubota and Zukoski1993). In the past few decades, extensive studies have been performed on the RMI and several comprehensive reviews have been presented (Zabusky Reference Zabusky1999; Brouillette Reference Brouillette2002; Ranjan, Oakley & Bonazza Reference Ranjan, Oakley and Bonazza2011; Luo et al. Reference Luo, Zhai, Si and Yang2014).
As a fundamental configuration, the RMI on a single-mode interface has received widespread attention. The pioneering analysis of such problems was performed by Richtmyer (Reference Richtmyer1960) for the linear stage. Since then, numerous models have been proposed to predict the perturbation growth at the linear stage by considering more complex situations such as compressibility (Wouchuk Reference Wouchuk2001), three-dimensionality (Zhang & Sohn Reference Zhang and Sohn1999; Luo, Wang & Si Reference Luo, Wang and Si2013) and density ratio (Meyer & Blewett Reference Meyer and Blewett1972). As the perturbation amplitude is comparable to the wavelength, nonlinearity becomes evident and hence produces a quick decrease in the growth rate. To predict the nonlinear growth, Zhang & Sohn (Reference Zhang and Sohn1996) proposed a 4th-order weakly nonlinear solution based on the perturbation expansion, and the model validity range was then extended by a Padé approximation (Zhang & Sohn Reference Zhang and Sohn1997). A similar approach was adopted by Vandenboomgaerde, Gauthier & Mügler (Reference Vandenboomgaerde, Gauthier and Mügler2002), who achieved an 11th-order solution by obtaining the greatest number of secular terms in the asymptotic expansion. However, these high-order models were demonstrated to be applicable for instability growth only up to the early nonlinear stage (Jacobs & Krivets Reference Jacobs and Krivets2005; Mariani et al. Reference Mariani, Vandenboomgaerde, Jourdan, Souffland and Houas2008). The developments of the bubble and spike at the late nonlinear stage exhibit an asymptotic behaviour, and can be reasonably predicted by potential-flow models (Goncharov Reference Goncharov2002; Sohn Reference Sohn2003). So far, instability development at the intermediate nonlinear stage has not yet been well understood, and the theoretical gap for this stage was empirically bridged by matching the linear, weakly nonlinear and potential-flow models (Sadot et al. Reference Sadot, Erez, Alon, Oron, Levin, Erez, Ben-Dor and Shvarts1998; Mikaelian Reference Mikaelian2003).
An elaborate experiment is greatly desired to examine and improve the existing theories. Because the RMI is highly sensitive to the initial conditions, accurate control and characterization of the initial interface are necessary in any experiment (Mariani et al. Reference Mariani, Vandenboomgaerde, Jourdan, Souffland and Houas2008; Vandenboomgaerde et al. Reference Vandenboomgaerde, Souffland, Mariani, Biamino, Jourdan and Houas2014). Significant efforts have been made to create density inhomogeneities with a well-defined configuration and, generally, the developed techniques can produce interfaces of two types: discontinuous interfaces (Meshkov Reference Meshkov1969; Brouillette & Bonazza Reference Brouillette and Bonazza1999; Jourdan & Houas Reference Jourdan and Houas2005; Mariani et al. Reference Mariani, Vandenboomgaerde, Jourdan, Souffland and Houas2008) and diffuse interfaces (Jacobs & Krivets Reference Jacobs and Krivets2005; Balakumar et al. Reference Balakumar, Orlicz, Ristorcelli, Balasubramanian, Prestridge and Tomkins2012; Weber et al. Reference Weber, Haehn, Oakley, Rothamer and Bonazza2012). A nitrocellulose membrane attached to a grid support of a designed shape has been widely used to sharply separate two different gases (Erez et al. Reference Erez, Sadot, Oron, Erez, Levin, Shvarts and Ben-Dor2000; Mariani et al. Reference Mariani, Vandenboomgaerde, Jourdan, Souffland and Houas2008; Fontaine et al. Reference Fontaine, Mariani, Martinez, Jourdan, Houas, Vandenboomgaerde and Souffland2009). It was found that the membrane fragments are carried with the gas flow and thus largely suppress the instability growth, especially for a light/heavy case (Jourdan & Houas Reference Jourdan and Houas2005). Meanwhile, small-wavelength perturbations introduced by the supporting grid considerably disrupt the roll-up structures of the spike (Vandenboomgaerde et al. Reference Vandenboomgaerde, Souffland, Mariani, Biamino, Jourdan and Houas2014). To avoid the influences of the membrane and grid, a non-intrusive alternative was proposed, which generates gaseous interfaces with a continuous density profile (Jones & Jacobs Reference Jones and Jacobs1997; Jacobs & Krivets Reference Jacobs and Krivets2005). However, it was reported that the diffusion layer significantly suppresses the instability from the very beginning. Moreover, the high ‘viscosity’ at the transition layer greatly reduces the growth of small-wavelength perturbations, which were supposed to arise at the nonlinear stage of a discontinuous RMI, and hence causes an overdevelopment of the roll-up structure (Jacobs & Krivets Reference Jacobs and Krivets2005; Vandenboomgaerde et al. Reference Vandenboomgaerde, Souffland, Mariani, Biamino, Jourdan and Houas2014). Thus, experimental data of a diffuse RMI are not suitable to validate the existing models.
The soap-film technique has been demonstrated to be a promising method to form discontinuous interfaces with no supports (Ranjan et al.
Reference Ranjan, Oakley and Bonazza2011; Ding et al.
Reference Ding, Si, Chen, Zhai, Lu and Luo2017), and good agreements were obtained among the experiments, simulations and theories (Haas & Sturtevant Reference Haas and Sturtevant1987; Layes, Jourdan & Houas Reference Layes, Jourdan and Houas2009; Ranjan et al.
Reference Ranjan, Oakley and Bonazza2011; Zhai et al.
Reference Zhai, Si, Luo and Yang2011; Ding et al.
Reference Ding, Si, Chen, Zhai, Lu and Luo2017). It was indicated that gas diffusion across the interface can be largely suppressed and soap droplets after the shock impact could absorb very little energy from the fluids. However, a soap film has seldom been used to form a density interface other than the spherical or cylindrical bubble, mainly due to the difficulty in controlling its shape. In this work, a novel soap-film technique is developed to form gaseous interfaces with a well-characterized discontinuous configuration. Four single-mode air/
 $\text{SF}_{6}$
interfaces with different amplitudes and wavelengths are successfully generated and their interactions with a planar shock are recorded by high-speed schlieren photography. The experimental results will demonstrate a large reduction of the small-wavelength perturbations and the diffusion layer at the initial interfaces generated. Based on the high-fidelity results, a strong validation of the linear and nonlinear models is available by comparing the experimental amplitude variations with model predictions for the bubble and spike. Specifically, spectral analyses of the clear interfacial morphologies captured are applicable, which facilitates a detailed examination of the weakly nonlinear behaviour of the single-mode RMI.
2 Experimental methods
Schematic of the single-mode interface formation. (a) Two transparent devices with sinusoidal-shaped boundaries. (b) The soap film interface made by a rectangular frame.
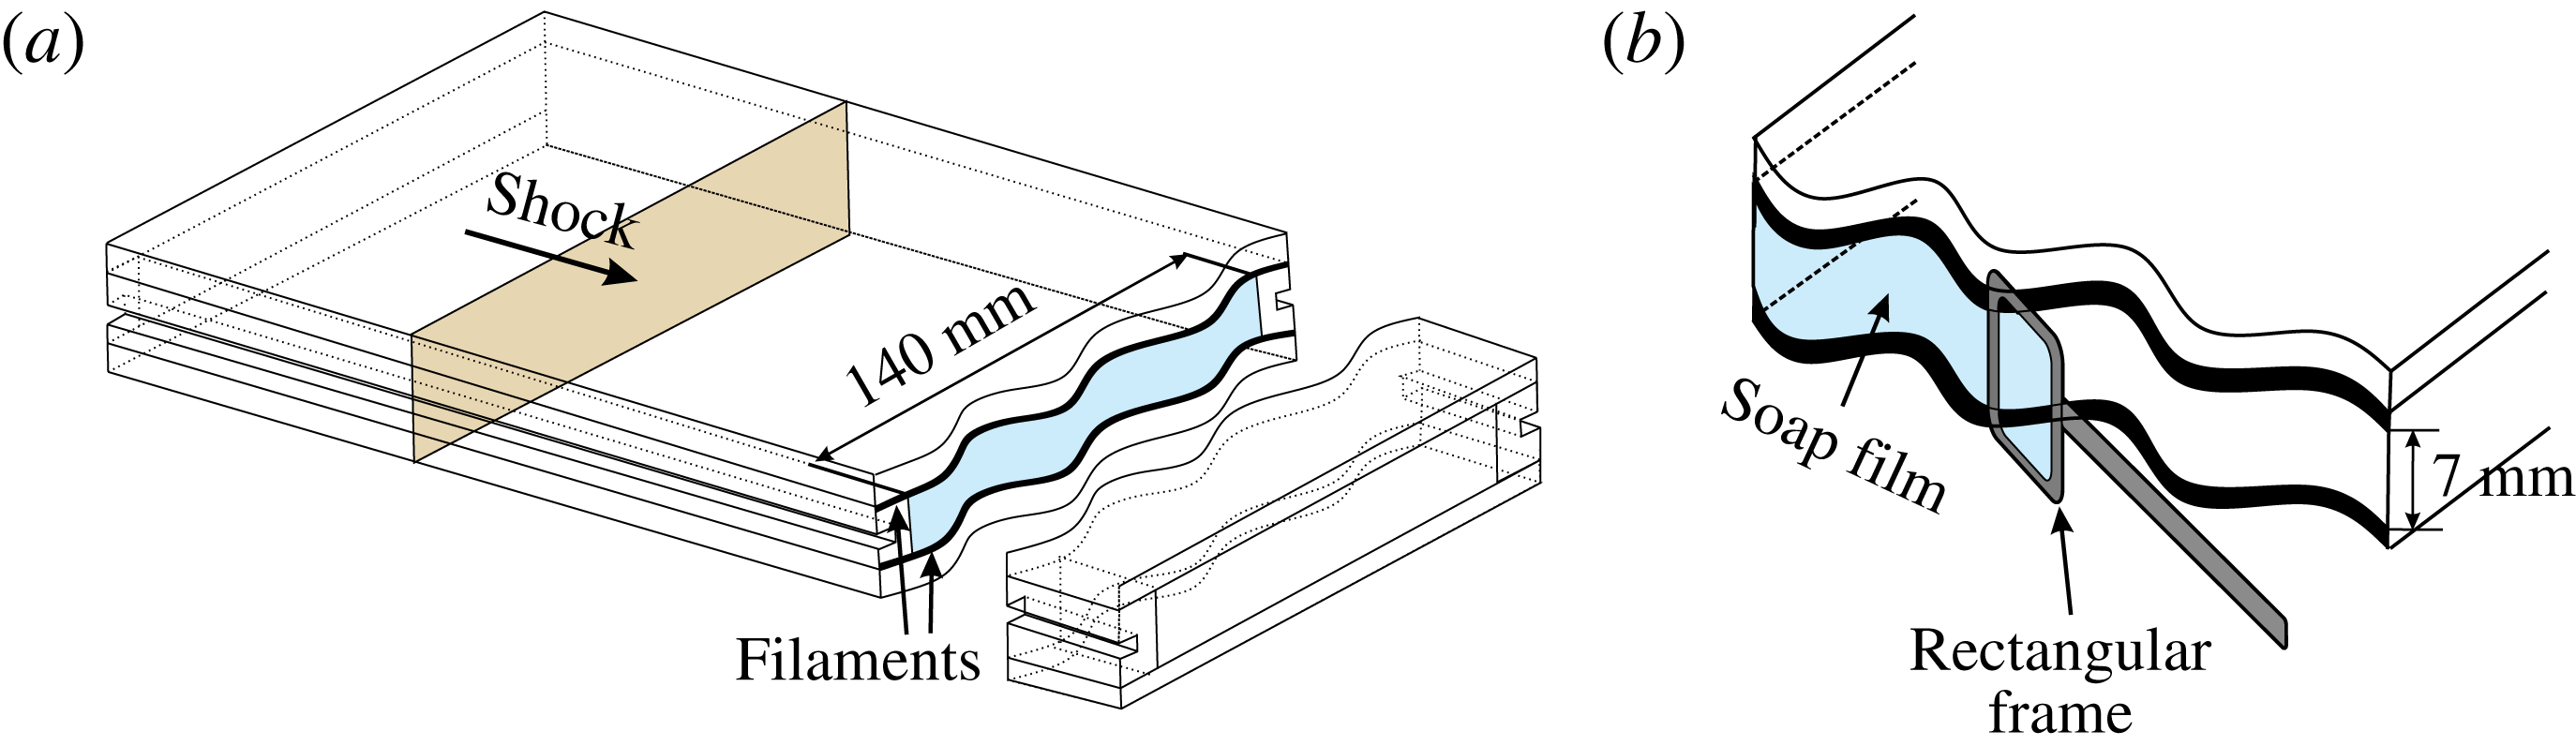
As shown in figure 1, two transparent devices with an inner height of 7 mm and a width of 140 mm are first manufactured using Acrylic plates (3 mm thick). Their adjacent boundaries are carefully engraved to be of a sinusoidal shape. Two thin filaments with the same sinusoidal shape are normally attached to the inner surfaces of the upper and lower plates, respectively, to produce a single-mode constraint. The filaments are 0.3 mm thick and thus have a negligible influence on the flow. Prior to the interface formation, the sinusoidal filaments are first thoroughly wetted by soap solution (78 % distilled water, 2 % sodium oleate and 20 % glycerine by mass). Then, a small rectangular frame with moderate soap solution dipped on its borders is pulled along the sinusoidal filaments and, subsequently, a single-mode soap film is generated on the surface of the device, as illustrated in figure 1(b). To form an air/
 $\text{SF}_{6}$
interface, the air in the test section is first removed and then replaced by
 $\text{SF}_{6}$
. After that, the framework (the longer one) with a sinusoidal soap film on its surface is slowly inserted into the test section. Subsequently, the auxiliary framework (the shorter one) is gently inserted until it is perfectly connected with the longer device. During this process,
 $\text{SF}_{6}$
gas is slowly injected to the test section to preserve a high concentration of the test gas. In each run, the purity of
 $\text{SF}_{6}$
is monitored in real time by a gas concentration detector.
Experiments are conducted in a horizontal shock tube with a rectangular cross-section of 140 mm
 $\times$
7 mm for its test section. The incident shock Mach number measured by two piezoelectric transducers is
 $1.22\pm 0.01$
. The flow field is visualized by high-speed schlieren photography. The frame rate of the high-speed video camera (FASTCAM SA5, Photron Limited) is set to be 50 000 f.p.s., and the exposure time is
 $1~\unicode[STIX]{x03BC}\text{s}$
. The spatial resolution of the schlieren image is
 $0.27~\text{mm}~\text{pixel}^{-1}$
. The ambient pressure and temperature are 101.3 kPa and 299.5 K, respectively.
3 Results and discussions
Four sinusoidal interfaces with different values of initial amplitude (
 $a_{0}$
) and wavelength (
 $\unicode[STIX]{x1D706}$
) are realized in the shock-tube experiments. The detailed parameters corresponding to the initial conditions for each case (denoted by
 $\unicode[STIX]{x1D706}$
–
 $a_{0}$
) are listed in table 1. The Atwood number is defined as
 $A=(\unicode[STIX]{x1D70C}_{2}-\unicode[STIX]{x1D70C}_{1})/(\unicode[STIX]{x1D70C}_{2}+\unicode[STIX]{x1D70C}_{1})$
, with
 $\unicode[STIX]{x1D70C}_{2}$
and
 $\unicode[STIX]{x1D70C}_{1}$
being the densities of gases on the right-hand and left-hand sides of the interface, respectively. Note a high concentration of
 $\text{SF}_{6}$
is preserved for all cases, which ensures good repeatability.
Parameters of the initial conditions for different cases (
 $\unicode[STIX]{x1D706}$
–
 $a_{0}$
) with
 $a_{0}$
and
 $\unicode[STIX]{x1D706}$
standing for the preshock amplitude and wavelength of the sinusoidal interface, respectively, and
 $A^{+}$
for the postshock Atwood number.
 $v_{i}$
,
 $v_{t}$
and
 $\unicode[STIX]{x0394}v$
are respectively the speeds of the incident shock, the transmitted shock and the shocked interface. ‘mfra (
 $\text{SF}_{6}$
)’ denotes the mass fraction of the test gas.

Evolutions of single-mode air/
 $\text{SF}_{6}$
interfaces impacted by a planar shock. IS, incident shock; II, initial interface; TS, transmitted shock; SI, shocked interface. The numbers in the schlieren images are in units of
 $\unicode[STIX]{x03BC}\text{s}$
. The IS travels from left to right with a Mach number of
 $1.22\pm 0.01$
. Note that the original images are cropped such that only the central part (160 mm in length and 80 mm in width) is shown.
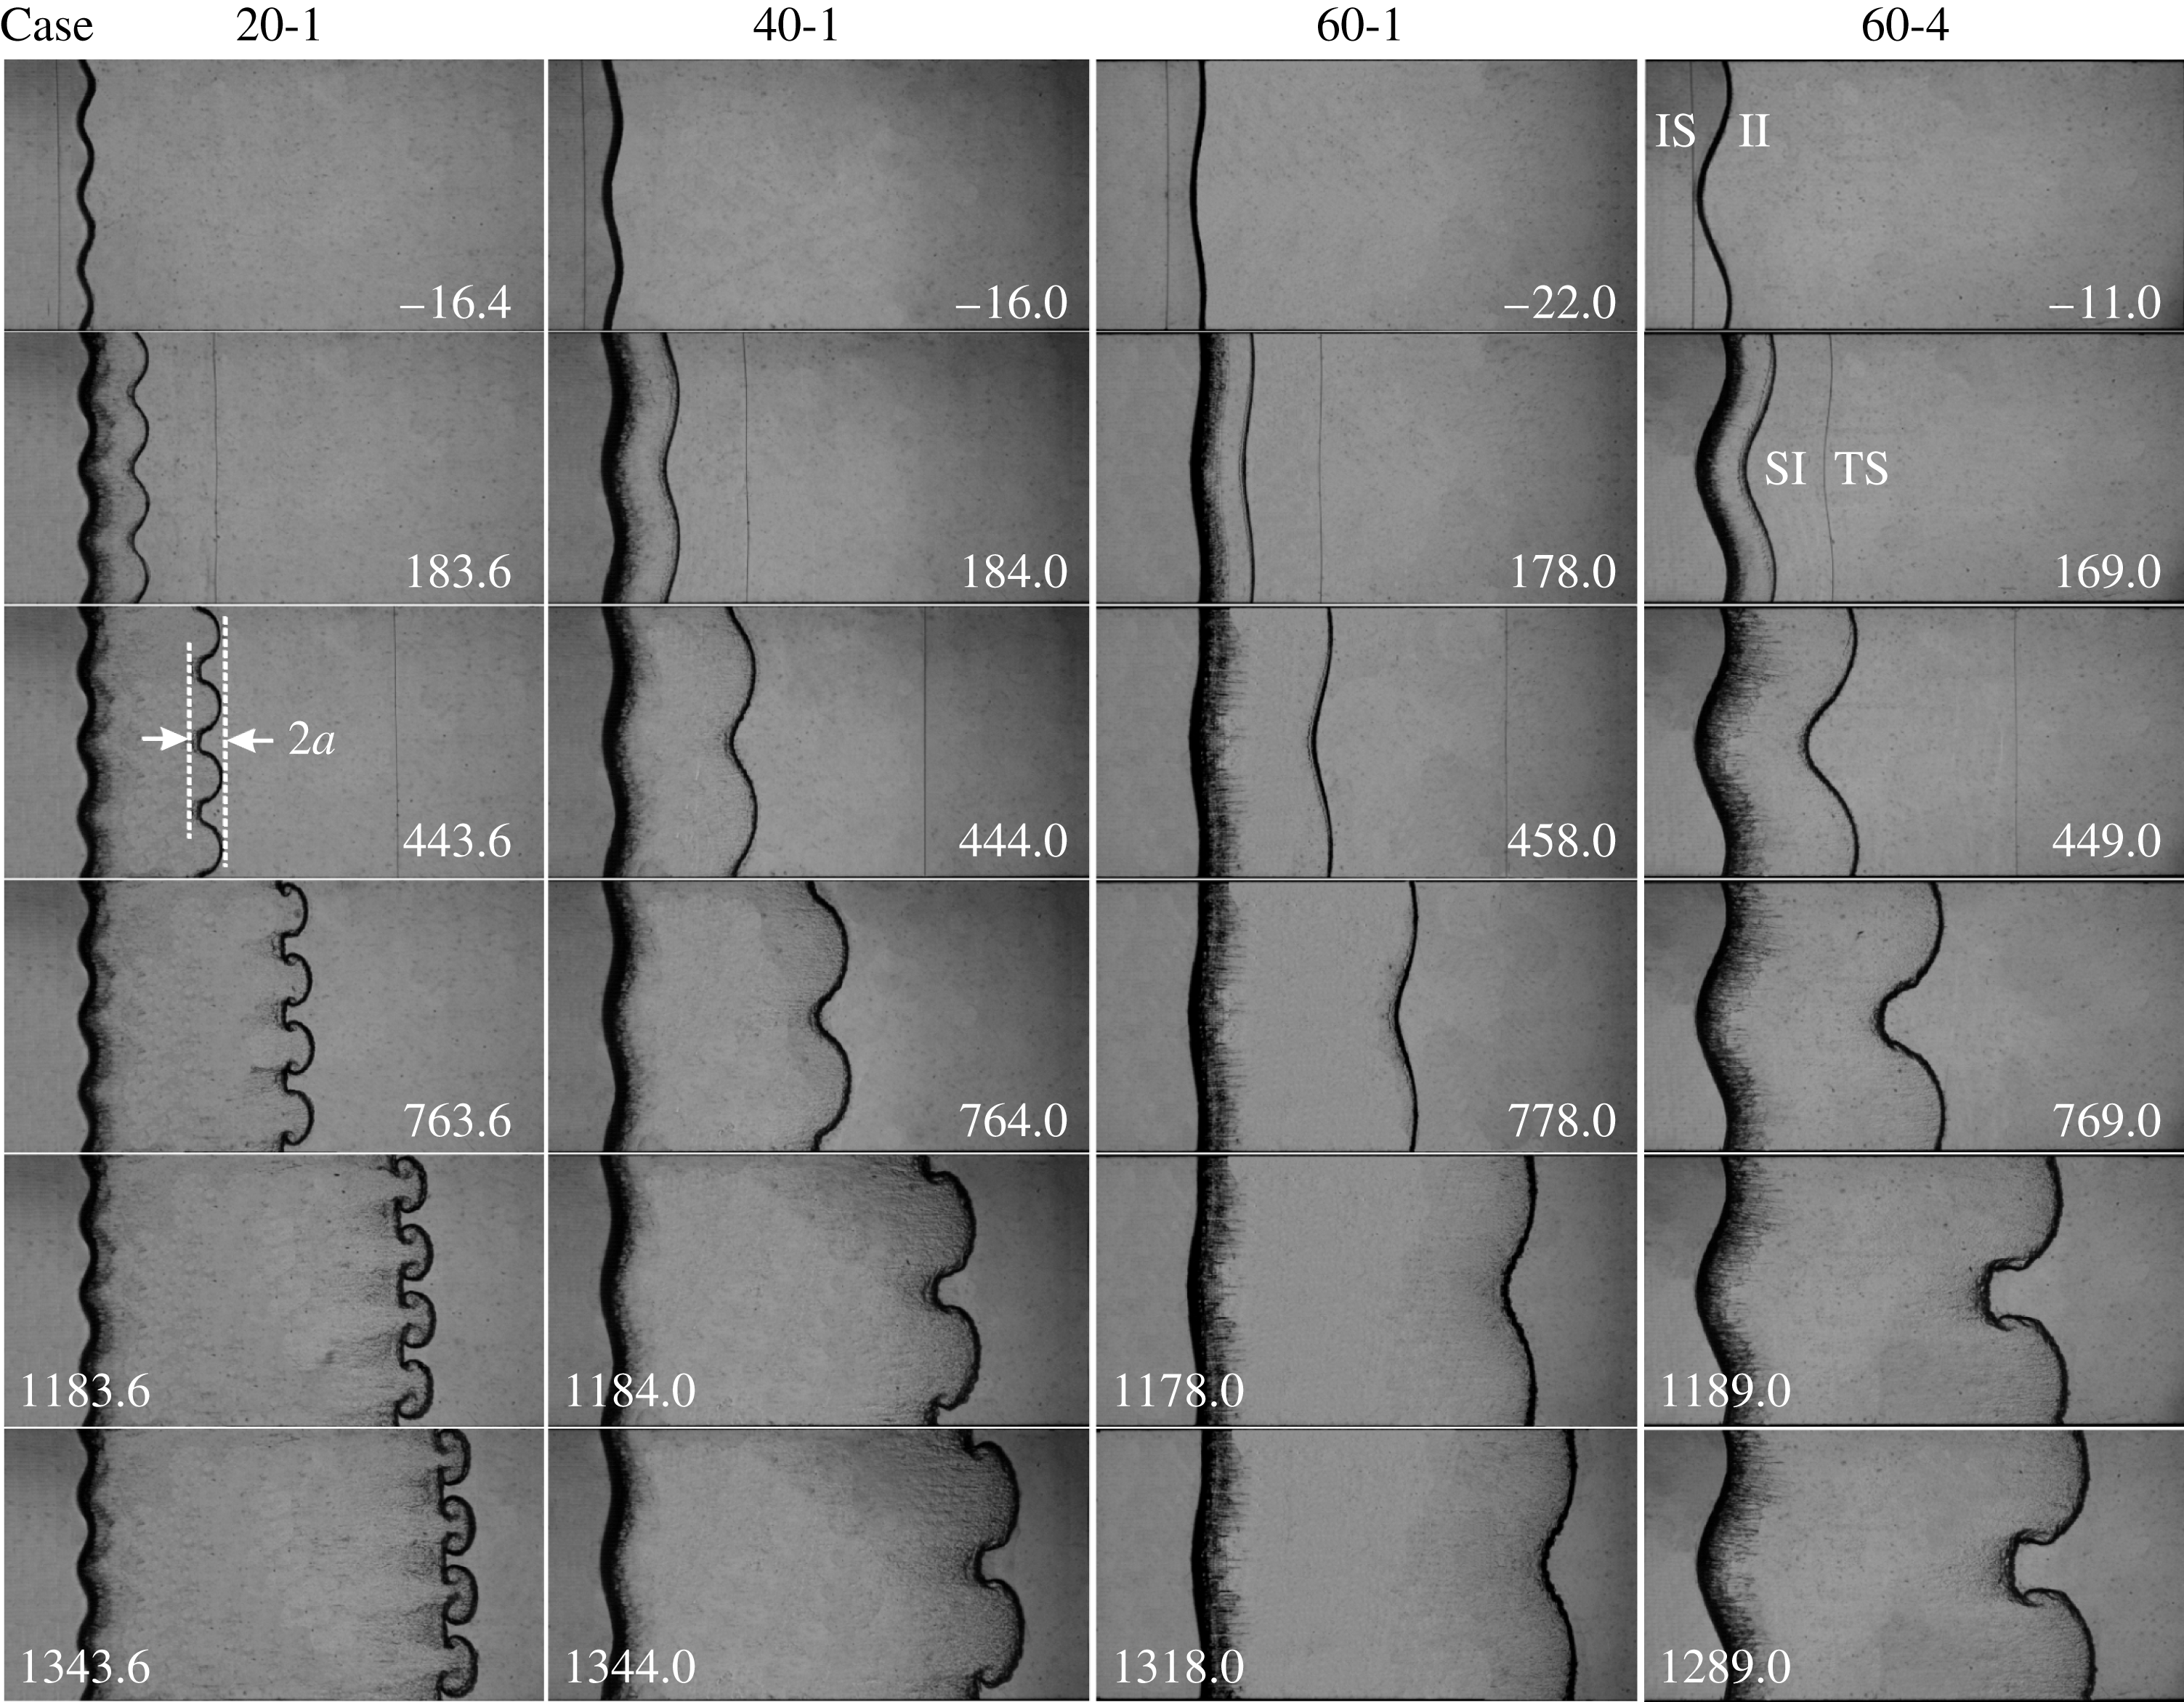
Evolutions of the perturbed interface and wave pattern for the four sinusoidal air/
 $\text{SF}_{6}$
interfaces are well captured, as shown in figure 2. Compared to previous experimental results (Sadot et al.
Reference Sadot, Erez, Alon, Oron, Levin, Erez, Ben-Dor and Shvarts1998; Jourdan & Houas Reference Jourdan and Houas2005; Vandenboomgaerde et al.
Reference Vandenboomgaerde, Souffland, Mariani, Biamino, Jourdan and Houas2014), the images obtained in the present work are much more distinct, allowing the interface morphology to be clearly seen. We take the 60-4 case as an example to discuss the detailed evolution process. The temporal origin in this work is defined as the moment when the incident shock (IS) arrives at the mean position of the sinusoidal interface. At the beginning (
 $-11~\unicode[STIX]{x03BC}\text{s}$
), the sinusoidal interface looks quite thick due to the superposition of the two sinusoidal filaments on the windows. As the IS penetrates through the initial interface (II), it bifurcates into a downstream-moving transmitted shock (TS) and an upstream-moving reflected shock which soon exits the visualization window. After the shocked interface (SI) leaves its original position, a very clean and clear sinusoidal density inhomogeneity (
 $169~\unicode[STIX]{x03BC}\text{s}$
) can be observed, which demonstrates that the initial interfacial imperfections such as small-wavelength perturbations (Vandenboomgaerde et al.
Reference Vandenboomgaerde, Souffland, Mariani, Biamino, Jourdan and Houas2014), diffusion layers (Jacobs & Krivets Reference Jacobs and Krivets2005) and three-dimensionality (Luo et al.
Reference Luo, Wang and Si2013) are largely eliminated in the present experiments. Note that these imperfections are unavoidable in previous membrane and membraneless experiments. Benefiting from such a perfect initial interface, we are able to obtain a high-fidelity instability evolution process. As the SI moves forward, its shape changes gradually due to the induction of baroclinic vorticity along the interface, resulting in a continuous increment of the perturbation amplitude. At the early stage, the interface is symmetric and maintains a sinusoidal shape (
 $449~\unicode[STIX]{x03BC}\text{s}$
), indicating a linear growth of the instability. Afterwards, nonlinearity becomes pronounced and high-mode perturbations are generated. Thus, the symmetry property of the single-mode interface breaks and interpenetrating spike and bubble structures appear (
 $769~\unicode[STIX]{x03BC}\text{s}$
). Later, the spike starts to roll up and a pair of small vortices arises on its shoulder (
 $1189~\unicode[STIX]{x03BC}\text{s}$
). It should be pointed out that the interfacial morphology captured here, especially the roll-up structure, is physically more accurate than previous membrane or membraneless counterparts. Specifically, for the previous membrane experiments, the instability development is greatly suppressed by the membrane fragments from the very beginning. Moreover, the roll-up structure can be easily destroyed by the small-wavelength perturbations introduced by the supporting grid. In contrast, in the membraneless cases, the roll-ups overdevelop due to the dissipation of the small harmonics by the diffusion interface layer, as has been demonstrated in a careful comparative study between simulation and experiment (Vandenboomgaerde et al.
Reference Vandenboomgaerde, Souffland, Mariani, Biamino, Jourdan and Houas2014). Hence, we state that the instability development process presented here can represent, to the most accurate degree, the development of a pure single-mode RMI to date. As we can see, when the initial amplitude is increased, the instability growth clearly becomes quicker. In particular, for the 60-1 case with a very small ratio of amplitude over wavelength, the interface presents a sinusoidal shape during the whole experimental time, indicating a very long linear stage. This case encourages us to perform a careful examination of the linear model. For interfaces with a shorter wavelength (cases 40-1 and 20-1), the instability enters the nonlinear stage in a much shorter time, and visible spike and bubble structures can be observed. These high-quality images for different single-mode interfaces allow us to extract reliable experimental data corresponding to the perturbation growth of the single-mode RMI, and hence the previous theoretical models can be thoroughly examined. Note that the boundary layer of the postshock flow is approximately 0.2 mm during the experimental time, and thus has negligible influence on the interface evolution.
Comparisons between experiments and model predictions for (a) the interface amplitude (
 $\unicode[STIX]{x1D6FC}$
) and (b) the amplitudes of bubble and spike (
 $\unicode[STIX]{x1D6FC}_{b/s}$
). Symbols stand for the experimental results and lines stand for the model predictions. Experimental results from Collins & Jacobs (Reference Collins and Jacobs2002) and Mariani et al. (Reference Mariani, Vandenboomgaerde, Jourdan, Souffland and Houas2008) are compared with the current results and theoretical predictions. Nonlinear models are Sad (Sadot et al.
Reference Sadot, Erez, Alon, Oron, Levin, Erez, Ben-Dor and Shvarts1998), DR (Dimonte & Ramaprabhu Reference Dimonte and Ramaprabhu2010), Mik (Mikaelian Reference Mikaelian2003), ZS (Zhang & Sohn Reference Zhang and Sohn1997), ZG (Zhang & Guo Reference Zhang and Guo2016) and Van (Vandenboomgaerde et al.
Reference Vandenboomgaerde, Gauthier and Mügler2002).

Temporal variations of the perturbation amplitude for different cases are plotted in figure 3(a), where the predictions of the existing theoretical models as well as the previous experimental results are also given for comparison. The dimensionless time is normalized based on
 $\unicode[STIX]{x1D70F}=kv_{0}(t-t^{\ast })$
, with
 $k$
being the wavenumber,
 $v_{0}$
being the impulsive growth rate of Richtmyer (Richtmyer Reference Richtmyer1960) and
 $t^{\ast }$
being the characteristic time for the startup phase according to Lombardini & Pullin (Reference Lombardini and Pullin2009). The amplitude is scaled as
 $\unicode[STIX]{x1D6FC}=k(a-a_{0}^{\ast })$
, where
 $a_{0}^{\ast }$
is the corresponding amplitude at
 $t^{\ast }$
. In the experiments, the interface boundaries are measured by the central position of the material layer, and the error bars represent the thickness of the material layer in the images. Note that the assumption of a small ratio of amplitude over wavelength is satisfied in all cases. It has been found that the growth rate obtained in previous experiments is always below the prediction of the impulsive model (Richtmyer Reference Richtmyer1960), caused either by the membrane fragments or by the diffusion layer. Even though an adjustment of the impulsive model can reach a reasonable match with the experiment of a diffuse interface (Collins & Jacobs Reference Collins and Jacobs2002), a direct validation of the impulsive mode has never been given because of the experimental imperfections. As shown in figure 3(a), benefiting from the novel interface formation method, the instability development in the present experiments is largely free of influence from the membrane, and hence a much larger initial growth rate is achieved as compared to the result of Mariani et al. (Reference Mariani, Vandenboomgaerde, Jourdan, Souffland and Houas2008). It is also noticed that the quantitative data for each case acquired in one experimental run exhibit a much smaller scattering than the result of Collins & Jacobs (Reference Collins and Jacobs2002), and thus the growth rate for each case can be readily obtained by a linear fitting. Table 2 gives a detailed comparison of the growth rates measured from experiments with the linear model predictions for different cases. As we can see, the difference in the growth rate between experiments and predictions is fairly small and within the experimental error. This is the first direct validation of the impulsive model by experiments. Later, the linear growth rate saturates, and the growth rate reduces gradually. It is shown that the ZG model (Zhang & Guo Reference Zhang and Guo2016) provides the most accurate prediction of the perturbation growth from the early to nonlinear stages, whereas other models overestimate or underestimate the perturbation growth. The Van model (Vandenboomgaerde et al.
Reference Vandenboomgaerde, Gauthier and Mügler2002) gives a nice prediction for the early stage, but deviates very quickly when
 $\unicode[STIX]{x1D70F}>1.1$
. This finding confirms that this model indeed can achieve an accurate solution to very high order by attaining the greatest number of secular terms in the asymptotic expansion, but is only applicable for instability growth up to the early nonlinear stage, as stated by Jacobs & Krivets (Reference Jacobs and Krivets2005), Mariani et al. (Reference Mariani, Vandenboomgaerde, Jourdan, Souffland and Houas2008). We also note that in the previous experiment of Jacobs & Krivets (Reference Jacobs and Krivets2005), where a diffuse interface is employed, the Sad model (Sadot et al.
Reference Sadot, Erez, Alon, Oron, Levin, Erez, Ben-Dor and Shvarts1998) was found to be most applicable to the nonlinear growth. We argue that this coincidental agreement may be ascribed to the overdevelopment of the interface caused by the diffusion layer which dissipates the secondary instabilities appearing at the nonlinear stage.
Comparison of the linear growth rate between experimental measurement and prediction from the impulsive model (Richtmyer Reference Richtmyer1960). The units are
 $\text{m}~\text{s}^{-1}$
.

To more carefully examine the nonlinear behaviour, the amplitude histories for the bubble and spike are further compared. To separate the bubble from the spike, the movement of the unperturbed interface calculated based on one-dimensional shock dynamics with the initial conditions of each case is provided as a moving reference. As shown in figure 3(b), when the nonlinear stage starts, both the developments of the bubble (
 $\unicode[STIX]{x1D6FC}_{b}$
) and spike (
 $\unicode[STIX]{x1D6FC}_{s}$
) slow down quickly and then tend towards an asymptotic behaviour. In the RMI study, various models have been proposed to predict the asymptotic behaviours of the bubble and spike, but up to now the most accurate one has not yet been confirmed by experiment due to experimental imperfections. The reliable quantitative data here provide us a good opportunity to carefully check the performance of these models. The comparison between the experimental results with the model predictions illustrated in figure 3(b) indicates that all existing models can reasonably predict the bubble development from the early to the late nonlinear stages. However, for the spike development, only the recently developed models of Mikaelian (Reference Mikaelian2003) and Zhang & Guo (Reference Zhang and Guo2016) can give a reasonable prediction, whereas other models overestimate the perturbation growth from the beginning of the nonlinear stage. The main reason is that most of the previous nonlinear models, especially the potential models, are derived based on the characteristics of a bubble, and only simple processing is employed to extend the model to predict the spike development (Mikaelian Reference Mikaelian2008). The remarkable ability of the model of Zhang & Guo (Reference Zhang and Guo2016) in both bubble and spike predictions is attributed to its superior principles, i.e., the growth rate of both the bubble and spike is deduced based on the feature that all spikes and bubbles at any density ratio closely follow a universal curve in terms of scaled dimensionless variables.
Temporal variations of the perturbation amplitude of the first three harmonics. Symbols denote the present experimental results and lines represent the theoretical predictions of the ZS model (Zhang & Sohn Reference Zhang and Sohn1997) and the Van model (Vandenboomgaerde et al. Reference Vandenboomgaerde, Gauthier and Mügler2002).

The high-quality schlieren pictures facilitate an accurate extraction of the interfacial contours with a simple image-processing program such that minimum artificial uncertainties are introduced in the extracted interfacial morphologies. By performing a serial Fourier analysis of the interfacial contour, quantitative growths of the first (fundamental mode), second and third harmonics from the early to weakly nonlinear stages can be obtained. As displayed in figure 4, at the early stage (
 $\unicode[STIX]{x1D70F}<0.7$
), the fundamental mode undergoes a linear growth with time, and the growth rates for the second and third harmonics are far smaller. Later, the growth of the first harmonic slows down due to the nonlinearity and, concurrently, the perturbation of the second harmonic increases continuously to a considerable level. Note that throughout the duration of the experiment the perturbation amplitude of the third harmonic maintains a very small value, which implies that the energy of the basic mode is mainly transferred to the second harmonic at the weakly nonlinear stage. The present quantitative data provide a rare opportunity to examine the previous high-order nonlinear models. A comparison of the experimental data with the 4th-order nonlinear solutions of Vandenboomgaerde et al. (Reference Vandenboomgaerde, Gauthier and Mügler2002) and of Zhang & Sohn (Reference Zhang and Sohn1997) is also given in figure 4. Note that the model of Vandenboomgaerde et al. (Reference Vandenboomgaerde, Gauthier and Mügler2002) retains only the terms with highest power in the full perturbation theory, such that it can provide predictions of harmonics of very high order in an effective way. In contrast, the model of Zhang & Sohn (Reference Zhang and Sohn1997) uses fewer simplifications and can only give predictions of the first four modes. As we can see, a reasonable agreement between the experiments and the predictions is achieved. Both the model of Vandenboomgaerde et al. (Reference Vandenboomgaerde, Gauthier and Mügler2002) and the model of Zhang & Sohn (Reference Zhang and Sohn1997) are found to provide a very good and almost identical accuracy in predicting the growth of the first two modes at the early stage. However, it seems that the model of Zhang & Sohn (Reference Zhang and Sohn1997) is more robust in predicting the third-order harmonics due to the fewer simplifications used in this model. To the authors’ knowledge, this is the first direct validation of these two models in terms of the harmonic developments from the early to the weakly nonlinear stages. We also note that although the model of Vandenboomgaerde et al. (Reference Vandenboomgaerde, Gauthier and Mügler2002) shows a slightly worse performance in the prediction of the third-order mode, simplifications employed in the model derivation preserve the model’s applicability in predicting the development of harmonics of very high order (higher than fourth order), which is absent in the model of Zhang & Sohn (Reference Zhang and Sohn1997). Therefore, the simplified method for the full perturbation theory proposed by Vandenboomgaerde et al. (Reference Vandenboomgaerde, Gauthier and Mügler2002) facilitates calculations of the perturbation of higher-order terms, which is very useful to solve multi-mode interfacial instability.
4 Conclusions
The classic single-mode RMI is revisited in a well-controlled way such that the impulsive mode and nonlinear models are directly checked. Specifically, a soap-film technique is developed to create gaseous interfaces that are free of small-wavelength perturbations, diffusion layers and three-dimensionality. Experiments with four single-mode air/
 $\text{SF}_{6}$
interfaces with different amplitudes and wavelengths impacted by a planar shock are successfully performed in a shock-tube facility. The remarkably clear and clean interfacial morphologies captured demonstrate that the interfacial imperfections, which are unavoidable in previous membrane or membraneless experiments, are largely eliminated in the present experiments. Hence, a high-fidelity instability development process is obtained, which involves the smallest experimental error among all existing results. Based on this high-fidelity result, the impulsive model is validated by the temporal variations of the perturbation amplitudes. The individual growths of bubbles or spikes demonstrates that all existing models can reasonably predict bubble development up to the late nonlinear stage. However, only the recently developed model of Zhang & Guo (Reference Zhang and Guo2016) can provide a reasonable prediction of spike development through its superior principles. Growths of the fundamental mode and the high-order harmonics, obtained from the spectral analysis of the interfacial contours, provide the first direct validation of the high-order nonlinear models of Zhang & Sohn (Reference Zhang and Sohn1997) and Vandenboomgaerde et al. (Reference Vandenboomgaerde, Gauthier and Mügler2002) from the early to the weakly nonlinear stages. It is found that both the models of Zhang & Sohn (Reference Zhang and Sohn1997) and Vandenboomgaerde et al. (Reference Vandenboomgaerde, Gauthier and Mügler2002) can provide a very good and almost identical accuracy in predicting the growth of the first two modes at the early stage. We also note that the model of Zhang & Sohn (Reference Zhang and Sohn1997) is more robust in predicting the third-order harmonics due to the fewer simplifications used in this model, whereas the simplified method for the full perturbation theory proposed by Vandenboomgaerde et al. (Reference Vandenboomgaerde, Gauthier and Mügler2002) facilitates calculations of the perturbation of higher-order terms, which is very useful for solving multi-mode interfacial instability. These findings would be of great use in studying single- and multi-mode RMI.
Acknowledgements
This work was supported by the National Key R&D Program of China (no. 2016YFC0800100), the National Natural Science Foundation of China (nos 11625211 and 11621202), Science Challenging Project (JCKY2016212A501) and the Fundamental Research Funds for Central Universities.



