


I. INTRODUCTION
As a microelectro mechanical systems (MEMS) capacitive switch experiences bulk dielectric charging, there is a slow drift in the pull-in and release voltages of the MEMS switch over time. This is due to the screening of the applied voltage by the dielectric charge that becomes trapped within the switch. This effect has been studied extensively, and quantified as a function of time, voltage, duty factor, and excitation frequency [Reference Yuan, Peng, Hwang, Forehand and Goldsmith1]. As these voltages drop, the switch continues to operate until the release voltage eventually reaches zero volts. At this point, the accumulated internal charge becomes sufficient to prohibit the membrane from releasing and the switch becomes “stuck.” A typical graph of this drift in operating voltages is shown in Fig. 1.
Evolution of V P and V R for a MEMS switch with 39 V applied voltage. Failure occurs when V R = 0, at approximately 8400 s. Dashed lines are curve fits using (4).

The lifetime of a MEMS switch is dependant on many factors, including the applied voltage, the pull-in and release voltages, and the particular charging characteristics of the dielectric integrated into the switch. The switch shown in Fig. 1 exhibits a pull-in voltage (V P) of 17 V, release voltage (V R) of 10 V, and utilizes 2000 Å of SiO2 as the switch dielectric. The construction consists of the typical fixed-fixed beam architecture, with a refractory metal membrane and Pyrex substrate. These curves were measured with 39 V applied continuously (100% duty factor) to the switch. It was previously determined experimentally that operating the switches with negative voltages (on the fixed lower electrode relative to the mechanical membrane) minimizes the effects of dielectric charging. Operating at higher voltages and duty factors accelerates the charging mechanism for a quicker failure. This is often useful in quantifying and validating charging theories and experiments, requiring much shorter periods of testing.
The challenge for those manufacturing or operating capacitive MEMS switches is to be able to evaluate the drift in operating voltages due to dielectric charging and predict lifetime based on accelerated and/or short-duration measurements. This paper endeavors to move closer to that goal by offering an empirical formula which closely fits the dielectric charging curve and enables relatively quick assessment of MEMS switch longevity under a specific set of operating conditions.
II. BACKGROUND
Dielectric charging in MEMS switches has been intensively studied in recent years. Although some level of dielectric charging appears to be unavoidable, it is desirable to quantify it so that its effect on the switch lifetime under different operating conditions is predictable. This can be accomplished if the dielectric charging model extracted from accelerated tests under high voltages or elevated temperatures is valid over the long term under real operating conditions.
Depending on the origin of the charge, dielectric charging can be classified as either surface charging or bulk charging [Reference Peng, Yuan, Hwang, Forehand and Goldsmith2]. Surface charging is detrimental because it is usually faster to charge than bulk charging but slower to discharge. Since surface charging can be greatly enhanced by ambient humidity [Reference Peng3, Reference Zhahloul, Bhushan, Pons, Papaioannou, Coccetti and Plana4], most unpackaged switches tend to suffer from surface charging unless tested under very well controlled ambient conditions [Reference Peng5]. With properly prepared dielectric and packaging, the switch lifetime is limited by bulk charging instead of surface charging, which is easier to characterize and model using metal–insulator–metal test structures [Reference Yuan, Peng, Hwang, Forehand and Goldsmith6]. Bulk charging can be limited by either charge injection, charge diffusion, or a combination of these mechanisms such as trap-assisted tunneling, thermionic emission, Poole–Frenkel hopping, space charge polarization, etc. [Reference Melle7]. Depending on the voltage and temperature, one mechanism will dominate the others.
Empirically, bulk charging appears to evolve exponentially with more than one characteristic time constant [Reference Yuan, Peng, Hwang, Forehand and Goldsmith6]

where ΔV is the shift in pull-in voltage of a switch due to dielectric charge Q, h and ɛ are the dielectric thickness and permittivity, Q 0 is the steady-state charge, t is time, and τ is the characteristic time constant. Note that Q and Q 0 are both equivalent sheet charge densities. Based on a linear superposition of simple exponential functions, the stretched exponential function has been used to describe the charging of a capacitor since 1854 [Reference Kohlrausch8] and, more recently, capacitors on the MEMS scale [Reference Exarchos9]. Using the stretched exponential function, (1) may be rewritten as

where 0 < β < 1. However, the difference between (1) and (2) is little and experiments on MEMS capacitors have not been conducted with sufficient precision or time to distinguish them. To illustrate the similarity between (1) and (2), Fig. 2 compares the normalized charging characteristics according to (1) with J = 1 and (2) with β = 0.8, respectively. It can be seen that the difference is small and both predict a saturation behavior, which has yet to be definitely observed in capacitive MEMS switches. Therefore, for worst-case predictions, we propose to use a simple logarithmic time dependence for t > >τ:

Normalized charging characteristics according to (1) simple exponential, (2) stretched exponential and (3) logarithmic functions, respectively. There is little difference between (1), (2) and (3) when t < 3, but (3) allows a worst-case straightforward extrapolation when t > 3.

As shown in Fig. 2, (3) fits (1) and (2) reasonably well when t < 3τ and allows a straightforward extrapolation to t > >τ. In reality, the long-term charging characteristic probably lies between (1) and (3), and for a switch with high charging rate and low release voltage, it may become stuck before showing any charge saturation.
III. CHARGING CURVE AND EQUATION
The most important characteristics of the dielectric charging temporal response seen from Fig. 1 are (a) a linear response at very small short time intervals (near t = 0 s), and (b) a logarithmic change in voltage with time for extended time periods. These two features are clearly exemplified in the following equation, the general form of (3) and specifically:

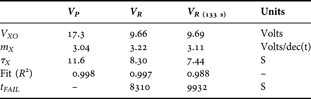
With X = P or R, this equation is useful for fitting either the pull-in voltage, V P, or the release voltage, V R. The term V XO is the initial pull-in or release voltage at t = 0. The parameter m X is the slope parameter which characterizes the logarithmic response over longer time spans (units are volts/decade of time). The parameter τ X is a time constant with no particular physical interpretation other than providing the transition between the linear and logarithmic regimes. Both the pull-in and release voltages of Fig. 1 were fitted to (4) and the parameters of those fits are given in the first two data columns of Table 1.
Fitted parameters for pull-in and release voltages given in Fig. 1.
In the case of bulk dielectric charging (no surface charging), it is the reduction in release voltage due to dielectric charging that determines when failure occurs. Solving (4) for V R(t) = 0 yields the estimated time to failure:

Experimental data on a wide variety of MEMS switches have proven to follow this response curve quite well. Comparisons with switches of relatively short lifetimes (less than 2 weeks under accelerated conditions) fit this response all the way to failure. It is difficult to provide this comparison of measurements and modeling for switches with very long lifetimes due to the extensive test time required for measuring to failure.
Fitting data to (4), than calculating lifetime based on (5), provides a simple means of roughly predicting switch lifetime without accumulating data all the way to failure. The third column of data in Table 1 (titled V R(133 s)) provides a fit to the time evolution of V R based only on the first eight data points of V R data from Fig. 1 (up through 133 s). Measuring the devices over a time scale t ~ t R appears to establish the slope relatively well for the release voltage. The extrapolated failure time using truncated measurements is reasonably close to the actual measured failure time. Obviously the more measured data that are included, the more accurate the fit and estimate will be.
As always, there is the issue of additional failure modes cropping up during the operation of the switch. It is then likely that the equations prescribed in (4) and (5) will no longer be valid. This is especially true for the situation where surface charging is present within the switch. Surface charging causes the switch voltages to increase rather than decrease [Reference Goldsmith10] and stiction occurs when negative release voltage increases to zero. Note that except for dielectric charging, the switch is electrically symmetrical and can be actuated with positive or negative voltages of equal magnitudes. In this case, equation (4) has also been successfully used provided surface charging follows equation (4). Our strategy is to use all necessary techniques to prevent surface charging and optimize the dielectric for as little bulk charging as possible. This extends switch lifetime significantly.
IV. RF MEMS SWITCH MEASUREMENTS
With this method of characterizing longer-term dielectric charging, and using the calculations of (5) to extrapolate switch lifetimes, several sets of measurements were made to study the impact of voltage, temperature, and duty factor on switch longevity. Generally, these three factors have a significant impact on switch lifetime and these measurements provide useful insights into switch longevity.
The micromechanical switches utilized in this article consist of low-loss RF MEMS capacitive switches which operate at microwave and millimeter-wave frequencies, and are similar in construction to those previously reported in dielectric charging investigations [Reference Yuan, Peng, Hwang, Forehand and Goldsmith1, Reference Peng, Yuan, Hwang, Forehand and Goldsmith2, Reference Yuan, Peng, Hwang, Forehand and Goldsmith6, Reference Goldsmith10]. The mechanical membrane is constructed with 0.28 µm thick molybdenum, planar dimensions of approximately 320 µm in length, and 100 µm in width. The molybdenum was deposited on a CVC products Inc. cluster tool using DC magnetron sputtering, with operating parameters adjusted to achieve stress in the range of 50–100 MPa tensile. The mechanical beam is suspended approximately 2.5 µm above a borosilicate glass substrate. The lower electrode consists of 0.4 µm of gold with 0.20 µm of sputtered silicon dioxide as the switch insulator. The mechanical posts supporting the membrane consist of plated copper. A photo of the switch is shown in Fig. 3. The switches characterized in this work came from two wafers within the same MEMS wafer lot. A variety of differing voltages were selected to demonstrate the broader applicability of the concepts presented here. All applied voltages used during experiments presented in this paper were applied with a negative potential on the lower electrode and the mechanical membrane at DC ground.
Photograph of an RF MEMS switch constructed with molybdenum membrane on glass substrate.

A) Influence of voltage on switch lifetime
From the earliest investigations of dielectric charging, it has been apparent that as voltage and electric field across the MEMS switch increase, so does dielectric charging [Reference Goldsmith11]. This is again apparent from Fig. 4, which demonstrates an MEMS switch operating under several differing actuation voltages ranging from 33 to 48 V (with the membrane at DC and RF ground). As in the previous example, these voltages are measured at 25°C under 100% duty factor to accelerate the failure of the switch. The same switch was repeatedly measured with increasing applied voltage, allowing at least 24 h between measurements for accumulated charges to dissipate.
Evolution of V P and V R for various applied voltages from 33 to 48 V. All measurements taken at 25°C and 100% duty factor. Dashed lines are curve fits using (1).
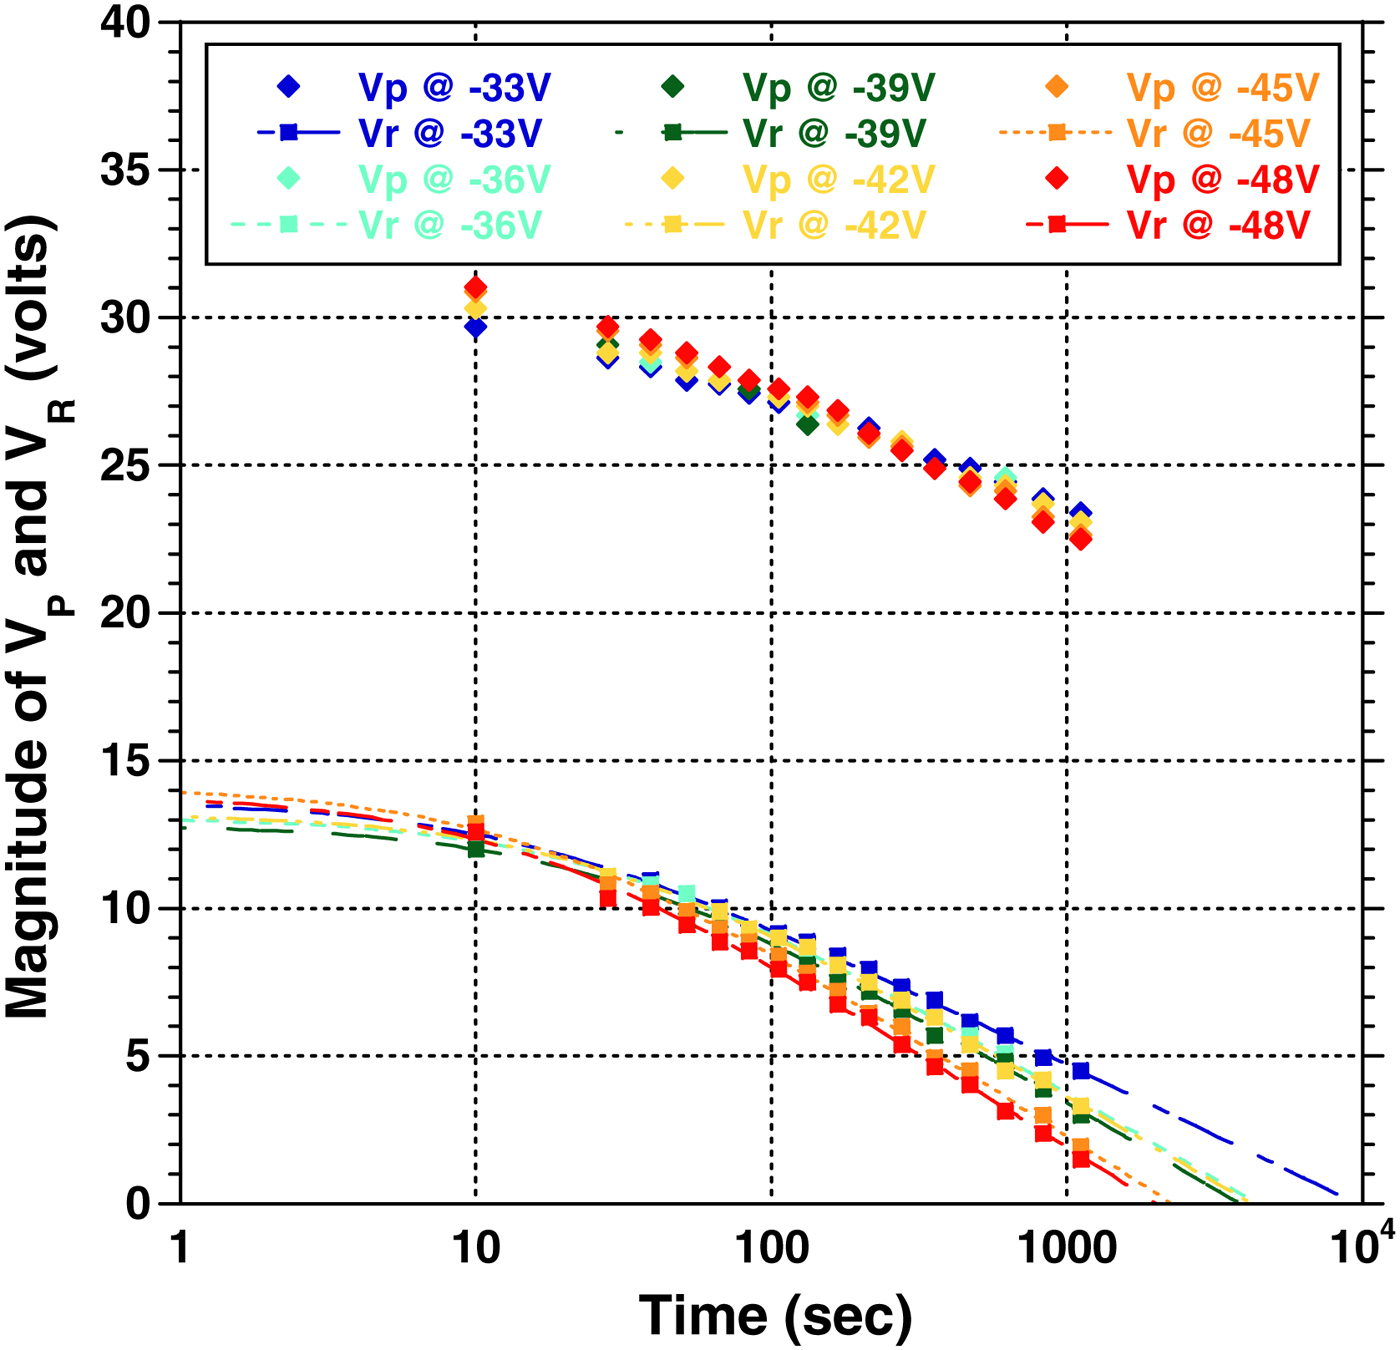
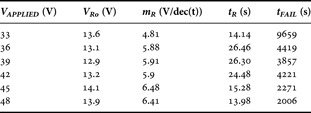
It is apparent from inspecting Table 2, the summary of fitted results for the measurements of Fig. 4, that with increasing voltage the slope parameter, m, is increasing. This is generally consistent with historical data which demonstrates that higher voltages lead to steeper charging curves and therefore shorter switch lifetimes. It has been observed that typical values for the slope parameter, m R, can range widely from 1.5 to 6 V/decade (time). It is apparent that slight differences in contamination or surface conditions can have a dramatic impact on the rate at which dielectric charging occurs. These results again justify the philosophy that lower operating voltages (more specifically lower electric fields) are more conducive to switch longevity. This assumption is valid down to the point where the restoring force of the switch becomes insufficient to overcome the surface forces between the membrane and dielectric. In addition, for switches operating in the bulk charging regime it is not necessary to operate the switches well above the pull-in voltage since dielectric charging reduces the required voltage. This is in direct contrast to switches that exhibit surface charging, where dielectric charging causes the pull-in voltage to increase with time, necessitating sufficient headroom above the pull-in voltage to allow for charging.
Fitting parameters for V R for the switch of Fig. 4 for various applied voltages.
B) Temperature effects and lifetime
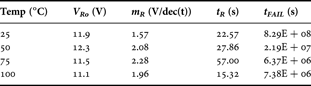
For the characterization over temperature, a switch was operated with a constant 30 V applied voltage, 100% duty factor, and characterized at operating temperatures of 25, 50, 75, and 100°C. The results from these measurements are shown in Fig. 5. This switch exhibited approximately −90 mV/°C change in pull-in voltage over temperature. This change in pull-in voltage over temperature is caused by strain-induced changes in mechanical stress. These changes are due to differences in expansion coefficient between the substrate and the mechanical layer [Reference Goldsmith and Forehand12]. Interestingly, the release voltages remained relatively consistent for all but the highest temperatures.
Evolution of V P and V R at temperatures ranging from 25 to 100°C. All measurements were made at 30 V and 100% duty factor. Dashed lines are curve fits using (1).

Table 3 highlights the fitted results for the measurements in Fig. 5. The most startling result from these measurements is that the logarithmic voltage change with charging is relatively consistent from temperature to temperature. Previous measurements and modeling of dielectric charging over shorter time intervals, with earlier generations of switches, demonstrated a significant variation in charging with temperature [Reference Yuan, Peng, Hwang, Forehand and Goldsmith13]. It has not been determined why these measurements deviate significantly from prior work. Further characterization is necessary to ensure that subtle differences in measurement technique or switch composition are not impacting the results. In either case, the proposed method for quantifying the charging over temperature is fully valid and useful.
Fitting parameters for V R for the switch of Fig. 5 at various temperatures.
C) Impact of duty factor on lifetime
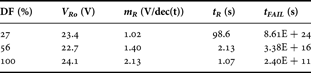
In some applications of RF MEMS, such as in phase shifters for phased array antennas, any particular MEMS switch will only be operated for a portion of the operating timeline [Reference Teti and Darreff14]. As such, it is important to understand the impact of duty factor on the lifetime of the MEMS switch. Providing periods of rest between successive cycles of operation allows the charges the opportunity to discharge and partially recuperate from dielectric charging. Fig. 6 demonstrates a switch being operated at 25°C and 45 V with 27, 56, and 100% duty factors. The cycling rate for 27 and 56% duty factors was 11 Hz, providing on-times of 24.5 and 50.9 ms out of a total period of 90.9 ms. The transition times from off-to-on and on-to-off were 20% of the total period, about 18.2 ms. As discussed previously, the switch was allowed to rest for greater than 24 h between successive measurements to allow the switch to return to its uncharged state.
Evolution of V P and V R for MEMS switch with 27, 56, and 100% duty factors (voltage applied for 24.5, 50.0, and 90.9 ms out of a 90.9 ms period, respectively). Applied voltage is 45 V and temperature is 25°C. Dashed lines are curve fits using (1).

The fitting parameters for the switch results of Fig. 6 are provided in Table 4. The variation in slope parameter with duty factor is dramatic. Clearly, even short periods of rest between actuation cycles can have a significant impact on the slope parameter and switch lifetime. The very long lifetime of these switches, especially at low duty factors, is attributed to low slope factors and higher release voltages. Estimated failure times of >1010 s implies that the switch would operate for a significant number of cycles before failure due to charging.
Fitting parameters for V R for the test conditions of Fig. 6.
V. CONCLUSION
An empirical equation has been proposed which fits the charging behavior of MEMS switches over long time spans. This curve possesses asymptotic behavior which fits experimental data for longer time intervals. This equation is useful for characterizing the behavior of a MEMS switch under a variety of different operating conditions. The trends in dielectric charging modeled by this equation allow a simple means of predicting switch lifetime without testing switches to failure. While this technique has been proven out with MEMS switches which incorporate SiO2 as the switch dielectric, it is believed that the techniques are applicable to a broader class of amorphous dielectric materials. Using this method, one can envision a fast, more efficient means of gathering statistics on dielectric charging and predicting lifetime for large numbers of switches.
ACKNOWLEDGEMENTS
The authors appreciate the sponsorship of the Defense Advanced Research Projects Agency, for which this research was performed under Contract F33615-03-C-7003. The authors would also like to thank Shane Coffman for support in switch characterization.
 Charles L. Goldsmith received bachelors and masters degrees in electrical engineering from the University of Arizona. He received his Ph.D. degree from the University of Texas at Arlington. Dr. Goldsmith has been involved in the design and development of microwave and millimeter-wave circuits and subsystems, microwave photonics, and microelectro-mechanical systems for RF applications since 1982. In 2001 he founded MEMtronics Corporation, where he is pursuing the commercialization of micromachining and MEMS technology for RF applications.
 Sean O'Brien received his Ph.D. from Rice University in 1988 where he discovered buckyballs (C60) and the fullerenes working with Nobel Laureates Rick Smalley, Bob Curl, and Harry Kroto. He received a bachelors degree with honors in chemistry from the University of Illinois in 1984. Dr. O'Brien has experience in CMOS R&D, establishing mature production processes in nanoscale contamination control, wet chemical processing, nanometer scale photolithography, and resolution enhancement technology. His main interests are process development and transition to manufacturing of semiconductor and MEMS processes.
 David Molinero received the B.S. degree in telecommunications, the M.S. degree in electrical engineering, and the Ph.D. degree from Universitat Politecnica de Catalunya, Spain, in 2004, 2006, and 2009, respectively. He is now a Postdoctoral Research Associate at Lehigh University, Bethlehem, Pennsylvania. His research interests include design, fabrication, and characterization of MEMS devices, especially focusing on reliability issues.
 James C. M. Hwang received the B.S. degree in physics from National Taiwan University, Taipei, Taiwan, in 1970, and the M.S. and Ph.D. degrees in materials science from Cornell University, Ithaca, New York, in 1976 and 1978, respectively. He is now a Professor of Electrical Engineering and Director of Compound Semiconductor Technology Laboratory at Lehigh University, Bethlehem, Pennsylvania. His research interests include MEMS, microwave devices, and circuits.



