Introduction
The American Southwest, including California with Mediterranean climates, is projected to experience severe impacts due to climate change that will have a wide variety of impacts on the health of local populations.Reference Garfin, Franco and Blanco 1 The American Southwest region is home to approximately 56 million people, around 90% of whom live in cities, which is the highest percentage of urban dwellers for any US region. The population of the Southwest is expected to increase by nearly 70% by mid-century, which will further exacerbate the region’s ability to build resiliency to the impacts of climate change.Reference Walsh, Wuebbles and Hayhoe 2
Of particular concern is how Los Angeles County (California USA), home to 10.1 million people, will withstand the challenges posed by both population growth and climate change. Downscale modeling of projected climate change for Los Angeles County has revealed that the region is likely to experience a significant increase in the number of extreme-heat event days, with some inland areas experiencing more than 100 days per year of temperatures over 95°F by mid-century.Reference Sun, Walton and Hall 3 As heat waves increase in number, length, and intensity, morbidity and mortality associated with heat stress is expected to increase significantly.Reference Braga, Zanobetti and Schwartz 4 , Reference Reid, Mann and Alfasso 5 A primary focus of prior work on the projected impacts of climate change on health in Southern California has been to assess risks to vulnerable populations.Reference Cooney 6 - Reference Dohrenwend and Thomas 11 Extreme heat is anticipated to have a large impact on the elderly, outdoor workers, and those with underlying medical problems.Reference Gronlund, Zanobetti, Schwartz, Wellenius and O’Neill 12 , Reference Kjellstrom and McMichael 13 Vulnerability to extreme-heat events includes access to cooling through air conditioning or cooling centers, as well as the decreasing capacity of existing energy infrastructure due to higher temperature.Reference Heather, Moore, Herberger and Allen 14 In addition to additional extreme-heat events, Southern California is anticipated to experience water scarcity as climate change will result in less precipitation to be captured in the snowpack. The reduction in snowpack will strain water resources state-wide. Water scarcity is also expected to impact food production as alternate models of current adaptive strategies are exhausted.Reference Howitt, MacEwan, Medellin-Azura, Lund and Summer 15 Drier conditions combined with the extreme heat due to climate change is predicted to generate conditions that will result in increased wildfire events and more acres burned per fire. The impact of wildfires in Southern California has been increasing and expected to continue into the future.Reference Jin, Randerson, Capps, Hall, Faivre and Goulden 16 Wildfires in Southern California fall into two types: those driven by fall Santa Ana winds, and those that coincide with the hot and dry weather of June through September. Both types of fires are expected to increase with climate change. Santa Ana fires have historically placed more structures and human lives at risk. The overall areas burned by Santa Ana driven fires in Southern California are anticipated to increase by an average of 64% by 2041-2060 relative to 1981-2000. Overall areas burned by non-Santa Ana fires are anticipated to increase by an average of 77% due to increases in the fire size from a warmer, drier climate.Reference Jin, Randerson, Capps, Hall, Faivre and Goulden 16 , Reference Westerling, Bryant and Preisler 17 Vulnerability to wildfires parallels extreme heat with low income, and populations with pre-existing medical conditions, especially respiratory disease.Reference Finlay, Moffat, Gazzard, Baker and Murray 18 In response to these climate-related events, a wide range of individuals will seek additional medical care, and a majority of lower socioeconomic populations are more likely to visit emergency departments (EDs) than other types of ambulatory health care settings.Reference Kangovi, Barg, Carter, Long, Shannon and Grande 19
Surprisingly, no detailed studies to date have assessed if hospitals are prepared to take on the increase in ED and hospital visits that are expected to result from climate change. The resiliency of communities to these impacts is dependent upon the ability of hospitals to continue to meet the needs of their local population under climate change. Currently, all of Los Angeles area hospitals are at or over capacity some portion of the year, with eight hospital systems accounting for 40% of hospitals and beds in California. 20 The cost of uncompensated care in California increased between 2004 and 2013 from $1.95 to $2.8 billion. Preventable adverse events reported at California hospitals have also increased each year from 2009 to 2013. 20 Taken together, these factors put hospitals at risk for not being capable of taking on additional surges of patients.
To adequately prepare for and build resiliency to the impacts of climate change, a thorough assessment of the projected impacts on hospitals is needed. The ways in which climate change will impact the ability of hospitals to respond to those impacts are not well known, even though recent downscale studies have provided great insights into how climate change will manifest itself at the local level for specific regions and what the resulting impacts of those changes will be on the health of the communities living in those regions.Reference Hall, Qu and Neelin 21 , 22 As a result, hospitals are unclear whether they need to conduct additional planning (ie, beyond current disaster planning) to build resiliency to the impacts of climate change. A better understanding of hospital planning needs related to climate change would also be very beneficial to public health and other agencies that support hospitals. Here, using Los Angeles County as a case study, the projected increases in surges of ED visits due to climate-related events at mid-century were calculated. In addition, historical data were used and climate-related projections to predict which hospitals in Los Angeles County will experience greater risks due to wildfires and sea coastal rise resulting from climate change at mid-century.
Methods
Demographic Descriptions of Los Angeles Area Hospitals
The list of hospitals compiled for this study was acquired from California’s Office of Statewide Health Planning and Development (OSHPD; Sacramento, California USA). Only those hospitals licensed as of June 2015 were included. Data obtained from OSHPD included: hospital address, number of beds, ED status, and level of care provided. In addition, data regarding whether each hospital was located in a geographic area that qualifies as a health care shortage area (HSA; ie, geographic areas lacking sufficient health care professionals or providers per federal or state criteria) were obtained from OSHPD. The federally-mandated workforce shortage designations used included: health professional shortage area (HPSA), medically underserved area (MUA), and medically underserved population (MUP); primary care shortage area (PCSA) and Registered Nurse shortage area (RNSA); and disproportionate share hospitals (DSH).
Current and Projected ED Visits for Los Angeles Area Hospitals
Hospitals that did not have an ED were excluded in the assessment for patient volume. The number of beds for each hospital was also obtained from OSHPD. Heat-related ED visits (combined visits and admissions) from 2009-2014 were obtained from OSHPD. Heat-related visits were defined as those for which heat-related ICD-9 codes were provided. The average number of annual ED visits related to heat from 2009-2014 for each hospital was used as a baseline for that hospital. The baseline number of heat-related ED visits per extreme-heat day was calculated by dividing the total number of annual heat visits by the number of extreme-heat days indicated in work by Alex Hall.Reference Sun, Walton and Hall 3
The projected number of heat-related ED visits for 2050 was calculated by multiplying the current rate of extreme-heat-related ED visits per extreme-heat day by the number of extreme-heat days for a specific subarea of Los Angeles in 2050, predicted by Hall and colleagues, and by the predicted increase in population (approximately 13%) for Los Angeles County by 2050.Reference Sun, Walton and Hall 3 , 23 The predicted total number of ED visits in 2050 was calculated by multiplying the average annual number of ED visits from 2009-2014 by the predicted increase in population for Los Angeles County between 2015 and 2050. 23
Historical and Current Impacts of Seasonal Influenza on Capacity of Los Angeles Area Hospitals
ICD-9 codes for seasonal influenza-related ED visits were obtained from OSHPD. Data for seasonal influenza-related ED visits were examined for each hospital for two different years (2009 and 2015) and used to provide a reference for the volume of surges in ED visits area hospitals already experience and prepare for on a regular basis. 2009 was picked as a high-volume reference year due to the H1N1 pandemic, and 2015 represents the most recent year for which regular seasonal influenza data were available. These data, along with total ED visit data for 2015, were used to calculate the percentage of total ED visits that were due to seasonal influenza in 2009 and 2015 for each hospital. 2050 seasonal influenza ED visits were not calculated, as only population is projected to increase, and as a result, the ratio to the total number of ED visits is assumed to stay the same.
Proximity of Los Angeles Area Hospitals to Coastal Flooding Zones
The facility listing address for each hospital that was included in the OSHPD data set was used to map the hospital locations. Maps of one foot, three feet, and six feet projected increases in sea coast level rise were obtained from the National Oceanic and Atmospheric Administration (Silver Spring, Maryland USA). 24 The distances between hospitals and the sea coastal flood zones were determined using the line measurement tool in ArcGIS (Esri; Redlands, California USA), rounded to the nearest tenth of a mile.
Proximity of Los Angeles Area Hospitals to Fire Hazard Zones
Geospatially encoded data for fire hazard zones very high fire hazard severity zone (VHFHSZ) and state responsibility area (SRA) were obtained from Cal Fire (Sacramento, California USA). 25 The VHFHSZs are determined by Cal Fire, indicating that the area has the physical conditions that create the likelihood of burning over a 30-50-year period without considering mitigation modifications. The model incorporates propriety characteristics that affect the probability of the area burning and the fire behavior in the area. The characteristics include, but are not limited to, fire history, existing and potential fuel, flame length, blowing embers, terrain, weather, and likelihood of buildings igniting. Distances between hospitals and fire hazard zones were measured using the line measurement tool in ArcGIS, rounded to the nearest tenth of a mile. If the distance from a hospital to the VHFHSZ exceeded the distance from the hospital to a SRA zone, then the distance to the nearest SRA was used. The SRAs fall into three hazard categories: 1=Moderate; 2=High; 3=Very High. The spatial query of fire zones included a 2-mile radius and 5-mile radius to calculate the proximity to hospitals.
In addition, historical fire data mapping was developed using the state-wide graphic information system/GIS layer of historical fire perimeters from 1959 to 2012 to derive the spatial distribution and frequency of wildland fires in Los Angeles County. The annual fire perimeter database, jointly developed by the Fire and Resource Assessment Program (FRAP; Cal Fire), the United States Department of Agriculture Forest Service Region-5 Remote Sensing Lab (McClellan, California USA), the Bureau of Land Management (Washington, DC USA), and the National Park Service (NPS; Washington, DC USA), represents the most complete digital record of historical fires on public and private lands throughout California. The number of fires that occurred in a specific region during 1959-2012 was based on the FRAP historical fire database. 26 Only fires that consumed more than 100 acres were included for the analysis. The data were stored as an ArcGIS Feature Class, which provides effective tools for handling overlapping polygons (eg, areas that burn more than once). A vector map of historical fire frequency was created by calculating number of fires during 1959-2012 using ArcGIS spatial analysis tools.
Results
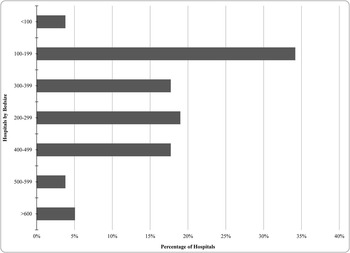
Seventy-nine hospitals in Los Angeles were included in this study. The majority of these hospitals were mid-size, with an average bed size of 235 beds and a range of 12-1265 (Figure 1).
Demographic Description of Hospitals in Los Angeles County. Note: Percentage of Los Angeles County hospitals with different numbers of beds in 2014.

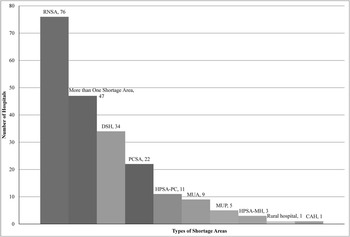
Sixty-one percent (n=47) of the hospitals studied represented more than one HSA, and 33% (n=34) were DSHs (Figure 2).
Shortage Area Description of Hospitals in Los Angeles County. Note: Shown are the number of hospitals that qualify as being in a RNSA, more than one shortage area, DSH, PCSA, HPSA-Primary Care, MUA, MUP, HPSA-Mental Health, rural hospital, or CAH. Abbreviations: CAH, Critical Access Hospital; DSH, Disproportionate Share Hospital; HPSA, Health Professional Shortage Area; MUA, Medically Underserved Area; MUP, Medically Underserved Population; PCSA, Primary Care Shortage Area; RNSA, Registered Nurse Shortage Area.

Current and Projected ED Visits for Los Angeles Area Hospitals
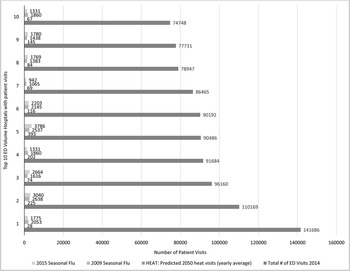
On average, 13 ED visits were reported due to extreme heat per hospital per year at the present time. Based on projected increases in extreme-heat events and population for the region, the calculated average number of annual extreme-heat-related ED visits for hospitals in Los Angeles County would increase over 65% (21 visits per year per hospital) by 2050. However, it is important to note that the percentage of ED visits that received ICD-9 codes related to heat in 2009-2014 in Los Angeles constituted less than 0.2% of the total ED visits for the area. By comparison, the average number of ED visits in 2009 due to seasonal influenza for each hospital in Los Angeles was 784 (three percent of total ED visits) and in 2015 was 856 (five percent of total ED visits). Thus, even if the number of ED visits that are heat-related was under-estimated by a factor of 10 (eg, only used those ED visits that received heat-related ICD-9 codes and not secondary illnesses), seasonal flu still represents a greater percentage of the total ED visits for Los Angeles county currently (Figure 3).
Emergency Department Visits from Extreme Heat and Seasonal in Los Angeles County. Note: A Sample of the Top 10 Hospitals by Volume in Los Angeles County. The predicted number of ED visits per year in 2050 due to heat for each hospital in Los Angeles County, compared to the total number of emergency department visits per year for each hospital 2009-2014 visits, and total number of seasonal influenza ED visits in and 2015 for the same hospitals. Abbreviation: ED, emergency department.

Proximity of Los Angeles Area Hospitals to Sea Coastal Flood Zones
Very few hospitals in Los Angeles County were predicted to be at risk due to sea coastal rise. There was a total of five that were within a one-mile proximity to a 500-year flood event and six feet of sea-level rise. Three of the five hospitals were located within one mile of a 500-year flood event and only one foot of sea-level rise.
Proximity of Los Angeles Area Hospitals to Fire Hazard Zones
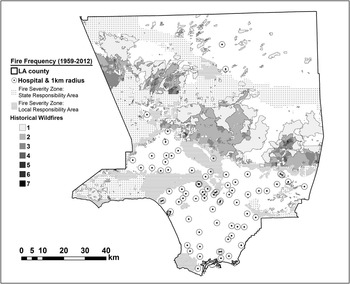
Proximity to wildfire areas was found to be a significant potential impact for several hospitals in Los Angeles County. Thirty-four percent (n=25) of hospitals in Los Angeles County were located within one mile of an area that either had a wildfire between 1959-2012 or was at high-risk for a future wildfire. The Los Angeles County hospitals located within one mile of a wildfire area represented 37% of patient beds (n=8,294). Twenty-four percent (n=6) of the affected hospitals were DSHs with 12% (n=3) being both disproportionate share and having more than four health care shortages (Figure 4).
Map of Los Angeles County Hospitals, Historical Wildfire Sites (1959-2012), and Fire Severity Zones. Note: Hospitals are depicted as black dots with 1 km circle around them. The locations of historical wildfires are in white, gray, and black; black indicates locations that have experienced seven wildfires and white with borders indicates zones that have indicated only one wildfire during the period 1959-2012. Fire severity zones are show in patterned gray. Figure courtesy of Yufang Jin (UC Davis).

Discussion
This analysis suggests that the single largest threat to Los Angeles County hospitals related to climate change is direct impacts resulting from an anticipated increase in wildfire frequency. In Los Angeles County, 34% of hospitals are within one mile of a VHFHSZ, and 24% of these hospitals are disproportionate share with 12% being both disproportionate share and having greater than four health care shortages. In addition, one Los Angeles hospital was found to be at risk from sea coastal flooding as a result of climate-change-related sea-level rise. By contrast, the projections in this study suggest that surges of ED visits due to extreme heat will not exceed what is already experienced as a result of seasonal influenza. The total impact of climate change on public health in Los Angeles will be significant; the majority of that impact will be focused in the community instead of EDs at hospitals. These data suggest that hospitals are prepared to handle any acute surges of patients that may be generated from climate events and arrive at EDs. Climate change preparedness efforts should be focused on plans for hospitals that are anticipated to be affected by wildfires. As Los Angeles continues to prepare for climate impacts, hospitals should partner to ensure their communities are aware of the possible impacts to their systems.
Limitations
One limitation of this study is the use of “business as usual” projections for the number of extreme-heat event days for 2050 to calculate the anticipated volume of heat-related ED visits in 2050. Because greenhouse gas emissions may continue to rise in the near future, these projections may underestimate the actual number of extreme-heat days in 2050.
Another limitation of this study is only considering ED visits that were explicitly linked to heat based on their ICD-9 codes. The complexity of heat-related illness may be such that this underestimates the amount of ED visits that will occur during an extreme-heat event. While this study projected an estimated one percent to three percent increase in the number of patients who are coded as heat-related by mid-century, other types of patients are likely to visit during extreme-heat days. Patients with chronic conditions, such as heart disease, who take medications that exacerbate the body’s response to heat may be more likely to visit the ED. That being said, other studies which have included a more expanded definition of “heat-related illnesses” (eg, have included increased numbers of ED visits with respiratory and cardiac ICD-9 codes and/or have incorporated other heat-related primary and secondary diagnosis in their analyses) have also found less than a five percent increase in overall ED patient volume.Reference Fadda 27 - Reference Anderson and Bell 30 These studies did identify significant increases in patients with specific disease states: people with chronic conditions such as diabetes, acute renal failure, and cardiovascular disease were more likely to visit the ED during extreme-heat events. While ED visits from these patient populations did not contribute significantly to overall ED volume from a surge capacity perspective, hospitals may wish to explore whether they need to put in place additional specialized surge capacity to deal with these subpopulations (eg, whether they have sufficient dialysis units in their ED to be able to handle additional surges in acute renal failure ED visits).
This study did not look directly at potential impacts of climate change on the number of ED visits related to asthma and respiratory disease or vector-borne disease. Although it is generally assumed that climate change in Los Angeles will result in increased air pollution, which will in turn increase the number of patients with asthma and allergies and the volume of ED visits due to acute respiratory problems, no data are currently available that allow the fold increase in individuals with asthma and allergies in Los Angeles by 2050 to be estimated.Reference Jacob and Winner 31 , Reference Künzli, McConnell and Bates 32 Likewise, several authors have suggested that the incidence of vector-borne diseases will increase in Los Angeles due to climate change, and it would be reasonable to assume that this would result in increased numbers of total ED visits.Reference Kwan, Park, Carpenter, Ngo, Civen and Reisen 33 Although data on vector-borne disease-related ED visits are currently not available on a hospital level, the current case volumes county-wide are low when considered as a function of total ED volume. For instance, Los Angeles County is considered to be a hotspot for West Nile Virus, and concerns have been raised about the possibility of West Nile Virus increases in prevalence as a result of climate change.Reference Kwan, Park, Carpenter, Ngo, Civen and Reisen 33 , Reference Harrigan, Thomassen, Buermann and Smith 34 However, the total number of cases in Los Angeles County (n=165 for 2013) is very small compared to total volume of ED visits (n=3.4 million for 2013) in the entire country. 35 , 36 There is a possibility that new vector-borne disease (eg, Dengue and Chikungunya) may become endemic in Los Angeles County as a result of climate change.Reference Harrigan, Thomassen, Buermann and Smith 34 It is important to note that none of these vector-borne diseases are communicable, and are therefore unlikely to result in dramatic surges in the number of ED visits.
Conclusion
A regional assessment was conducted of the projected impacts of climate change in Los Angeles County on area hospitals to help them determine whether they need to incorporate additional preparedness measures to plan for these impacts beyond what they are already doing. This assessment suggests that surge planning that Los Angeles hospitals currently engage in for seasonal influenza should allow them to plan effectively for expected heat-related ED visits due to climate change in 2050. However, the assessment also suggests that wildfires will pose an increasing risk to many hospitals in Los Angeles County as a result of climate change, and that hospitals located near wildfire risk zones should prioritize planning for wildfire impacts going forward.