Implications
The present study shows the existence of genetic variation in carcass cuts predicted using digital image analysis in commercial cross-bred cattle. These results will greatly improve the prediction of carcass quality with subsequent benefits for payment on carcass quality, as well as providing phenotypes to aid in breeding for improved carcass quality.
Introduction
Most breeding objectives attempt to identify the most profitable animals by appropriately weighting well-defined and accurately measured phenotypes into an overall breeding goal. Inclusion of all pertinent traits in the breeding objective is fundamental to its uptake and success in increasing genetic gain for profitability. The main source of revenue for beef farmers, either directly or indirectly, is carcass value. Traits included in European breeding objectives are, however, generally limited to carcass weight, carcass conformation score and carcass fat score. As implemented by the European Council regulations 1208/81 and 2930/81, carcass conformation grading uses the letters excellent (E), very good (U), good (R), fair (O) and poor (P) to describe the conformation of the carcass with particular emphasis on the round, back and shoulder of the carcass. Under the same European regulations, carcass fat grading uses the scale 1 (low), 2 (slight), 3 (average), 4 (high) and 5 (very high) to measure the amount of fat on the outside of the carcass and in the thoracic cavity.
Carcass conformation and carcass fat score are currently predicted in Ireland using mechanical grading. Using a one-color angled camera, the classification machine takes a two-dimensional picture and, after superposition of a dark filter, a three-dimensional picture. Since July 2005, the Irish Cattle Breeding Federation has stored both digital images generated by the grading machines.
The 428 parameters from the classification machine describing linear measurements, surfaces and volumes, as well as carcass weight have previously been shown to be able to accurately predict four wholesale carcass cut weights grouped together by retail value: lower value cuts (LVC), medium value cuts (MVC), high value cuts (HVC) and very high value cuts (VHVC; Pabiou et al., Reference Pabiou, Fikse, Cromie, Keane, Näsholm and Berry2010). Accuracy of prediction for LVC, MVC, HVC and VHVC in steers was 0.92, 0.86, 0.93 and 0.84, respectively (Pabiou et al., Reference Pabiou, Fikse, Cromie, Keane, Näsholm and Berry2010). The comparative accuracy using EUROP grade for conformation and fat and carcass weight were lower at 0.89, 0.79, 0.89 and 0.85, for LVC, MVC, HVC and VHVC, respectively, in the same data set (Pabiou et al., Reference Pabiou, Fikse, Cromie, Keane, Näsholm and Berry2010).
Using two relatively small data sets, of which a subset was used to develop the prediction equations, Pabiou et al. (Reference Pabiou, Fikse, Näsholm, Cromie, Drennan, Keane and Berry2009) reported large genetic variation in carcass cut weights. However, the standard errors of these estimates were large, mainly attributable to the relatively small size of the data sets in that study; one data set consisted of 413 carcass records and the other data set consisted of 635 carcass records. Therefore, the objective of this study was to use a larger data set from the national database to estimate genetic parameters for wholesale carcass cut weights predicted from digital images using the prediction equations described by Pabiou et al. (Reference Pabiou, Fikse, Cromie, Keane, Näsholm and Berry2010).
Material and methods
Carcass images and predicted wholesale carcass cuts
A total of 515 494 carcass images from the VBS2000 grading machine (EplusV GmbH, Oranienburg, Germany) from animals slaughtered in 15 different Irish abattoirs between November 2006 and May 2009 were available for inclusion in the analysis. A daily calibration file was also available from all abattoirs. Each calibration file consists of two images (template boards without carcass), and is necessary to recover the abattoir conditions at each slaughtering day. If the calibration file was not available (i.e. lost or damaged), the previous day's file from that abattoir was used.
Equations developed by Pabiou et al. (Reference Pabiou, Fikse, Cromie, Keane, Näsholm and Berry2010) to predict wholesale carcass cuts from the digital images were used in the present study to predict wholesale carcass cut weights for all carcasses. Developed steer prediction equations (0.81 ⩽ R 2 ⩽ 0.97) were applied to carcass images on steers, whereas the developed heifer prediction equations (0.65 ⩽ R 2 ⩽ 0.85) were applied to heifers. The wholesale cut weights included the following groups: LVC included the weights of the fore- and hind-shins, flank, ribs, brisket, neck and lean trimmings; MVC comprised the weights of the shoulder and the chuck cuts; HVC included the weights of the sirloin and the round; VHVC comprised the weights of the rib roast, strip loin and fillet cuts. The total saleable meat of the carcass (total meat weight) was also predicted in both the steers and the heifers. Equations were also developed in the steers to predict weight of total fat (total fat weight) and total bone (total bone weight). Total meat weight, total fat weight and total bone weight are hereon referred to as ‘Overall weights’. The grouping of primal carcass cuts into wholesale cuts was based on their respective retail value, and the prediction equations were derived for the groups of wholesale carcass cuts (Pabiou et al., Reference Pabiou, Fikse, Cromie, Keane, Näsholm and Berry2010). The primal cuts components HVC and VHVC were similarly defined in steers and heifers. However, the cutting and recording procedure differed between steers and heifers for MVC; part of the shoulder weight in heifers was recorded as lean trimmings and therefore was included in LVC (Pabiou et al., Reference Pabiou, Fikse, Näsholm, Cromie, Drennan, Keane and Berry2009 and Reference Pabiou, Fikse, Cromie, Keane, Näsholm and Berry2010). Also recorded on every carcass was the cold carcass weight (hereon referred to as carcass weight), the EUROP carcass conformation and the EUROP carcass fat grade; the EUROP classification grades were transformed into a 15-point scale as outlined by Hickey et al. (Reference Hickey, Keane, Kenny, Cromie and Veerkamp2007).
Records were discarded if two images of the carcass were not available or if a validation calibration file was not available (i.e. lost or damaged) on the day of slaughter or the day immediately before slaughter from the same abattoir (n = 30 760). Animals slaughtered younger than 10 months of age (n = 474), steers older than 60 months of age (n = 289), heifers older than 36 months of age (n = 10 189), as well as animals with no known sire (n = 355 704) were also discarded. Furthermore, wholesale cuts greater than three standard deviations from their respective mean, within steers and heifers separately, were discarded (n = 2267). Two types of contemporary groups were defined: (i) to account for both abattoir and calibration file and how these effects change over time and (ii) to account for herd-specific management factors. In Ireland, farmers tend to manage heifers and steers separately and therefore herd-specific contemporary groups were defined within sex using the iterative algorithm of Crump et al. (Reference Crump, Wray, Thompson and Simm1997), parameterised by the minimum (60 days) and maximum (120 days) span of a group for date of slaughter, and the minimum number of records (n = 5) per group. Herd-specific contemporary groups were based on finishing herd, date of slaughter and intervals between consecutive slaughter dates as the variables of interest. First, consecutive animals (ranked on slaughter date) were assigned to groups based on their slaughter date and the minimum span of days defined in the parameter file. This step was then repeated considering the start and end slaughter date of the groups and the minimum span defined in the parameter file. Second, contemporary groups were optimised by reading the groups created previously and clustering consecutive groups according to the maximum span and the minimum records required per group. This step was then repeated considering the maximum span and the minimum records required per group in the parameter file. The edited data set consisted of 52 722 animals, of which 38 404 (73% of the data) were steers and 14 318 (27% of the data) were heifers. Steers and heifers were from 3947 and 1671 different herd-specific contemporary groups, respectively.
Statistical analyses
Genetic and residual variances, as well as heritability estimates for all traits, were estimated using a single trait animal model (ASReml; Gilmour et al., Reference Gilmour, Gogel, Cullis and Thompson2009). These parameters were first estimated for steers and heifers separately, and subsequently by appending both data sets into a combined data set (i.e. traits in the steer and heifer data sets were considered as the same trait). The coefficient of genetic variation (CVg) for each trait was calculated as the genetic standard deviation divided by the phenotypic mean (Houle, Reference Houle1992).
Phenotypic and genetic correlations between traits, within gender, were estimated using bivariate sire linear mixed models in ASReml (Gilmour et al., Reference Gilmour, Gogel, Cullis and Thompson2009), accounting for the relationships among sires. Genetic correlations between the same traits in steers and heifers were also estimated in ASReml (Gilmour et al., Reference Gilmour, Gogel, Cullis and Thompson2009) using a series of bivariate sire linear mixed models where the residual covariances were set to zero. The common sires (n = 1099) between the steer and the heifer data sets had a total of 24 183 and 9049 progeny in the steer and heifer data sets, respectively. Covariance matrices calculated in the steers and heifers were bent using the weighted procedure of Jorjani et al. (Reference Jorjani, Klei and Emanuelson2003) to ensure positive definiteness.
Relationships among animals were accounted for using a relationship matrix where unknown ancestors were included as phantom groups of the breeds: Charolais, Friesian, Holstein, Limousin, Angus, Simmental, Hereford, Belgian Blue, French hardy breeds (Salers and Aubrac), other beef breeds (Piemontese, Parthenaise, Blonde d'Aquitaine and Shorthorn) and unknown breed in both the steer and heifer pedigree files. Across all models, the relationships among all animals were traced back to at least five generations. The pedigree comprised 164 279 and 73 978 animals in the steers and heifers, respectively.
The overall mixed linear model was

where y is the vector of records, b is the vector of fixed effects, u is the vector of random effects, g is the vector of breed genetic groups, e is the vector of residual effects and the X, Z and Q matrices are the respective design matrices.
Model building for fixed effects was undertaken using PROC GLM (SAS Institute, 2007). Fixed classification effects considered for inclusion in the models were damaged when the animal was born (< 3 years, 3 to 5 years, 6 to 8 years and > 8 years), whether the animal was a singleton or a multiple birth, contemporary group of herd by (gender by) slaughter date and contemporary group of abattoir by slaughter date. Covariates tested for inclusion in the model were heterosis, recombination loss and age at slaughter centred within sex. Breed effects were accounted for through the use of breed genetic groups as defined earlier. Non-linear associations were also tested for significance and a quadratic effect on age at slaughter, centred within sex, was also included in the model. Coefficients of heterosis and recombination loss were calculated for all animals as  and
 , respectively, where sirei and dami are the proportion of breed i in the sire and dam, respectively.
Carcass weight was also included as a covariate in all models, with the exception of when the dependent variable was carcass weight. Wholesale carcass cut weight as a proportion of carcass weight was also considered as the dependent variable; carcass weight was not included as a covariate in these models.
Results
Phenotypic data
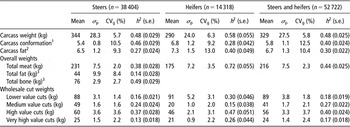
Average carcass weight of the steers and heifers was 344 and 290 kg, respectively (Table 1), and the average slaughter age was 833 days (i.e. 28 months) and 718 days (i.e. 24 months), respectively. The average carcass conformation of the steers (5.4, corresponding to ‘O = ’ in the EUROP conformation scale) was lower than the average carcass conformation of the heifers (6.8, corresponding to ‘R-’ in the EUROP conformation scale). For carcass conformation, 19% and 62% of the steers (49% and 42% of the heifers) scored ‘R’ and ‘O’, respectively. For carcass fat, 54% and 26% of the steers (45% and 43% of the heifers) scored ‘3’ and ‘4’, respectively. Lower average carcass fat score was observed in the steers (6.5, corresponding to ‘3 = ’ in the EUROP fat scale) compared with the heifers (7.3, corresponding to ‘3 + ’ in the EUROP fat scale). The predicted wholesale total meat weight averaged 67% of carcass weight in the steers and 60% of the carcass weight in the heifers. The sum of the individual predicted wholesale cuts LVC, MVC, HVC and VHVC was on average 222 kg or 96% of the predicted total meat weight in the steers, and 178 kg (101% of the predicted total meat weight) in the heifers.
Overall mean, phenotypic standard deviation (σ p), coefficient of genetic variation (CVg) and heritability estimates (h 2; standard error in parentheses) for carcass traits, predicted overall weights and predicted wholesale cut weights estimated in steers, heifers and steers and heifers combined

1Scored on a 15-point scale 1 (poor) to 15 (good).
2Scored on a 15-point scale 1 (lean) to 15 (fat).
3Data not available in the heifers; see Pabiou et al. (Reference Pabiou, Fikse, Cromie, Keane, Näsholm and Berry2010) for the cuts available within genders.
Heritability estimates
Heritability of carcass weight was 0.48 in the steers and 0.58 in the heifers (Table 1); the heritability for carcass weight across all data was 0.48. Heritability estimates for the EUROP classification score for conformation and fat in the steers and heifers ranged from 0.27 (fat score in steers) to 0.46 (conformation score in steers). Predicted total meat weight heritability was 0.38 and 0.72 in the steers and heifers, respectively (Table 1). Heritability for predicted wholesale cut weights ranged from 0.13 (VHVC in steers) to 0.47 (HVC in heifers) and was similar to those of carcass cuts as a proportion of carcass weight (results not shown). The coefficient of genetic variation for the wholesale cuts varied from 1.4% (LVC) to 3.6% (HVC) in the steers, and from 2.0% (MVC) to 3.1% (LVC and HVC) in the heifers.
Phenotypic and genetic correlations
Without any carcass weight adjustments in the models, the phenotypic correlations between carcass weight and LVC, MVC, HVC and VHVC were 0.95, 0.92, 0.80 and 0.78, respectively, in the steers, and 0.80, 0.84, 0.89 and 0.88, respectively, in the heifers.
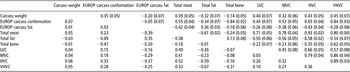
The genetic correlations between the individual predicted wholesale cut weights were all positive ( > 0.45) in both the steers and heifers. The genetic correlations between the individual wholesale cuts and carcass weight were all positive and stronger than the respective phenotypic correlations, ranging from 0.32 to 0.45 in the steers (Table 2), and from 0.10 to 0.38 in the heifers (Table 3). Carcass conformation, as defined by the EUROP classification, was also positively correlated with the individual wholesale cuts in both genders; all genetic correlations were ⩾ 0.44. Genetic correlation between EUROP classification for conformation and total meat weight was 0.55 and 0.80 in the steers and heifers, respectively. Carcass fat EUROP classification score was negatively correlated with all wholesale cut weights in both genders (all genetic correlations ⩽ −0.26) and was positively correlated with total fat weight in the steers (0.36).
PhenotypicFootnote 1 (below diagonal) and genetic (above diagonal; standard error between parentheses) correlations between carcass weight, EUROP score for conformation and fat, and predicted wholesale cut weights in steers (n = 38 404)

LVC = lower value cuts; MVC = medium value cuts; HVC = high value cuts; VHVC = very high value cuts.
1 Standard errors for phenotypic correlations were all < 0.03.
PhenotypicFootnote 1 (below diagonal) and genetic (above diagonal; standard error between parentheses) correlations between carcass weight, EUROP score for conformation and fat, and predicted wholesale cut weights in heifers (n = 14 318)

LVC = lower value cuts; MVC = medium value cuts; HVC = high value cuts; VHVC = very high value cuts.
1 Standard errors for phenotypic correlations were all < 0.04.
The genetic correlations between carcass weight and the individual wholesale cut proportions ranged from 0.00 to 0.78 in the steers, and from 0.04 to 0.30 in the heifers (results not shown). The genetic correlations between wholesale cut proportions ranged from 0.11 to 0.66 in the steers, and from 0.13 to 0.97 in the heifers (results not shown).
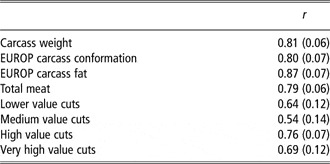
The genetic correlation between carcass weight measured in steers and heifers was 0.81 and a similar value (0.79) was estimated for predicted total meat weight; the respective correlation for carcass conformation score and carcass fat score was 0.80 and 0.87. The genetic correlations between the same wholesale cut weights in the steers and heifers ranged from 0.54 (MVC) to 0.76 (HVC; Table 4).
Genetic correlations (r; standard error between parentheses) between carcass weight, EUROP conformation and fat score as well as predicted wholesale cut weights in steers and heifers

Discussion
Traits included in a breeding goal for profitability must exhibit genetic variation and ideally should be routinely measured. Carcass value makes a considerable contribution to the profitability of beef production systems and is therefore a key component of a breeding goal for profitability. Pabiou et al. (Reference Pabiou, Fikse, Cromie, Keane, Näsholm and Berry2010) clearly showed the ability of video image analysis (VIA), available on all animals slaughtered in Ireland, to accurately predict carcass cuts yields. To the best of our knowledge, this study is the first to present (co)variance components of wholesale carcass cut weights in cattle predicted from VIA, and clearly shows the existence of genetic variation in these traits supporting their usefulness in breeding goals.
Carcass measurements
The data used in the present study are representative of the slaughtered Irish cattle population; average carcass weight in the steers (344 kg) and heifers (290 kg) was similar to those observed in the national kill statistics in 2009, where the average carcass weight was 351 kg in steers (n = 635 654) and 287 kg in heifers (n = 405 484; Department of Agriculture, Fisheries, and Food, 2009). Nationally, 45% of heifer carcasses scored ‘3’ and 37% of heifer carcasses scored ‘4’ for carcass fat; 54% of steer carcasses scored ‘3’ and 26% of steer carcasses scored ‘4’ for carcass fat (Department of Agriculture, Fisheries, and Food, 2009), indicating that the sample used in this study was representative of the national kill. In comparison to the data used in the present study, 44% of the steers killed nationally scored ‘R’ and 42% scored ‘O’ for carcass conformation, whereas 55% of the heifers killed nationally scored ‘R’ and 37% scored ‘O’ for carcass conformation, thereby also signifying that the data used in the current study were representative of the national kill.
The differences between steers and heifers in mean weight LVC and MVC as a proportion of the total carcass weight could be because of gender effects, but may also be because of differences in cutting procedures in the forequarter of the animals used to develop the prediction equations as previously described by Pabiou et al. (Reference Pabiou, Fikse, Näsholm, Cromie, Drennan, Keane and Berry2009 and Reference Pabiou, Fikse, Cromie, Keane, Näsholm and Berry2010). LVC and MVC in the heifers were based on commercial dissections, whereas LVC and MVC in the steers were based on dissection protocols implemented in a research project (Conroy et al., Reference Conroy, Drennan, McGee, Keane, Kenny and Berry2009). Although the dissection procedures between steers and heifers were very similar in the hindquarter of the carcass, commercial dissections produced more lean trimmings (potentially sold as minced meat, stir-fry or diced beef, i.e. lower value cuts) in the forequarter compared with the experimental study population (Pabiou et al., Reference Pabiou, Fikse, Cromie, Keane, Näsholm and Berry2010). In addition, the accuracy of the prediction equations for wholesale carcass cuts presented by Pabiou et al. (Reference Pabiou, Fikse, Cromie, Keane, Näsholm and Berry2010) was superior in the steers compared with the heifers, especially in the forequarter cuts (LVC and MVC), which could also have influenced the results.
The heritability estimates observed in both the steers and heifers for cold carcass weight were in agreement with the mean estimate of 0.40 reported by Rios Utrera and Van Vleck (Reference Rios Utrera and Van Vleck2004), following an extensive review of heritability estimates for carcass traits across 56 studies. Using two distinct purebred populations of Swedish Charolais and Hereford, Eriksson et al. (Reference Eriksson, Näsholm, Johansson and Philipsson2003) reported heritability estimates of 0.22 (Hereford) and 0.34 (Charolais) for carcass conformation, and of 0.27 (Hereford) and 0.38 (Charolais) for carcass fat grading. Hickey et al. (Reference Hickey, Keane, Kenny, Cromie and Veerkamp2007), using data from Irish abattoirs, observed a wide range in heritability estimates across eight Irish sub-populations separated according to breed of sire. Heritability for carcass conformation varied from 0.02 (Holstein sired) to 0.36 (Limousin sired) and from 0.00 (Hereford sired) to 0.40 (Simmental sired) for carcass fat score.
Total carcass meat, fat and bone weight
Predicted total meat, fat and bone weight of the steer carcasses in the present study agree with average total meat weight (227 kg), total fat weight (41 kg) and total bone weight (64 kg) reported by Pabiou et al. (Reference Pabiou, Fikse, Cromie, Keane, Näsholm and Berry2010) in 346 dissected steer carcasses. The sum of the wholesale cut weights in the heifers amounting to 101% of the predicted total meat weight is probably because of the overestimation in the prediction of VHVC from VIA, as documented by Pabiou et al. (Reference Pabiou, Fikse, Cromie, Keane, Näsholm and Berry2010). Nevertheless, the average predicted total meat weight of heifers in the present study (175 kg) agrees with average total meat weight of 183 kg in dissected Irish heifer carcasses reported by Pabiou et al. (Reference Pabiou, Fikse, Cromie, Keane, Näsholm and Berry2010).
Heritability for total meat weight in steers in the present study (0.38) was comparable to the average heritability of 0.51 reported in the review by Rios Utrera and Van Vleck (Reference Rios Utrera and Van Vleck2004) across 13 studies. Pabiou et al. (Reference Pabiou, Fikse, Näsholm, Cromie, Drennan, Keane and Berry2009) observed heritability for total meat weight of 0.68 and 0.54 in two distinct small populations of steers and heifers, respectively. In the present study, heritability for total meat weight in the heifers was particularly greater (0.72) than those reported in the literature: the maximum heritability reported by Rios Utrera and Van Vleck (Reference Rios Utrera and Van Vleck2004) was 0.66 when adjusted to a constant age of slaughter. Heritability of total fat weight observed in the steers in the present study (0.14) was lower than the average heritability calculated across nine studies (h 2 = 0.50) by Rios Utrera and Van Vleck (Reference Rios Utrera and Van Vleck2004). The large variation in the heritability estimates of total fat weight across studies is likely to be influenced by the gender under investigation, the breed, the feed system the animals were exposed to, the method of assessing fat content, as well as the data-editing criteria imposed and statistical model used. The heritability estimate of total bone weight in the present study (0.49) was comparable to the average heritability of 0.51 reported by Rios Utrera and Van Vleck (Reference Rios Utrera and Van Vleck2004) following a summary of seven studies.
The strong genetic associations between EUROP conformation score and the hindquarter cut weights (HVC and VHVC) proved that EUROP scores for conformation were indeed a method to indirectly select for more valuable carcasses. However, the genetic correlations between these cuts and EUROP conformation were less than unity, suggesting that additional genetic gain in carcass value may be achieved by exploiting genetic information on predicted cut yields.
The genetic correlation between EUROP fat score and predicted total fat weight in the steers was 0.36, indicating that all the genetic variation in total carcass fat weight was not captured by EUROP carcass fat score. Indeed, EUROP classification for fat aims to describe the amount of fat on the outside of the carcass and in the thoracic cavity, whereas the predicted total fat weight also includes intra-muscular fat and therefore a correlation of one is not expected.
Wholesale cut weights
In both the steers and heifers, mean wholesale cut weights were comparable to those documented by Pabiou et al. (Reference Pabiou, Fikse, Cromie, Keane, Näsholm and Berry2010) in a population of 346 and 281 steers and heifers, respectively, based on actual carcass dissections. Nevertheless, the coefficient of phenotypic variation in heifers in the present study (LVC: 16%; MVC: 18%; HVC: 18%; VHVC: 17%) was larger than those observed by Pabiou et al. (Reference Pabiou, Fikse, Cromie, Keane, Näsholm and Berry2010; LVC: 13%; MVC: 13%; HVC: 13%; VHVC: 11%). These results suggest greater variation in heifer carcass conformation in the present field study, and are also in accordance with the observation made by Pabiou et al. (Reference Pabiou, Fikse, Cromie, Keane, Näsholm and Berry2010) on the over-representation of well-conformed heifers present in the sample used in their study.
Strong phenotypic and genetic correlations among the wholesale cut weights are somewhat expected, as some of the wholesale cut weights share part of the same muscles in the carcass. Moreover, the eigenvalues summarising the raw phenotypic correlation structure between predicted wholesale cuts in the present study, not adjusted for any confounding effects, were similar to the eigenvalues of the phenotypic correlation matrix between true wholesale cut weights reported by Pabiou et al. (Reference Pabiou, Fikse, Cromie, Keane, Näsholm and Berry2010), also not adjusting for any confounding effects. In the steers, the largest eigenvalue represented 77% of the total eigenvalues of the predicted wholesale cut weights in the present study and 88% of the total eigenvalues for the true cut weights in Pabiou et al. (Reference Pabiou, Fikse, Cromie, Keane, Näsholm and Berry2010). In the heifers, the largest eigenvalue represented 87% of the total eigenvalues of the predicted wholesale cut weights in the present study and 86% of the total eigenvalues for the true cut weights in Pabiou et al. (Reference Pabiou, Fikse, Cromie, Keane, Näsholm and Berry2010). This indicates the ability of the predicted wholesale cut weights to recover the variation in carcass composition.
There is a paucity of heritability estimates in the literature for wholesale carcass cut yields in cattle. Furthermore, because of the cost of undertaking carcass dissections, previous studies reporting heritability estimates used relatively small populations (n = 503, Cundiff et al. (Reference Cundiff, Gregory, Koch and Dickerson1969); n = 257, Brackelsberg et al. (Reference Brackelsberg, Kline, Willham and Hazel1971); n = 413 to 635, Pabiou et al. (Reference Pabiou, Fikse, Näsholm, Cromie, Drennan, Keane and Berry2009)). In those studies, heritability estimates for wholesale cuts were generally moderate to high. Using carcass dissection data on 413 steers, Pabiou et al. (Reference Pabiou, Fikse, Näsholm, Cromie, Drennan, Keane and Berry2009) documented heritability estimates for primal cut weights ranging from 0.03 to 0.73 for the primal cut components of LVC (fore- and hind-shins, ribs, flank, brisket, neck, lean trimmings), from 0.79 to 0.83 for the primal cut components of MVC (shoulder, chuck), from 0.67 to 0.86 for the primal cut components of HVC (sirloin, round) and from 0.14 to 0.49 for the primal cut components of VHVC (fillet, strip loin, rib roast). Using carcass dissection data from 635 cross-bred heifers, Pabiou et al. (Reference Pabiou, Fikse, Näsholm, Cromie, Drennan, Keane and Berry2009) also reported heritability estimates for primal cut weights ranging from 0.28 to 0.74 for the primal cut components of LVC (lean trimmings, ribs, flank, brisket), from 0.41 to 0.61 for the primal cut components of MVC (blade, chuck), from 0.42 to 0.55 for the primal cut components of HVC (sirloin, round) and from 0.40 to 0.62 for the primal cut components of VHVC (fillet, strip loin, rib roast).
Genetic correlations between genders
The genetic correlations between the same wholesale cuts in either steers or heifers were not unity (Table 4), suggesting that they could be under different genetic control. Even for carcass weight, a trait that was actually recorded and not predicted, the genetic correlation deviated substantially from unity. Robertson (Reference Robertson1959) suggested that traits with a genetic correlation above 0.80 could be treated as the same trait with little loss of information. Using data on post-weaning gain in five breeds of Swedish beef cattle, Stålhammar and Philipsson (Reference Stålhammar and Philipsson1997) reported a pooled genetic correlation of 0.60 between genders, and concluded that the traits should be treated separately in the genetic evaluation of males and females. Näsholm (Reference Näsholm2004) observed genetic correlations between genders for weight at 4 months of age greater than 0.89 and suggested that weight traits in male and female lambs may be governed by the same genes. However, in the present study, the genetic correlations between the same carcass cut weight in both genders were (i) weakest for wholesale cut weights where the prediction equation accuracies were also the poorest in heifers (LVC: R 2 = 0.65; MVC: R 2 = 0.70; Pabiou et al., Reference Pabiou, Fikse, Cromie, Keane, Näsholm and Berry2010), and where the dissection techniques differed most between steers and heifers (Pabiou et al., Reference Pabiou, Fikse, Näsholm, Cromie, Drennan, Keane and Berry2009 and Reference Pabiou, Fikse, Cromie, Keane, Näsholm and Berry2010) and (ii) the strongest for total meat weight and HVC where the prediction equation accuracy was also the highest in heifers (total meat weight: R 2 = 0.84; HVC: R 2 = 0.85; Pabiou et al., Reference Pabiou, Fikse, Cromie, Keane, Näsholm and Berry2010). This suggests that stronger genetic correlations between steers and heifers might be achievable if the accuracy of the prediction equations for heifers was improved, as well as the difference in cutting methodology standardised. However, differences in genetic and phenotypic variances between genders should be accounted for in a genetic evaluation, and ideally the traits should therefore be treated separately in a multi-trait genetic evaluation.
Adjustment of cut weights for carcass weight
In the present study, carcass weight was included as a covariate in the model for the estimation of genetic parameters for the carcass cuts. This approach was undertaken so that the wholesale carcass cut weights were expressed relative to a constant carcass weight. This was preferred over the expression of each carcass cut weight as a proportion of total carcass weight because of the associated disadvantages of selecting on a ratio trait (Gunsett, Reference Gunsett1984). Nevertheless, heritability estimates for wholesale carcass cut weight as a proportion of total carcass weight were obtained but are not reported because estimates were similar to those when the dependent variable was wholesale carcass cut weight but carcass weight was included as a covariate in the model. Similar results were also observed in the early findings of Benyshek (Reference Benyshek1981). However, genetic correlations between proportion of wholesale cut weight and carcass weight were either very weak (genetic correlation between medium value carcass cut weights as a proportion of carcass weight and carcass weight was −0.03 in steers) or strong (genetic correlation between low value carcass cut weights as a proportion of carcass weight and carcass weight was 0.78 in steers). When adjustment for carcass weight was undertaken through the inclusion of carcass weight as a covariate in the model, the genetic correlations between the wholesale cut weights and carcass weight were less variable, ranging from 0.32 (correlation between MVC and carcass weight) to 0.45 (correlation between VHVC and carcass weight) in the steers, and from 0.10 (correlation between MVC and carcass weight) to 0.38 (correlation between VHVC and carcass weight) in the heifers. This also suggested that, at constant carcass weight, heavier animals tended to have more HVC and VHVC.
The other rationale for estimating (co)variance components relative to a constant carcass weight, as opposed to simply estimating carcass cut weights, is to facilitate transparency in the breeding objectives used by farmers. When the wholesale cut weights were unadjusted for carcass weights, the genetic correlations between the wholesale cut weights and carcass weight were very strong, varying from 0.89 to 0.99 across the steers and heifers (results not shown). With the approach used in the present study, the economic benefit of heavier carcasses or carcasses with a greater proportion of higher value cuts can be easily elucidated, thereby aiding in the explanation and acceptance of the breeding objective.
Conclusions
This study is the first to report genetic parameters for wholesale carcass cut weights in cattle predicted from digital images of individual carcasses. Clear genetic variation in carcass cut weights, at a constant carcass weight, exists. Coupled with the obvious contribution of such traits to the overall profitability of beef production systems, and the now routine access to the carcass images on all animals slaughtered in Ireland, it has become feasible to breed for improved carcass value.