1. Introduction
Large-scale, tsunamigenic, kilometre-sized submarine slides have been imaged on many landward trench slopes worldwide (e.g. von Huene et al. Reference von Huene, Ranero and Watts2004; Kawamura et al. Reference Kawamura, Laberg and Kanamatsu2014) by multibeam narrow-swath mapping and seismic profiling (Moore et al. Reference Moore, Taira and Klaus2001). Submarine sliding in the slope cover or shallow prism has also been inferred from subaerially exposed accretionary prisms (Moore et al. Reference Moore, Cowan and Karig1985). In ancient examples, many chaotic or olistostromal deposits have been interpreted as submarine slides (Codegone et al. Reference Codegone, Festa, Dilek and Pini2012; Wakita, Reference Wakita2012; Festa et al. Reference Festa, Dilek, Codegone, Simona and Pini2013). Von Huene et al. (Reference von Huene, Ranero, Scholl, Lallemand and Funiciello2009) investigated the mechanical instability of landward trench slopes where tectonic erosion occurs, increases the slope angle and leads to submarine slides.
Similar examples of present-day submarine slides on trench slopes have been documented in the Japan Trench, which is a non-accretionary margin. This process was highlighted by a very large subduction-type earthquake that occurred on 11 March 2011 (M w 9.0), when a large-scale submarine slide was apparently the major factor in generating the associated tsunami (Kawamura et al. Reference Kawamura, Sasaki, Kanamatsu, Sakaguchi and Ogawa2012; Strasser et al. Reference Strasser, Kolling, Ferreira, Fink, Fujiwara, Henkel, Ikehara, Kanamatsu, Kawamura, Kodaira, Romer and Wefer2013; Hamada et al. Reference Hamada, Sakaguchi, Tanikawa, Yamaguchi, Kameda and Kimura2015). This means that tsunamis are triggered not only by elastic uplift due to seismic thrusting, but also by late (sometimes minutes after the major shock) changes in submarine topography. Such large-scale slides are essentially the result of a long-term increase in slope angle during subduction erosion, with final triggering being caused by earthquake shaking.
Large-scale slides can also occur at accretionary margins, where the accretion of trench sediments produces a stable slope angle, if there is force balance in the prism, according to the critical taper hypothesis (e.g. Davis et al. Reference Davis, Suppe and Dahlen1983; Suppe, Reference Suppe2007). As an example, in the Nankai prism off SW Japan, large-scale submarine slides have been mapped on the present-day trench slope surface, particularly in the eastern Nankai Trough (Kawamura et al. Reference Kawamura, Ogawa, Anma, Yokoyama, Kawakami, Dilek, Moore, Hirano, Yamaguchi and Sasaki2009; Lackey et al. Reference Lackey, Moore, Strasser, Kopf, Ferreria, Lintern, Mosher, Moscardelli, Bobrowsky, Campbell, Chaytor, Clague, Georgiopoulou, Lajeunesse, Normandeau, Piper, Scherwath, Stacey and Turmel2018).
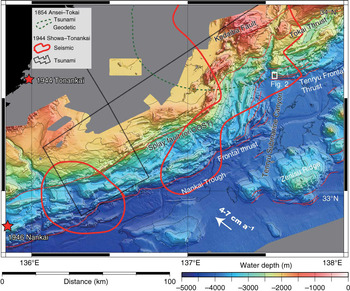
On the eastern and western sides of the Tenryu Canyon (Fig. 1), ENE–WSW-trending rows of ridges and troughs are deformed in a chaotic fashion and bent to the north (Figs 1, 2). This bending and chaotic topography are interpreted to reflect large-scale submarine sliding due to subduction, collision and uplift in the subsurface of the accretionary prism slope by the proto-Zenisu Ridge (Le Pichon et al. Reference Le Pichon, Iiyama, Boulegue, Charvet, Faure, Kano, Lallement, Okada, Rangin, Taira, Urabe and Uyeda1987; Kawamura et al. Reference Kawamura, Ogawa, Hara, Anma, Dilek, Kawakami, Chiyonobu, Mukoyoshi, Hirano, Ogawa, Anma and Dilek2011). Kawamura et al. (Reference Kawamura, Ogawa, Hara, Anma, Dilek, Kawakami, Chiyonobu, Mukoyoshi, Hirano, Ogawa, Anma and Dilek2011) collected a sample of phyllitic rock from the Tenryu Canyon floor at the Tokai Thrust (Fig. 1) that is interpreted to have been exhumed from depths of 4–5 km, based on the assumption that the rock experienced temperatures of 200–230°C during burial. The rapid exhumation was attributed to ridge subduction and resultant gravitational instability of the total prism.
Detailed topography of the Nankai Trough. The study area is located at the mouth of the Tenryu submarine canyon, which is at the toe of the eastern Nankai accretionary prism. Locations of thrust faults are after Le Pichon et al. (Reference Le Pichon, Iiyama, Boulegue, Charvet, Faure, Kano, Lallement, Okada, Rangin, Taira, Urabe and Uyeda1987). Slip areas of the 1854 Ansei–Tokai and 1944 Showa–Tonankai earthquakes are represented by grey solid and dotted lines (Seno, Reference Seno2012), respectively. The seismic, tsunami and geodetic slip areas were estimated using seismic waves, tsunami waves and geodetic data, respectively. Stars indicate the earthquake epicentres.

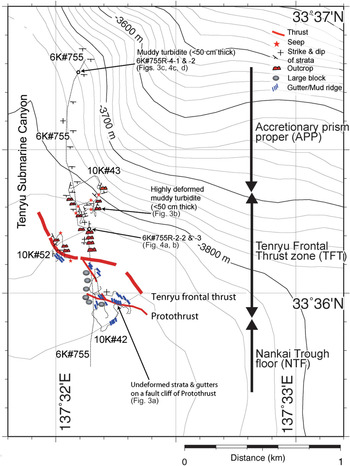
Dive sites in the study area. We dived four times using the unmanned ROV Kaiko (10K) and the manned submersible Shinkai 6500 (6K). Two rock samples (6K#755R-2 and -4) were collected from the landwards slope on the Nankai accretionary prism.

Such gravitational instability in accretionary-type prisms was studied by Morgan & Bangs (Reference Morgan and Bangs2016), who discovered an amphitheatre-shaped topography and inwards-dipping structure by seismic profiling in the Integrated Ocean Drilling Program (IODP) NantroSEIZE transect area, and concluded that this was the result of seamount incorporation. Similar structures have been found by Kodaira et al. (Reference Kodaira, Nakanishi, Park, Ito and Tsuru2003) and Park et al. (Reference Park, Moore, Tsuru, Kodaira and Kaneda2003) to the west of the Tenryu area, who considered that seamount incorporation at the base of the subduction zone pushed the prism upwards, thereby creating slope instability. Le Pichon et al. (Reference Le Pichon, Iiyama, Boulegue, Charvet, Faure, Kano, Lallement, Okada, Rangin, Taira, Urabe and Uyeda1987), Chamot-Rooke & Le Pichon (Reference Chamot-Rooke and Le Pichon1989), and Tokuyama et al. (Reference Tokuyama, Ashi, Soh, Kuramoto and Ikeda1999) have further shown that active thrust faults are transitioning across to the foot of the Zenisu Ridge (Fig. 1), which is located c. 80 km south of the Tenryu Frontal Thrust (TFT) Fault (Fig. 2). There are therefore three possible tsunamigenic faults in the eastern Nankai accretionary prism: (1) the splay fault (Tokai Thrust); (2) the frontal thrust (TFT); and (3) the fault to the south of Zenisu Ridge (Fig. 1).
There is a need to better understand the active faulting in these areas, and determine whether the observed frontal thrust faulting in the eastern Nankai accretionary prism is jumping southwards into the thrust faults of the Zenisu Ridge (Fig. 1). It is therefore necessary to better define the topographic and structural features of these areas to understand the relationship between tsunamis and trench slope topography and structural development. It is imperative to understand the hazards from large-scale submarine sliding related to large subduction-type earthquakes (The Headquarters for Earthquake Research Promotion, http://www.jishin.go.jp/main/index-e.html). For computer simulations, one of the most challenging problems in tsunami modelling and risk mitigation is to determine the range of possible tsunami scenarios in a given geographical area (Goda et al. Reference Goda, Yasuda, Mai, Maruyama, Mori, Scourse, Chapman, Tappin and Wallis2017). As such, study of the frontal thrust in the eastern Nankai accretionary prism is a key in understanding possible tsunami scenarios.
In this paper, we combined our observations of geological structures and measurements of physical properties (consolidation test) made during several submersible studies with some already reported physiographical research (Kawamura et al. Reference Kawamura, Ogawa, Anma, Yokoyama, Kawakami, Dilek, Moore, Hirano, Yamaguchi and Sasaki2009) conducted within the larger area in the intra-prism toe in sidewalls of the Tenryu submarine canyon at the eastern Nankai Trough; our aim was to investigate activity in the frontal thrusts and its links to potential geohazard risks. We focused on the prism toe area at the mouth of the Tenryu canyon, and investigated the activity in the frontal thrust from the results of dive surveys and laboratory experiments.
2. Geological structure of the accretionary prism toe
The Nankai Trough is divided on the basis of topography and seismicity into western, eastern and easternmost (Suruga Trough) zones, and each produces large subduction-type magnitude-8 earthquakes referred to as the Nankai, To-Nankai (eastern Nankai) and Tokai earthquakes, respectively. Seismic profiling has shown that the western Nankai accretionary prism is a typical thrust stack of turbidites deposited in the Nankai Trough and Shikoku Basin through accretionary wedge erosion (Kato et al. Reference Kato, Sato and Sakurai1983; Leggett et al. Reference Leggett, Aoki and Toba1985; Moore et al. Reference Moore, Shipley, Karig, Taira, Tokuyama, Kuramoto and Suyehiro1990, Reference Moore, Taira and Klaus2001; Shipboard Scientific Party, Reference Taira, Hill and Firth1991; Moore & Shipley, Reference Moore, Shipley, Hill, Taira and Firth1993; Kuramoto et al. Reference Kuramoto, Taira, Bangs, Shipley and Moore2000). In these studies, protothrust and frontal thrust zones have been interpreted to represent the early stage of sediment incorporation into the prism toe. This accretionary prism is actively developing by subduction of the Philippine Sea Plate beneath the SW Japan arc at a convergence rate of c. 4 cm a–1 (Seno et al. Reference Seno, Stein and Gripp1993) or 7–8 cm a–1 (Miyazaki & Heki, Reference Miyazaki and Heki2001) (Fig. 1; here, we adopt the former rate).
The Nankai Trough, off central Honshu, and the Tokai and Nankai regions have been damaged periodically by strong ground motions of M w 8 or larger subduction-type earthquakes that occur at 90–262-year intervals (Seno, Reference Seno2012; Hyodo et al. Reference Hyodo, Hori and Kaneda2016). Large tsunamis along the Pacific coastline and coseismic vertical deformation in coastal regions (uplift of capes Muroto and Omaezaki, and subsidence of the Kochi plain) occurred simultaneously during these events (Hyodo et al. Reference Hyodo, Hori and Kaneda2016) (Fig. 1). Reliable documentary evidence of Nankai Trough earthquakes has identified large variations in earthquake magnitudes and tsunami heights, according to the different rupture extents along the Nankai Trough (Hyodo et al. Reference Hyodo, Hori and Kaneda2016).
In the Nankai subduction zone, seismic reflection profiles have revealed steeply landwards-dipping splay faults on the trench–slope break area as being the rupture zones of the 1944 Tonankai and 1946 Nankai earthquakes (Fig. 1). These splay faults are considered to generate tsunamis, as inferred from the clear continuous seafloor lineaments on the splay fault caused by repeated fault movement (Park & Kodaira, Reference Park and Kodaira2012). In addition, Sakaguchi et al. (Reference Sakaguchi, Chester, Curewitz, Fabbri, Goldsby, Kimura, Li, Masaki, Screaton, Tsutsumi, Ujiie and Yamaguchi2011) and Hamada et al. (Reference Hamada, Sakaguchi, Tanikawa, Yamaguchi, Kameda and Kimura2015) have suggested that frontal thrust faults play an important role in seismic slip, with large displacements occurring in this region in addition to the splay faults, based on vitrinite reflectance geothermometry results from IODP NantroSEIZE cores. This implies that tsunamis might also be triggered at frontal thrust faults (Fig. 1). In fact, in the case of the 2011 Tohoku-oki earthquake in the Japan Trench, Ito et al. (Reference Ito, Tsuji, Osada, Kido, Inazu, Hayashi, Tsushima, Hino and Fujimoto2011) and Kodaira et al. (Reference Kodaira, No, Nakamura, Fujiwara, Haiho, Miura, Takahashi, Kaneda and Taira2012) verified a large coseismic slip (up to 80 m horizontally) on the frontal thrust fault, based on a comparison of detailed narrow multibeam maps before and after the earthquake.
In addition, detailed microscopic deformation textures and structures in the protothrust and frontal thrust areas have been studied using core samples from the Ocean Drilling Program (ODP) (Maltman et al. Reference Maltman, Byrne, Karig, Lallemant, Knipe, Prior, Hill, Taira and Firth1993; Moore et al. Reference Moore, Taira and Klaus2001; Ujiie et al. Reference Ujiie, Maltman and Sanchez-Gomez2004). For example, in the western Nankai accretionary prism, ODP cores show vertical microstructure variation over scales of millimetres to several metres, and seismic profiles revealed two- and three-dimensional macro-structures at a scale of hundreds of metres to kilometres. However, the spatial continuity of such intra-prism structures has not been observed, apart from during submersible studies (e.g. Kawamura et al. Reference Kawamura, Ogawa, Anma, Yokoyama, Kawakami, Dilek, Moore, Hirano, Yamaguchi and Sasaki2009).
In the eastern Nankai accretionary prism, we documented geological structures in the prism toe at the canyon through direct observations by submersible surveys during three ROV Kaiko dives (referred to as 10K) around the mouth of the canyon (10K#42, 10K#43 and 10K#52) from the R/V Kairei in 1997 (KR97-05 and KR97-06 cruises) (Kawamura et al. Reference Kawamura, Ogawa, Fujikura, Hattori, Machiyama, Yamamoto, Iwai and Hirono1999) (Fig. 2), and during one dive by the manned submersible Shinkai 6500 (6K) from the Nankai Trough floor (NTF) upslope to the prism proper (6K#755 of the YK03-03 cruise; Kawamura et al. Reference Kawamura, Ogawa, Anma, Yokoyama, Kawakami, Dilek, Moore, Hirano, Yamaguchi and Sasaki2009). During the course of these dives, the detailed topography and geology were divided into three zones (the NTF, TFT and accretionary prism proper (APP)) as shown by Kawamura et al. (Reference Kawamura, Ogawa, Anma, Yokoyama, Kawakami, Dilek, Moore, Hirano, Yamaguchi and Sasaki2009) (Fig. 2). An important observation in the eastern Nankai region is that features of the topographic surface (ridges and canyons) are strongly deformed in a chaotic fashion, probably due to later modification by incorporation of the palaeo-Zenisu Ridge into the prism or collision between these features (Le Pichon et al. Reference Le Pichon, Iiyama, Boulegue, Charvet, Faure, Kano, Lallement, Okada, Rangin, Taira, Urabe and Uyeda1987; Kawamura et al. Reference Kawamura, Ogawa, Anma, Yokoyama, Kawakami, Dilek, Moore, Hirano, Yamaguchi and Sasaki2009). The prism toe was displaced landwards during this process, possibly as a result of ridge collision.
2.a. Nankai Trough floor
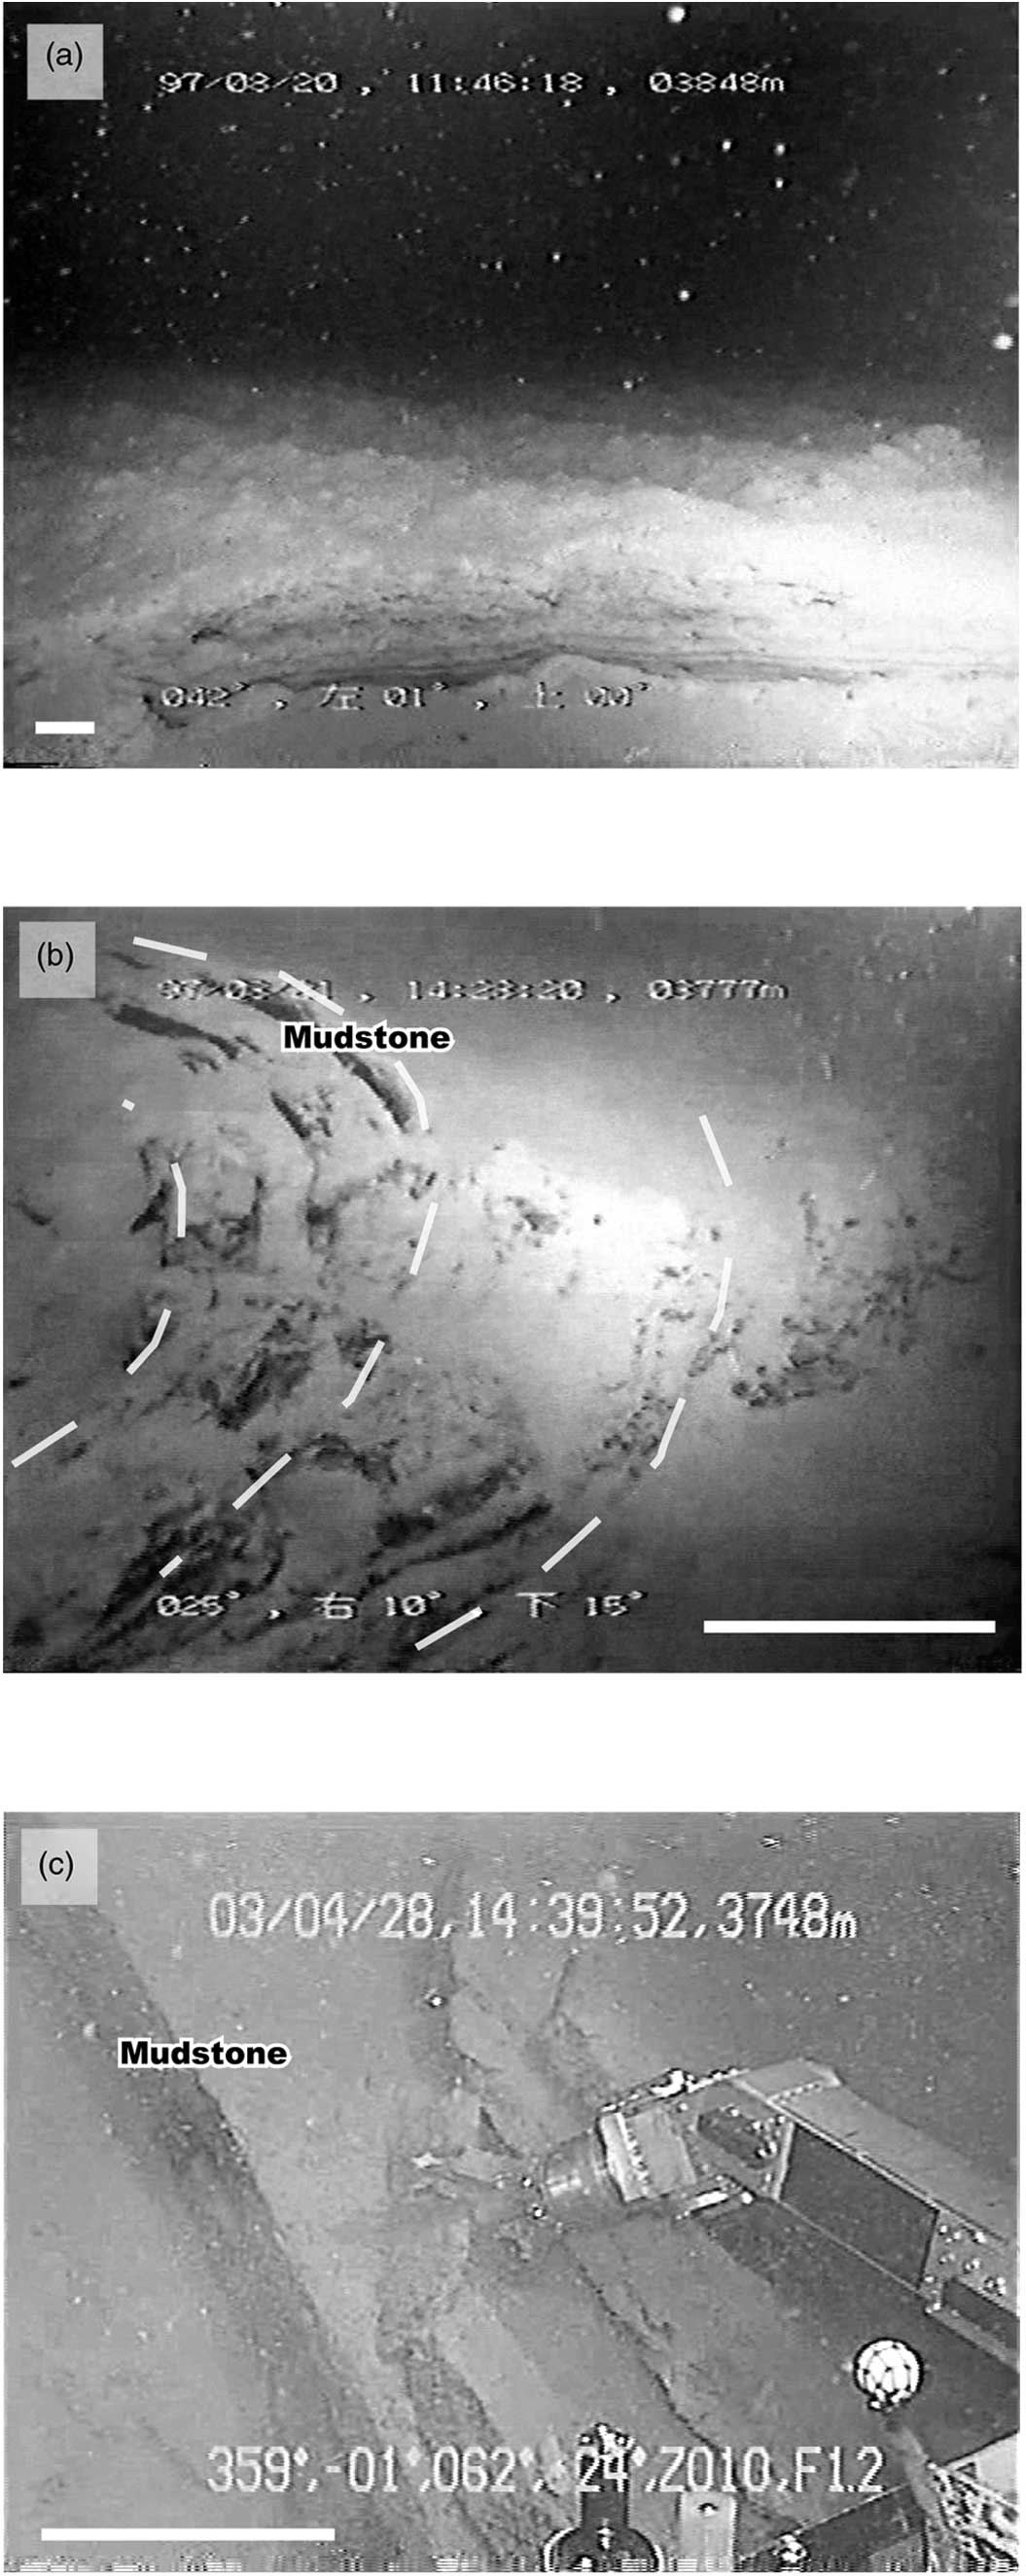
A relatively smooth, flat surface comprising horizontally undeformed strata forms a deep-sea fan of c. 10 km in diameter south of the Tenryu canyon mouth (Fig. 3a). On the NTF from 200 m to 300 m southward from the TFT, a fresh step of several metres in height dislocates the erosion gutters (Fig. 3a). These cross-cutting relations suggest that the step is much younger than the strata and gutters, and therefore very recent (Fig. 3a). The step is presumably the surficial manifestation of a protothrust. The deeper expression of a protothrust is evident in the multichannel seismic profiles across the same area (Kuramoto et al. Reference Kuramoto, Taira, Bangs, Shipley and Moore2000). On the foot of the prism toe, Le Pichon et al. (Reference Le Pichon, Iiyama, Boulegue, Charvet, Faure, Kano, Lallement, Okada, Rangin, Taira, Urabe and Uyeda1987) identified active faulting resulting from right-lateral motion of the NTF with respect to the accretionary prism along a 280° direction, which broadly corresponds to the direction of plate subduction. They suggested that this fault near the TFT has not been active for the last hundred years, given the sediment cover over the talus. We consider that there are several protothrusts and a southern protothrust (Fig. 3a) that might trigger a tsunami in this region.
Dive images. (a) Fresh step in the NTF observed during dive 10K#42. A sharp E–W-trending fault (Protothrust) cuts gutters that might be rubble driven by strong flow. (b) Southwards-dipping recumbent folded mudstone layer in TFT observed during dive 10K#43. (c) Undeformed and steeply southwards-dipping mudstone layers in the APP observed during dive 6K#755. The locations of the photographs are shown in Figure 1c.

2.b. Tenryu frontal thrust zone
Cold seepage is observed within c. 100 m upslope of the step, as the depth decreases from 3850 to 3750 m (Fig. 2). Discontinuous strata with a steep dip are commonly observed on the surface of small mounds or ridges that are several metres in height. It is important to note that both ductile fold and brittle shear deformation are developed here (Fig. 3b). Muddy rock samples exhibiting brittle deformation, 6K#755R-2-1 (3 × 3 × 10 cm), -2 (10 × 12 × 13 cm), and -3 (12 × 12 × 20 cm), were collected from strata that are c. 10 cm thick (Fig. 4a, b).
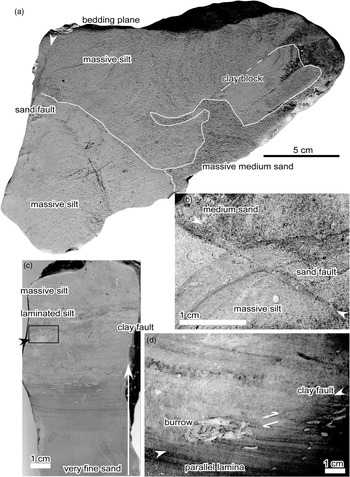
Photographs of deformation structures within retrieved rock samples. (a) Liquefied sands injected irregularly into semi-consolidated silt. This sample was collected from the frontal thrust zone (6K#755R-2-2). (b) Close-up photograph of a fault with a sandy shear zone cutting medium-grained sand and massive silt layers. This sample was collected from the frontal thrust zone (6K#755R-2-3). (c) Graded fine-grained sedimentary rock in a turbidite layer. Note the minor fault shown by an arrow. This sample was collected from the base of the Nankai accretionary prism zone (6K#755R-4-2). (d) Close-up photograph of the area shown by the black outlined rectangle in (c). A fault with a clayey shear zone cuts parallel laminae and a burrow. This sample was collected from the base of the Nankai accretionary prism zone (6K#755R-4-2).

Chemosynthetic biocommunities composed of bacterial mats and Calyptogena (clams) are randomly developed in small basins between the mounds or ridges without any linear alignment or grouping. Such biocommunities are limited to cold seepage areas on blind active faults or open cracks under surface sediments in the Nankai Trough slope (Le Pichon et al. Reference Le Pichon, Iiyama, Boulegue, Charvet, Faure, Kano, Lallement, Okada, Rangin, Taira, Urabe and Uyeda1987, Reference Le Pichon and Kobayashi1992) and Japan Trench (Ogawa et al. Reference Ogawa, Fujioka, Fujikura and Iwabuchi1996).
2.c. Accretionary prism proper
Above the frontal thrust zone, an open fold-and-thrust system characterizes the APP (Fig. 2). The open folding affects coherent and weakly fractured turbidite strata, with individual beds that are several tens of centimetres thick. The strata are either horizontal or dip gently to the south in the south limb of a fold with an E–W-trending axis (Fig. 3c). Rock samples 6K#755R-4-1 (5 × 10 × 10 cm) and -2 (15 × 15 × 20 cm) were collected from southwards-dipping strata of thickness c. 10 cm (Fig. 4c, d).
3. Rock microstructures, physical properties and consolidation tests
3.a. Microstructures
Given that the 6K rock samples were semi-consolidated, the samples for optical microscopic examination were impregnated with epoxy resin (Takizawa et al. Reference Takizawa, Kawata and Ohno1995; Kawamura & Ogawa, Reference Kawamura, Ogawa, Ludden, Plank and Escutia2002).
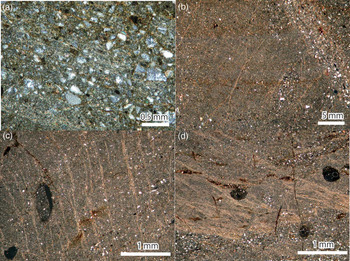
Samples 6K#755R-2-1, -2 and -3 are dark-grey fissile blocks of clastic sedimentary rocks composed of semi-consolidated massive clay, silt and sand (Fig. 4a, b). Sample R-2-1 is characterized by massive silt and R-2-2 contains a sand layer as a primary sedimentary structure (Fig. 4a). This layer is offset by a black-coloured, sand-bearing reverse fault. This fault is also present in sample R-2-3 and is characterized by a shear zone that is c. 2 mm wide, containing sand-sized particles (Fig. 4b) and platy clay minerals with a preferred orientation (Fig. 5a). The clay minerals are not only aligned along the faults, but also form a vein that extends out into the fine-grained sediments.
Deformation structures and textures in the analysed rocks. Photomicrographs of (a) the shear zone in sample 6K#755R-2-3 (cross-polarized light); (b) aligned and recrystallized illite flakes in sample 6K#755R-2-3 (cross-polarized light); (c) aligned and recrystallized illite flakes in a vein structure in sample 6K#755R-4-2 (cross-polarized light); and (d) aligned and recrystallized illite flakes in sample 6K#755R-4-2 (cross-polarized light).

Sample R-2-3 contains semi-consolidated clay clasts several centimetres in size, which were intruded by liquefied sand-sized particles under unconsolidated conditions (Fig. 4b). The liquefaction texture is further overprinted by clay veins and sand-bearing faults (Fig. 5b).
Samples 6K#755R-4-1 and -2 are composed of consolidated, greenish-grey siltstone and semi-consolidated fine-grained sandstone, respectively. Sample R-4-1 is characterized by many grey-coloured clay veins in the massive silts and sample R-4-2 is semi-consolidated fine-grained sand and laminated silt that shows upwards-fining (Fig. 4c, d). The thin parallel laminations and bioturbation are cut by grey clay-bearing reverse faults. Platy clay minerals in the fault have a strong preferred orientation. These clay-bearing faults and veins propagate perpendicular, parallel and oblique to the sand layer (Fig. 5b–d) and are further cut by normal microfaults. The perpendicular type forms a vein structure, as shown by Ujiie et al. (Reference Ujiie, Maltman and Sanchez-Gomez2004).
3.b. Physical properties
Void ratios, porosities, grain sizes (median diameter) and P-wave velocities of the 6K rock samples were measured following Kawamura & Ogawa (Reference Kawamura, Ogawa, Ludden, Plank and Escutia2002). The void ratios (related to porosity) and median diameters range over 0.6–1.1 µm (porosity, 37.5–52.4%) and 1–2 µm, respectively (Table 1).
Sampling sites and physical properties of the rock samples. PW1 is the P-wave velocity perpendicular to the bedding plane. PW2 and PW3 are orthogonal to each other and the P-wave velocities parallel to the bedding plane. MD is the median diameter of the sedimentary grains.

P-wave velocities in three directions reach values of c. 1.7 km s–1, with very little anisotropy, although the P-wave velocity in the direction parallel to bedding is 1–2% higher than that in the vertical direction in samples 6K#755R-2-2 and R-4-2 (Table 1).
3.c. Consolidation tests and yield stress measurements
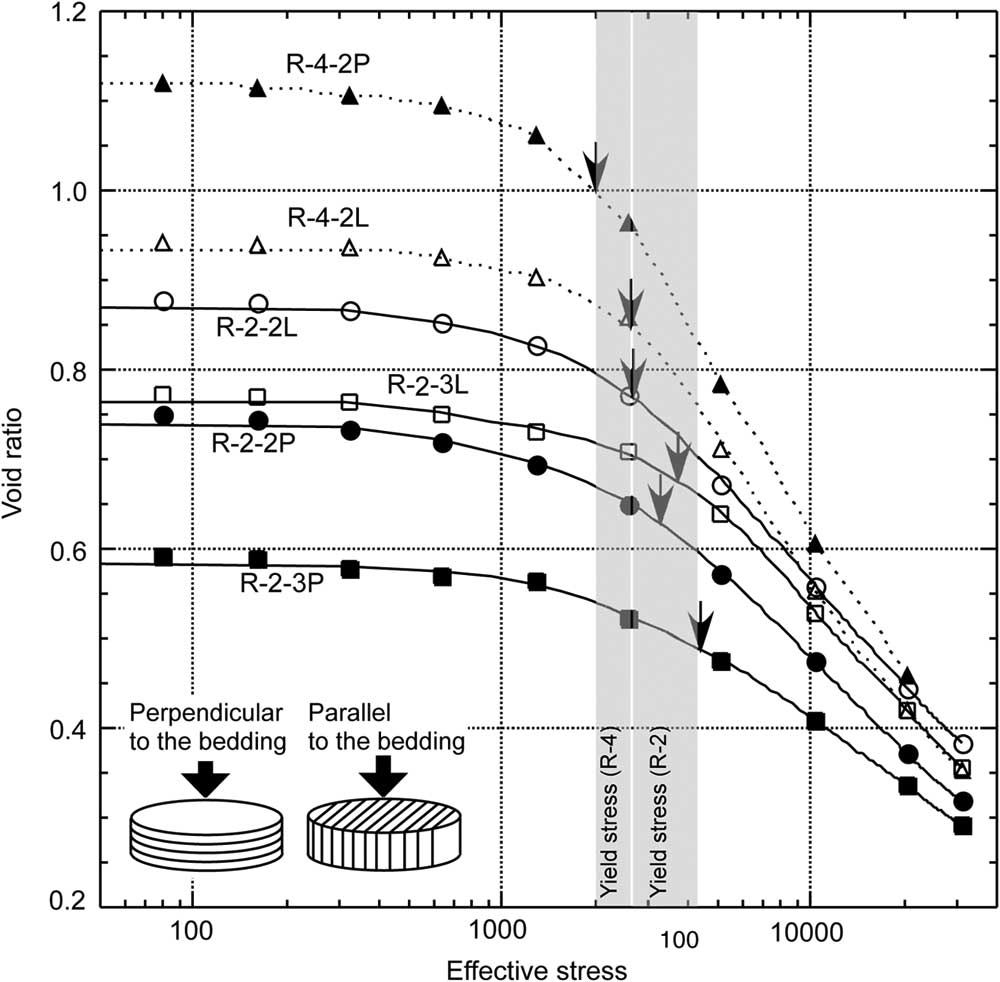
To estimate the maximum effective stress, a high-pressure consolidation test was undertaken using a DAC-169 system (SEIKEN Inc.) in two directions on the rock specimens (parallel and perpendicular to bedding; Fig. 6). The samples were cut into discs 4 cm in diameter and 2 cm in height, and set into a steel ring with a silicon grease seal. The water contents of the samples were kept constant by a cellophane wrap during cutting. The discs were loaded by a piston with a porous stone cap for 10 days by stepwise increases in stress from 80 to 30 720 kPa. During the last 12 hours, the loading stress was decreased to 80 kPa. Given that pore water escaped through the porous stone during loading, pore-water pressure was released and these are drained tests. The loading stress therefore equals the effective stress.
Results of consolidation tests (see text). Arrows show the yield stresses of samples 6K#755R-2-2, R-2-3 and R-4-2. Samples R-2-2L, R-2-3L and R-4-2L were deformed parallel to the bedding plane, as shown in the lower left of this figure. Samples R-2-2P, R-2-3P and R-4-2P were deformed perpendicular to the bedding plane.

The results of the consolidation test are shown in a plot of void ratio versus effective stress in Figure 6. The initial void ratios in the tests vary between differently dried specimens from the same samples. According to Morgan & Ask (Reference Morgan and Ask2004), who conducted the same experiments on ODP Site 808 samples from the Nankai accretionary prism off Shikoku, the compressive curve before the yield stress reflects elastic strain that is released when overburden sediment is removed; the post-yield-stress compressive curve reflects a normal consolidation state, however (e.g. breaking of particle linkages). After those stages, the samples flow in a critical state. This means that the yield stress is equivalent to the maximum effective stress experienced by the samples. The maximum effective stress is a function of overburden stress, which can be converted to the maximum burial depth using the ODP results as discussed below.
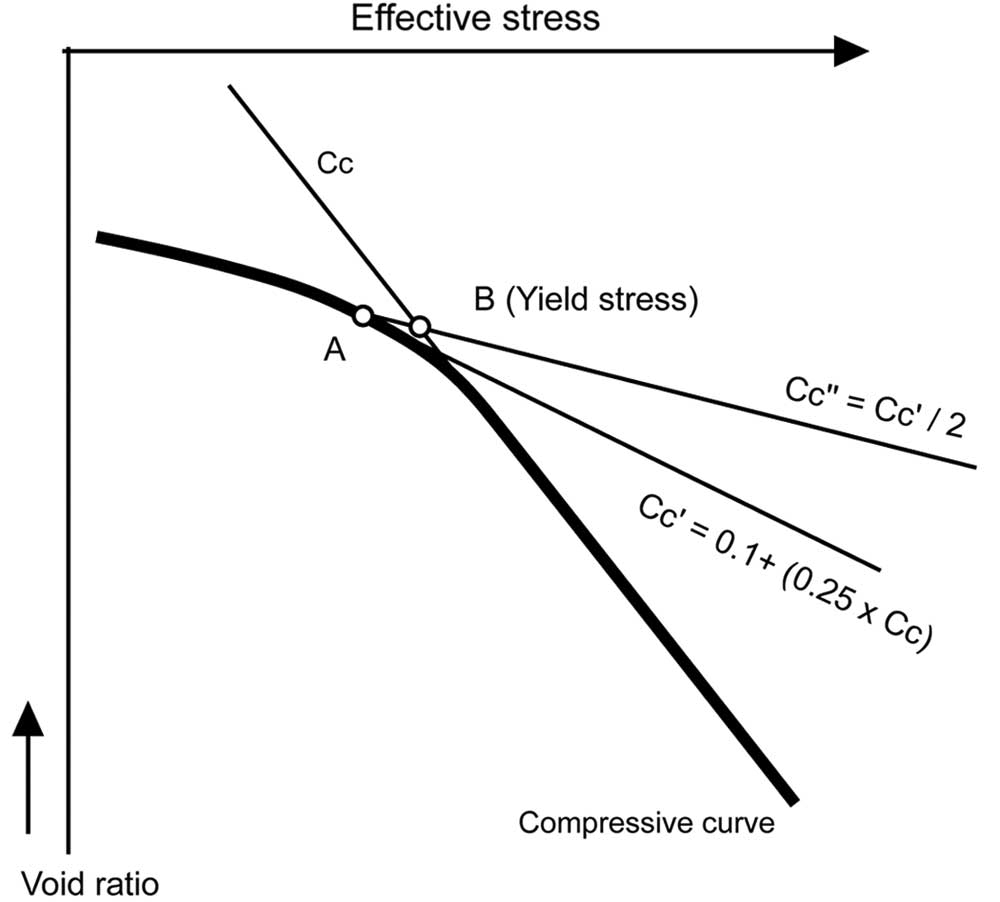
The yield stress was calculated following the method of Mikasa (Reference Mikasa1964) (Fig. 7). Values of 3.3 MPa (R-2-2), 4.4 MPa (R-2-3) and 2.0 MPa (R-4-2) were obtained in bedding-perpendicular compaction tests, and values of 2.6 MPa (R-2-2), 3.8 MPa (R-2-3) and 2.6 MPa (R-4-2) were obtained in bedding-parallel compaction tests (Fig. 6; Table 1).
Calculation of the yield stress using the method of Mikasa (Reference Mikasa1964): (1) the Cc line is drawn parallel to the lower compressive curve; (2) the Cc’ line is drawn by being fitted to the curved line using the tangent to the Cc line, and point A is the intersection between the compressive curve and Cc’; (3) the Cc’’ line is drawn using the Cc’ line passing through point A, and the intersection between Cc and Cc’’ is point B (i.e. the yield stress).

4. Discussion: deformation of the frontal thrust at the eastern Nankai accretionary prism toe
It is important to recognize that interpretation of yield stress from laboratory consolidation tests is subject to considerable uncertainties due to cementation and complex stress conditions; regardless, the results are useful for estimating in situ effective stress (Saffer, Reference Saffer, Dixon and Moore2007). The yield stress of a sample represents the maximum value of vertical effective stress that the sample has experienced in the past (Morgan et al. Reference Morgan, Ramsey, Ask, Dixon and Moore2007). As shown in our consolidation tests, the effective stresses range over 2.6–4.4 MPa (TFT) and 2.0–2.6 MPa (APP), which were then transformed into inferred burial depths of 300–450 m below the seafloor (mbsf) (TFT) and 250–300 mbsf (APP). Porosities of 37.5–2.4% and P-wave velocities of c. 1.7 m s–1 in these samples are also consistent with burial depths of 200–600 mbsf, on the basis of the ODP data of Feeser et al. (Reference Feeser, Moran, Bruckmann, Hill, Taira and Firth1993), Karig (Reference Karig, Hill, Taira and Firth1993) and Morgan & Ask (Reference Morgan and Ask2004), assuming constant burial compaction with an appropriate K0 value, the coefficient of lateral earth pressure at rest. The two different methods produce consistent maximum burial depths of c. 300 m.
According to Kawamura et al. (Reference Kawamura, Ogawa, Anma, Yokoyama, Kawakami, Dilek, Moore, Hirano, Yamaguchi and Sasaki2009), radiolarian fossil ages of the accretionary prism toe range from 0.18 Ma to the present in sample 6K#755R-2 and from 3.4 Ma to 1.98 Ma in sample 6K#755R-4. The radiolarian fossil age of sample 6K#755R-4 corresponds to 250–350 mbsf at ODP Sites 1173 and 1177 on the trough floor in the lower Shikoku Basin, which has the same lithology as the muddy turbidite sediments in the present accretionary prism toe (Shipboard Scientific Party, Reference Taira, Hill and Firth1991). All these data support the maximum burial depths estimated from the maximum effective stresses.
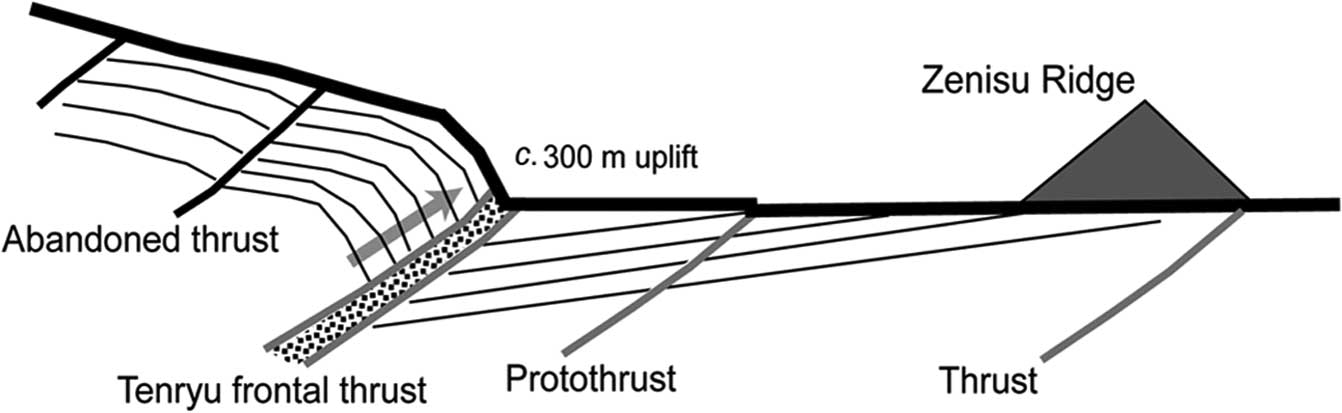
Based on seismic profiles, Tokuyama et al. (Reference Tokuyama, Ashi, Soh, Kuramoto and Ikeda1999) showed that this frontal thrust dips 30° landwards with a minimum of 500–900 m of offset. Using the radiolarian fossil age of sample 6K#755R-4, the average slip rates range over 1.47–2.53 m ka–1 for 500 m of slip and 2.65–4.55 m ka–1 for 900 m of slip. These rates fall within the Class A scale of active faults in Japan (i.e. 1–10 m ka–1). The vertical uplift rates are calculated to be 1.26 and 0.74 m ka–1 during uplift from 250 m mbsf to the seafloor, and 2.27 and 1.32 m ka–1 from 450 mbsf to the seafloor (Fig. 8). These rates are clearly higher than those at Muroto Peninsula (0.60–0.71 m ka–1) in Shikoku (Matsu’ura, Reference Matsu’ura2015) and at Omaezaki (0.4–0.8 m ka–1) in central Honshu (Azuma et al. Reference Azuma, Ota, Ishikawa and Taniguchi2005), which are both located to the north of the Nankai accretionary prism (Fig. 1).
Schematic diagram of slip dislocation and seafloor uplift at the toe of the Nankai accretionary prism.

5. Concluding remarks
We observed a protothrust at the NTF and chemosynthetic biocommunities, which are both indicators of active faulting (e.g. Le Pichon et al. Reference Le Pichon, Iiyama, Boulegue, Charvet, Faure, Kano, Lallement, Okada, Rangin, Taira, Urabe and Uyeda1987) on the TFT. These features are concentrated in the lower accretionary prism toe slope area, and might be due to the hanging wall of the TFT forming a fracture-damaged zone and permeable conduits. Based on this evidence, we conclude that the TFT is an active thrust fault.
The driving mechanism of the TFT may be associated with a large submarine slide. During the 6K#887 and 6K#894 dive surveys, numerous normal faults were observed at the base of the sidewall at the mouth of Tenryu Canyon (Kawamura et al. Reference Kawamura, Ogawa, Hara, Anma, Dilek, Kawakami, Chiyonobu, Mukoyoshi, Hirano, Ogawa, Anma and Dilek2011). This suggests that normal faulting has frequently occurred at the accretionary prism toe. According to Kawamura et al. (Reference Kawamura, Ogawa, Hara, Anma, Dilek, Kawakami, Chiyonobu, Mukoyoshi, Hirano, Ogawa, Anma and Dilek2011), normal faulting (i.e. landsliding) has taken place at the toe of the eastern Nankai accretionary prism, due to large-scale subsidence and uplift associated with seamount subduction of the palaeo-Zenisu Ridge at 3.8 Ma. The normal fault displacement may be the result of gravitational collapse, and could further push the uplifted sediments at the prism toe more rapidly towards the trench along the out-of-sequence thrust (OOST). The submarine slide could contribute to additional thrust faulting at the prism toe, as is the case in the Japan Trench (Kawamura et al. Reference Kawamura, Sasaki, Kanamatsu, Sakaguchi and Ogawa2012; Strasser et al. Reference Strasser, Kolling, Ferreira, Fink, Fujiwara, Henkel, Ikehara, Kanamatsu, Kawamura, Kodaira, Romer and Wefer2013). A rupture during a future Tokai earthquake could propagate onto the NTF and trigger a tsunami due to ground deformation produced by the TFT and/or protothrust.
Acknowledgements
We acknowledge Mutsuo Hattori (Japan Agency for Marine-Earth Science and Technology) and Juichiro Ashi (University of Tokyo), chief scientists on the KR97-05/06 and YK03-03 cruises, respectively. We also thank the captains, crews, shipboard scientists and operation teams of ROV Kaiko and the Shinkai 6500 submersible during the KR97-05/06 and YK03-03 cruises. Takashi Yoshida and Osamu Kyono (OYO Corporation) are thanked for conducting the uniaxial compression tests. Ken Ikehara (Geological Survey of Japan) assisted with the grain size measurements. We are grateful for the critical reviews and revisions of an early draft of this paper by Roy Wilkens (University of Hawaii) and Gregory Moore (University of Hawaii). We thank Professor Yildirim Dilek (Miami University), Professor Andrea Festa (University of Torino) and an anonymous reviewer for their many constructive comments.