The process of ion implantation in silicon produces damage and defects that usually undergo extensive diffusion, annihilation and agglomeration during heat treatment.[Reference Chason, Picraux, Poate, Borland, Current, Diaz de la Rubia, Eaglesham, Holland, Law, Magee, Mayer, Melngailis and Tasch1, Reference Libertino, La Magna and Bernas2] Some of the residual defects following annealing are optically active when excited by photons or electrons.[Reference Davies3, Reference Charnvanichborikarn4] In such cases, the defects give rise to a defect state within the band gap of silicon that allows a direct sub-band gap transition and the emission of light. In particular, the interstitial-based defects (clusters and extended defects) in silicon can be optically active.[Reference Davies3] As the ion-implantation fluence and annealing temperature are raised, the residual defects evolve into interstitial defect clusters, rod-like defects (RLDs) and ultimately dislocations. The tri-Si-interstitial clusters, for example, are thought to be the origin of the W-line emission at 1218 nm.[Reference Davies, Lightowlers and Ciechanowska5–Reference Giri7] The {311} RLDs are associated with R-line luminescence at 1372 nm,[Reference Davies3, Reference Schmidt, Svensson, Seibt, Jagadish and Davies8] while dislocations are associated with so-called D-bands at wavelengths above 1500 nm. The {311} RLDs have received much interest in the past decade mainly due to their ability to facilitate transient enhanced diffusion (TED) of boron, a common p-type dopant in silicon, when they dissociate to release a flux of Si-interstitials.[Reference Eaglesham, Stolk, Gossmann and Poate9] A comprehensive understanding of the TED process in the presence of {311} RLDs has become increasingly important as devices shrink to a sub-micron scale. Apart from this obvious technological importance, the structural and optical properties of {311} RLDs have also been of interest,[Reference Libertino, La Magna and Bernas2, Reference Davies3] the latter for the possibility of enhancing light emission from silicon.[Reference Yasutake, Igarashi, Tana-ami and Fukatsu10] Previous studies have shown that the {311} defect is a chain of Si-interstitials with a {311} habit plane and extending along the 〈110〉 direction.[Reference Matthews and Ashby11] Their formation takes place after Si-implantation at sub-amorphizing fluences of the order of 1013 cm−2 and following annealing at a temperature between 600 and 850 °C.[Reference Coffa, Libertino and Spinella12–Reference Davies, Harding, Jin, Mainwood and Leung-Wong14] In addition, Chou et al. [Reference Chou, Cockayne, Zou, Kringhøj and Jagadish15] further reported that a small proportion of the RLDs (14%) had a {111} habit plane. Although, {311} RLDs have been proposed to be responsible for the R-line emission,[Reference Coffa, Libertino and Spinella12, Reference Lightowlers, Jeyanathan, Safonov, Higgs and Davies16] no quantitative correlation has yet been made between the R-line intensity and the nature (size and density) of RLDs and their environment. The current study addresses this issue.
In this work, photoluminescence (PL) and transmission electron microscopy (TEM) are used to monitor both the evolution and intensity of the R-line luminescence and to quantify the average concentration and nature (size) of implantation-induced RLDs as a function of annealing time. We find that there is no simple correlation between the R-line intensity and the RLD size or density, despite the fact that the presence of RLDs is essential for R-line luminescence. We suggest that the R-line intensity also appears to be sensitive to other effects such as local strain, the nature of disorder surrounding {311} defects or impurity effects.
Cz-grown boron-doped p-type (100) Si wafers with a resistivity of 5–25 Ω cm were irradiated at room temperature with 80 keV Si− ions to a fluence of 5 × 1013 cm−2, which produces a large number of excess Si-interstitials and subsequent {311} defects beyond the ion projected range (~110 nm[Reference Biersack and Haggmark17]) after annealing. We note that the chosen fluence is below a silicon amorphization threshold and was found to provide the optimum conditions for maximum R-line intensity for the ion energy used. The average scanned ion flux was kept constant at 3.45 × 1011 cm−2 s−1 to prevent unnecessary substrate heating. The implanted wafer was cut into several 3 mm diameter discs using a Gatan 601 ultrasonic cutter. A postimplantation anneal was then carried out for each sample in N2 ambient with a fixed flow rate of ≈0.65 L/min from 10 to 90 min at 700 °C, where the sample was both inserted into and removed rapidly from the preheated furnace zone to promote rapid thermal ramping and cooling rates. Following annealing, the samples were mounted on a cryostat holder suitable for PL measurements and cooled to 13 K, where a 10 mW 532 nm laser was used to excite the luminescence. The PL spectra were dispersed by a SpectraPro-2500i triple grating monochromator equipped with a temperature-controlled InGaAs infrared photodetector. These same samples were used to prepare plan-view TEM specimens. The disc-shaped samples were mechanically thinned and dimpled from the backside down to about 10 µm at the center. Chemical etching was performed to perforate the samples, yielding large electron transparent regions. A Philips CM300 electron microscope operated at 300 kV was used to characterize all the TEM specimens. We examined regions of the foil that were thick enough to contain the RLD defect band entirely within the foil to ensure that the defects did not intersect the foil surfaces. All the TEM images were recorded under a weak-beam dark field (WBDF) condition using a g-ng diffraction arrangement, where g = 022 and n = 3.2. This imaging condition was used to survey the defect density but detailed Burgers vector determination of the RLDs was not carried out within the scope of this work. The inclination of the defect lines with respect to the TEM foil (as observed by an oscillating (dotted) contrast)[Reference Wong-Leung, Fatima, Jagadish, Fitz Gerald, Chou, Zou and Cockayne18] is also taken into account when determining the size of the defect.
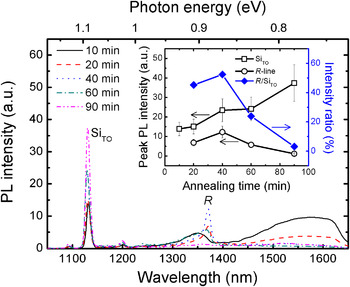
Figure 1 shows the PL spectra measured at 13 K from the Si-implanted samples isothermally annealed at 700 °C for different time periods from 10 to 90 min. The signal from silicon band-edge luminescence SiTO at 1130 nm is observed in all the spectra and becomes brighter with increasing annealing time, as a result of a progressive reduction in the overall implantation-induced disorder. Annealing for 10 min results in a small but broad peak centered around 1350 nm, and a larger and broader feature beyond 1400 nm. Unlike the SiTO, the R-line luminescence is observed only after annealing from 20 to 60 min. Indeed, the R-line is maximized in intensity by 40 min and disappears completely by 90 min. At first sight, the loss of R-line intensity after 90-min annealing is in disagreement with a previous study, where a strong R-line was observed after annealing at 700 °C for at least an hour.[Reference Libertino, Coffa, Spinella, La Magna and Privitera19] However, the implantation regime used in this previous study (1.2 MeV Si to a fluence of 1013 cm−2) is expected to initiate a different defect evolution pathway during annealing from that in our study.
PL spectra for silicon samples implanted with 80 keV Si ions to a fluence of 5 × 1013 cm−2 and a subsequent anneal at 700 °C for various times. The inset displays intensities of a silicon peak (open squares) and the R-line (open circles) as a function of annealing time. The intensity ratio of the R-line to silicon peak (solid diamonds) is plotted in the right ordinate.

We note after 60-min annealing that the R-line peak is not only lower in intensity but also slightly shifted to shorter wavelength. It is also noteworthy that a longer wavelength broad luminescence band (from 1425 to 1650 nm) is observed in most of the cases, and is particularly strong at annealing times ≤20 min. Thus, it is tempting to speculate that this broad feature may arise from either small interstitial clusters[Reference Cowern, Mannino, Stolk, Roozeboom, Huizing, van Berkum, Cristiano, Claverie and Jaraíz20] or strained regions[Reference Weman, Monemar, Oehrlein and Jeng21] that have not fully evolved into extended defects, a fact that is clarified later by TEM.
In order to interpret the PL spectra, it is important to treat the effect of implantation damage carefully. The process of ion-implantation usually introduces lattice damage that contributes to the formation of non-radiative recombination centers, leading to an overall loss of luminescence intensity. Harding et al. [Reference Harding, Davies, Hayama, Coleman, Burrows and Wong-Leung22] have suggested that the effect of radiation damage may be gauged by examining the intensity of the relevant peak (R-line) relative to the silicon (SiTO) peak. The inset of Fig. 1 plots the PL peak intensities of the R-line (open circles) and SiTO (open squares) peak against the annealing time, while the intensity ratio of the R-line to SiTO for each annealing time is shown with respect to the right-hand axis. Clearly, the R-line intensity drops after 40 min, whereas the SiTO increases as the implantation damage is removed.
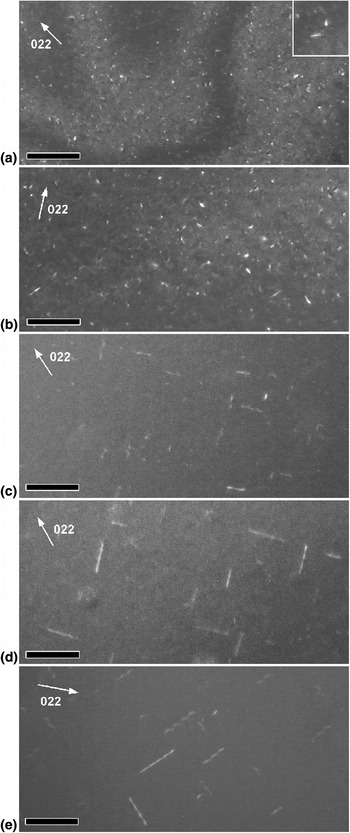
Figure 2 shows representative plan-view TEM images of the corresponding samples. The RLDs exist in all samples; however, they are not well formed and are very dilute in the 10-min annealed sample [Fig. 2(a)]. Indeed, most of the defects observed after 10-min annealing are nanometer-sized clusters, which may be regarded as possible precursors of the RLDs. The inset of Fig. 2(a) shows a close-up image of embryonic RLDs and clearly indicates a preferential line orientation in spite of its short dimension. The other samples annealed from 20 to 90 min are illustrated in Figs. 2(b)–2(e). In fact, the RLDs can clearly be found to elongate in 〈110〉 directions after annealing for 40 min. The size distributions of the RLDs are compared for the various annealing times in Fig. 3.
WBDF micrographs illustrating in plan-view RLDs formed in silicon by 80 keV Si-ion implantation and subsequent 700 °C annealing for (a) 10 min, (b) 20 min, (c) 40 min, (d) 60 min and (e) 90 min. The scale bars represent 100 nm.

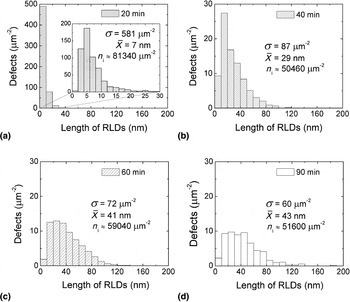
Statistical collection illustrating the size and density of the RLDs distributed after annealing at 700 °C for (a) 20 min, (b) 40 min, (c) 60 min and (d) 90 min. The inset of (a) shows a distribution of RLD after 20 min annealing in a refined scale.

As shown in Fig. 3, the defect distribution changes significantly with increasing annealing time. These interstitial-based RLDs gradually grow (at a non-linear rate) with time up to 60 min but their average length ( ) remains virtually constant on further annealing, consistent with a previous finding.[Reference Moller, Jones and Law23] The RLD concentration (σ), on the other hand, decreases abruptly during the 20- to 40-min period but more slowly upon prolonged annealing. This observation suggests a growth of the RLDs, and the liberation of interstitials during the annealing.[Reference Stolk, Gossmann, Eaglesham, Jacobson, Rafferty, Gilmer, Jaraíz, Poate, Luftman and Haynes24, Reference Pan and Tu25] Assuming that 1 nm of an RLD contains 20 interstitials,[Reference Stolk, Gossmann, Eaglesham, Jacobson, Rafferty, Gilmer, Jaraíz, Poate, Luftman and Haynes24, Reference Takeda26] it is possible to estimate the number of Si-interstitials (n i) involved in RLDs from the distributions, which is given in each case in Fig. 3. The loss of interstitials from the RLDs during growth and dissolution is about 30% between 20 and 40 min and becomes less significant for further annealing up to 90 min.
Previous work has correlated the R-line luminescence to the presence of the {311} defects.[Reference Coffa, Libertino and Spinella12] However, the present study has provided a quantitative correlation that illustrates that the presence of {311} defects alone is not sufficient to guarantee R-line luminescence. In our case, where the majority of defects appear to be ill-defined interstitial clusters in the 10-min annealed samples, the lack of R-line luminescence may be a result of the small size of the {311} defects. Indeed, Schmidt et al. [Reference Schmidt, Svensson, Seibt, Jagadish and Davies8] have argued that R-line luminescence is not observed in samples containing very short {311} defects of size ≲5 nm. Thus, a more complex explanation is required to explain the disappearance of the R-line (and the evolution of the luminescence spectrum) for the 90-min anneal since there is little change in the size and density of the RLDs between the 60- and 90-min-annealed cases. Furthermore, the intensities of the R-line luminescence in the 20- and 40-min-annealed samples are comparable (within a factor of 2), although the distribution profiles of the RLDs are widely different. Specifically, the sample annealed for 20 min contains a high concentration of short RLDs, while those in the sample annealed for 40 min are undoubtedly fewer and much longer (see Fig. 3). This suggests that RLDs of different sizes may contribute unequally to the R-line luminescence.
Based on the above results, an explanation of R-line luminescence based solely on an optimum RLD size is questionable. Furthermore, the estimated total number of Si-interstitials that are trapped in RLDs in 60- and 90-min anneal cases is similar, hence the R-line intensity does not scale with the number of Si interstitials. Let us now explore some other possibilities to explain our results such as strain-stimulated luminescence from {311} defects and the role of competing quenching mechanisms that can decrease the R-line intensity.
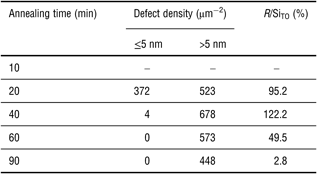
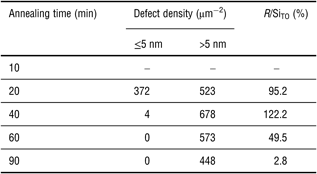
Firstly, local strain surrounding defects has previously been proposed as a contributing factor in radiative recombination associated with RLDs that gives rise to the R-line.[Reference Lightowlers, Jeyanathan, Safonov, Higgs and Davies16] Although our TEM analysis of strain fields around the defects could not be quantified, it remains possible that the strain surrounding {311} defects, and its relaxation at longer annealing times can explain our results. Secondly, as shown in Table I, the concentration of {311} defect sizes <5 nm is highest after 20-min annealing and decreases abruptly with increasing annealing time. On the other hand, the concentration of larger {311} defects (>5 nm) increases with annealing time up to 40 min and then decreases, which follows the trend of the R/SiTO intensity ratio but the latter decreases well over an order of magnitude more rapidly. This observed relationship is in agreement with the previous finding that the small size {311} defects (≤5 nm), of which surrounding strain may not have fully developed, do not give rise to the R-line.[Reference Schmidt, Svensson, Seibt, Jagadish and Davies8] However, the intensity ratio of the R-line decreases at a much faster rate than the evaporation of the large RLDs (>5 nm). It is possible that the prolonged anneal may lead to a state where the surrounding strain is reduced as the RLDs further develop and is not sufficient to assist exciton recombination at the defect sites. Finally, processes competing with luminescence from {311} defects such as other non-radiative recombination centers associated with irradiation damage,[Reference Harding, Davies, Hayama, Coleman, Burrows and Wong-Leung22] quenching by dopant effects and trapping of impurities at defects[Reference Haynes, Eaglesham, Stolk, Gossmann, Jacobson and Poate27, Reference Brindos, Keys, Jones and Law28] may play an important role, especially at long annealing times. For example, gettering of (metal) impurities to dislocations has previously been suggested as a possible cause for observed changes in band-edge luminescence.[Reference Higgs, Lightowlers, Norman and Kightley29, Reference Tereshchenko, Steinman and Mazilkin30]
Defect density and R-line luminescence intensity for different annealing times.
In summary, we have conducted experiments to quantitatively investigate the link between R-line luminescence and physical properties of the corresponding RLDs formed by Si-implantation and thermal annealing. Our observations suggest that the relationship between the RLD size and density and R-line luminescence intensity is complicated, whereby very small RLDs under 5 nm contribute minimally to the R-line intensity. Other factors such as the local strain surrounding the defect regions and residual damage, dopant effects or impurities could potentially influence detection of the R-line at longer annealing times.
Acknowledgments
One of the authors (S.C.) thanks Bianca Haberl for assistance in TEM sample preparation. This work was funded by the Australian Research Council. This work was performed under the auspices of the U.S. DOE by LLNL under Contract DE-AC52-07NA27344.