Introduction
The genus Dissostichus (Nototheniidae) comprises two commercially important fishes: the Patagonian toothfish, D. eleginoides Smitt, which is found throughout much of the Southern Ocean, and the Antarctic toothfish, D. mawsoni Norman, which is found in the sub-zero waters south of the Antarctic Polar Front. Dissostichus mawsoni supports a longline fishery in the Ross Sea, which is managed by the Commission for the Conservation of Antarctic Marine Living Resources (CCAMLR) as an exploratory fishery. This status requires that the fishery has a precautionary catch limit, set at a level that is not substantially above that necessary to obtain information on the biology and potential yield of the target species, the potential impacts on dependent and related species, and to allow guidance on harvest levels to be set (CCAMLR 2012). Research to address the potential impact of the fishery on dependent and related species has included a programme to determine and monitor the diet of D. mawsoni.
A number of publications have examined the diet of D. eleginoides (e.g. Pilling et al. Reference Pilling, Purves, Daw, Agnew and Xavier2001, Goldsworthy et al. Reference Goldsworthy, Lewis, Williams, He, Young and van den Hoff2002, Arkhipkin et al. Reference Arkhipkin, Brickle and Laptikhovsky2003), but the diet of D. mawsoni is less well studied. Previous studies of D. mawsoni include the opportunistic examination of fish preyed on by Weddell seals (Wohlschlag Reference Wohlschlag1968, Calhaem & Christoffel Reference Calhaem and Christoffel1969) and sperm whales (Yukov 1971), and some specific feeding studies (Eastman Reference Eastman1985a, Reference Eastman1985b, Gröhsler Reference Gröhsler1992, Pakhomov & Tseytlin Reference Pakhomov and Tseytlin1992, Takahashi & Iwami Reference Takahashi and Iwami1997, Fenaughty et al. Reference Fenaughty, Stevens and Hanchet2003, Kokorin Reference Kokorin2010, Petrov & Tatarnikov Reference Petrov and Tatarnikov2011, Roberts et al. Reference Roberts, Xavier and Agnew2011). Prior to Fenaughty et al. (Reference Fenaughty, Stevens and Hanchet2003), all D. mawsoni diet studies were based on fewer than 60 fish.
Fenaughty et al. (Reference Fenaughty, Stevens and Hanchet2003) studied the stomach contents of 9363 D. mawsoni from the western Ross Sea over two summers. Only the frequency of prey occurrence was recorded as the examinations took place aboard a commercial fishing vessel where facilities were limited. Furthermore, due to the advanced digestion of many prey, the identification to genus or species level was difficult and most prey were only identified to high taxa. Therefore, the study provided important, but preliminary, information on the diet of D. mawsoni. The main prey were finfish, with icefish (Channichthyidae) and grenadiers being the most commonly identified; some squid and prawns were also common, along with rocks and bait (Fenaughty et al. Reference Fenaughty, Stevens and Hanchet2003).
Kokorin (Reference Kokorin2010) studied the stomach contents of 2058 D. mawsoni from the Ross and Amundsen seas. The main prey in 1336 Ross Sea toothfish was finfish (predominantly Macrourus whitsoni (Regan), Muraenolepis spp., Chionobathyscus dewitti Andriashev and Neelov, and Trematomus spp.).
Petrov & Tatarnikov (Reference Petrov and Tatarnikov2011) studied the stomach contents of D. mawsoni from the Lazarev Sea. By frequency of occurrence and weight, the main prey were finfish (predominantly C. dewitti and Macrourus whitsoni) and cephalopods (predominantly Mesonychoteuthis hamiltoni Robson and Kondakovia longimana Filippova).
Roberts et al. (Reference Roberts, Xavier and Agnew2011) studied the stomach contents of D. eleginoides and D. mawsoni around the South Sandwich Islands, one of the few areas where the species co-exist. Despite large differences in the number of stomachs containing prey, the diets were broadly similar, with > 90% of the prey mass comprising finfish (mainly grenadiers and eel cods) and cephalopods (mainly K. longimana).
In this study we describe the diet of D. mawsoni in the Ross Sea region using stomach contents. Our study had three specific aims: i) to determine whether the diet composition of toothfish varied between sub-adults and adults from the continental slope, ii) to determine whether the diet composition of adult toothfish varied between the continental slope and oceanic features to the north and iii) to determine whether there was significant variability in diet composition of adult toothfish from within a relatively well-sampled area of the continental slope.
Materials and methods
Stomach samples
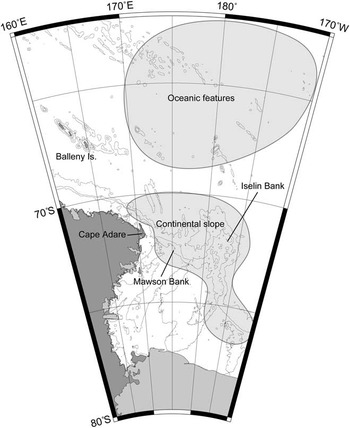
Stomach samples from toothfish were obtained during voyages of commercial longliners fishing under exploratory permits in the western Ross Sea (CCAMLR subarea 88.1) (Fig. 1) during the 2003, 2005 and 2010 summer seasons. ‘Season’ refers to the period December–May, the main fishing period in the middle of the CCAMLR fishing year (e.g. 2010 refers to the 2009–10 fishing year).
Locality map showing the general position of non-empty stomach samples. Lines indicate the 500 m, 1000 m and 2000 m isobaths.

Toothfish were caught by bottom longline at depths from 770–1890 m, using size 13–15 autoline hooks baited with jack mackerel (Trachurus spp.), arrow squid (Nototodarus spp.), blue mackerel (Scomber australasicus Cuvier) and barracouta (Thyrsites atun (Euphrasén)). Biological data (total length (TL), total weight, sex and macroscopic gonad stage) and stomachs were collected from toothfish by scientific observers (CCAMLR and New Zealand Ministry for Primary Industries) and Sanford Ltd company liaison Jack Fenaughty. In the laboratory each stomach was examined and graded on a qualitative scale according to its fullness as empty, trace, part full or full. Individual food items were identified to the lowest possible taxonomic level, counted and weighed. The state of prey digestion was recorded qualitatively as fresh, slightly digested, moderately digested or digested. Fish prey were identified using Gon & Heemstra (Reference Gon and Heemstra1990) and the otolith descriptions of Williams & McEldowney (Reference Williams and McEldowney1991). Cephalopod prey were identified using the cephalopod beak descriptions of Clarke (Reference Clarke1986). Otoliths and beaks from reference collections were used to aid identification.
The unidentifiable prey, prey classified as digested and parasites, including gnathiid isopods, sphyrion copepods, anisakid nematodes and leeches, were excluded from detailed diet analyses. Small scavenging cirolanid isopods (Natatolana spp.) and lysianassid amphipods (Orchomenella spp.) were considered to be incidental prey ingested along with large prey and were also excluded from detailed diet analyses.
Analysis of diet composition
The data were too confounded to allow a single analysis of diet composition and variability across all fish sizes and areas. Therefore, three diet composition analyses were completed. First, the composition of the diet was compared between adult and sub-adult toothfish on the continental slope. Adult toothfish were assumed to be those ≥110 cm TL (Parker & Grimes Reference Parker and Grimes2009). Second, the composition of the diet of adult toothfish was compared between the continental slope and oceanic features of elevated topography to the north, such as ridges, hills and seamounts. Allocation of samples to slope or oceanic features was achieved by dividing the study area at 70°S, with oceanic features only fished to the north. Third, diet variability was examined for adult toothfish on the continental slope between 174°E–176°W and 70–73.5°S, where the majority of the stomach samples were obtained (Fig. 1).
The composition of the diet was described by the numerical importance (%N), frequency of occurrence (%F), weight (%W) and percentage index of relative importance (%IRI) (Pinkas et al. Reference Pinkas, Oliphant and Iverson1971). Bootstrap methods consisting of 1000 replicates of random samples with replacement from the original dataset, stratified by tow, were used to estimate 95% confidence intervals around the dietary statistics (Tirasin & Jørgensen Reference Tirasin and Jørgensen1999).
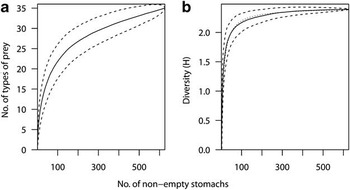
To conduct analyses of diet variability, the prey items were aggregated into taxonomic categories. To assess the adequacy of the samples, the cumulative diversity (Brillouin index of diversity, H) of categorized stomach contents was plotted against the cumulative number of stomachs containing food. The mean cumulative curve, and 95% credible intervals describing the shape of the curve, were calculated from 1000 curves based upon different random orders of the stomachs. The total sample was considered adequate once the mean sample diversity (H) was ≥95% of the asymptotic diversity (HA), estimated from a fitted curve of the form H = aN(1 + bN) -1 (Dunn Reference Dunn2009). The asymptotic curves were also fitted to subsets of the data, for each subset the sample prey diversity was expressed as a percentage of the estimated asymptote.
Multivariate statistical analyses were used to determine which factors were influencing the diet composition of toothfish from the continental slope. Distance-based linear model (DistLM) analysis in PRIMER v6 (Clarke & Warwick Reference Clarke and Warwick2006, Anderson et al. Reference Anderson, Gorley and Clarke2008) was used to identify which of nine biological, environmental and temporal predictors explained a significant proportion of the variability in diet composition. The weight of prey observed in each toothfish was first standardized, then square-root transformed and a dissimilarity matrix calculated using Bray-Curtis distances. The predictors investigated were biological (TL, sex and weight), temporal (season of sampling, i.e. summer between October–March, and month), spatial (latitude, longitude and a spatial model) and depth. Latitude and longitude were tested in addition to the spatial model because there were a priori hypotheses that diet might change with these predictors. The spatial model was a cubic trend surface, which allowed for more complex features such as gaps and patches (Legendre Reference Legendre1990, Borcard et al. Reference Borcard, Legendre and Drapeau1992). To estimate the spatial model, the variables for longitude (x) and latitude (y) were first centred on their means, and then terms for a cubic trend surface regression were tested, i.e. x, y, x2, y2, x3, y3, xy, x2y and xy2. The spatial terms included were selected by sequential testing using the stepwise DistLM procedure and the Akaike Information Criterion (AIC) (Anderson et al. Reference Anderson, Gorley and Clarke2008), and the selected terms then included in subsequent tests as the ‘spatial model’. The depth predictor was treated as independent because it was both a component of space (i.e. xyz) and also aliased for environmental conditions (i.e. light, temperature and pressure). The results of the subsequent DistLM analyses were conditional tests, fitting each predictor conditional on all other predictors already being in the model. This effectively tests the null hypotheses that each predictor has no effect after the effect of the other predictors has been removed, thereby attempting to control for potentially confounded sampling designs (Borcard et al. Reference Borcard, Legendre and Drapeau1992, Anderson & Gribble Reference Anderson and Gribble1998). When TL was tested weight was excluded from the conditional terms, and similarly when the spatial model was tested latitude and longitude were excluded (and vice versa).
The variability in diet composition for toothfish on the continental slope was examined only for the predictors that were significant (P ≤0.05) in the conditional DistLM tests. The spatial model allowed complex spatial variability. The diet (standardized prey weight) was examined by first objectively grouping samples with similar diets using hierarchical agglomerative clustering (Clarke & Warwick Reference Clarke and Warwick2006, Forman & Dunn Reference Forman and Dunn2012), using a dissimilarity matrix calculated using Bray-Curtis distances and cluster analysis performed using the average linkage method. Groups (clusters) were significant (at the 1% level) using the PRIMER permutation test SIMPROF (Clarke & Warwick Reference Clarke and Warwick2006), and had a sample size greater than 20 stomachs. Samples not included in the significant groups were considered to be ‘outliers’. The sample statistics for the significant predictors, the spatial distribution (if selected) and the diet composition were then examined for each significant group. Prey types characteristic of the diet composition of each group were identified using SIMPER (similarity percentages; Clarke & Warwick Reference Clarke and Warwick2006). The actual mean percentage weight of the prey groups identified by SIMPER was then calculated to show the main differences in diet composition between groups. The locations of samples in each significant group were examined but have not been included because the catch location information was considered commercially sensitive.
Results
Overall sample
Of 1022 stomachs examined, 9.8% were empty, 57.0% were part full and 7.6% were full. Between 1–17 prey items were identified per stomach, with most stomachs (75.4%) containing only a single prey item and 95.4% containing fewer than five prey items. There were 296 stomachs containing only well digested or unidentifiable prey (29.0%), leaving 626 (61.2%) for detailed analyses of diet composition. Of these, 454 stomachs were from fish caught on the continental slope between 174°E–176°W and 70–73.5°S. New types of prey continued to be identified with increasing sample size of non-empty stomachs. However, the diversity of prey categories reached 75% of the estimated asymptote after 28 stomachs, 90% after 94 stomachs and 95% after 198 stomachs (Fig. 2), indicating that the overall sample was large enough to describe the diversity of the diet.
a. The mean cumulative number of prey types identified. b. The mean cumulative diversity of prey categories (measured using the Brillouin index of diversity, H). Dashed lines indicate 95% credible intervals. Dotted line in b. is a fitted curve from which asymptotic diversity was estimated.

Comparison of sub-adult and adult diet
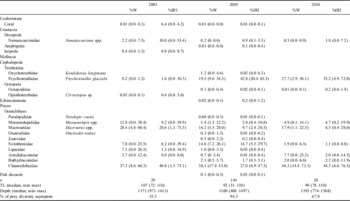
Icefish (probably mainly C. dewitti) and Macrourus grenadiers were important prey in both sub-adult and adult toothfish. However, grenadiers were more important by %W and %IRI in adult fish (Tables I and II). Sub-adult toothfish ate smaller prey than adults, with smaller taxa such as Trematomus spp., dragonfish (mainly Bathydraco spp.) and Nematocarcinus sp. prawns being more important in the diet. Large onychoteuthid squid (K. longimana) were rarely eaten by sub-adults but smaller glacial squid (Psychroteuthis glacialis Thiele) were eaten more frequently.
Comparison of the percentage by weight (%W) and percentage by Index of Relative Importance (%IRI) of prey items in the diet of sub-adult Dissostichus mawsoni sampled from oceanic features and the continental slope in the western Ross Sea during 2003, 2005 and 2010. The 95% confidence intervals estimated by bootstrap resampling are given in brackets.

n = number of stomachs containing food, TL = fish total length.
Species authorities: Kondakovia longimana Filippova, Psychroteuthis glacialis Thiele, Notolepis coatsi Dollo, Oneirodes notius Pietsch.
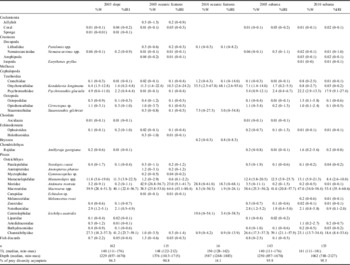
Comparison of the percentage by weight (%W) and percentage by Index of Relative Importance (%IRI) of prey items in the diet of adult Dissostichus mawsoni sampled from oceanic features and the continental slope in the western Ross Sea during 2003 and 2010. The subarea of the continental slope lies between 174°E–176°W and 70–73.5°S. The 95% confidence intervals estimated by bootstrap resampling are given in brackets.

n = number of stomachs containing food, TL = fish total length.
Species authorities: Eurythenes gryllus (Lichtenstein), Kondakovia longimana Filippova, Psychroteuthis glacialis Thiele, Stauroteuthis gilchristi (Robson), Amblyraja georgiana (Norman), Notolepis coatsi Dollo, Anotopterus pharao Zugmayer, Antimora rostrata (Günther), Melanocetus rossi Balushkin & Fedorov, Icichthys australis Haedrich.
Comparison of adult diet on continental slope and oceanic features
On the continental slope, icefish (mainly C. dewitti) and Macrourus spp. (Macrourus whitsoni and Macrourus caml McMillan, Iwamoto, Stewart & Smith) were the main prey (Table II). Icefish were smaller but more numerous prey. Eel cods (mainly Muraenolepis evseenkoi Balushkin & Prirodina) were the third most important fish prey. Cephalopods were found in c. 20% of stomachs and, although relatively large prey, they were often incomplete or in advanced stages of digestion. The most important cephalopod prey were squids, particularly P. glacialis and K. longimana. The remaining prey species were a variety of small, mainly benthic fish, e.g. Trematomus spp., eelpouts (Zoarcidae), dragonfish and small invertebrates (prawns). A number of prey types were only found in toothfish taken from the continental slope (e.g. Trematomus spp., eelpouts, dragonfish), while violet cod (Antimora rostrata (Günther)) and K. longimana were rare in stomachs from the continental slope.
On oceanic features, Macrourus spp. were the dominant prey (Table II). Large violet cod (Antimora rostrata) were also important prey. The large onychoteuthid squid K. longimana was relatively common, but was usually well digested or incomplete, thus contributed less to prey weight. The remaining prey species were a variety of mainly pelagic fishes (e.g. daggertooths (Anotopterus vorax (Regan)), barracudinas (Notolepis coatsi Dollo) and myctophids) and jellyfish. Prey that was only found in samples from oceanic features included jellyfish, daggertooths, Paralomis sp. and Stauroteuthis gilchristi (Robson), while icefish and eel cods were rare.
Variability in adult diet composition on the continental slope
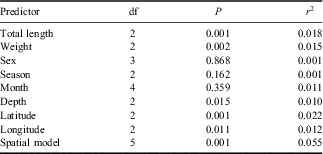
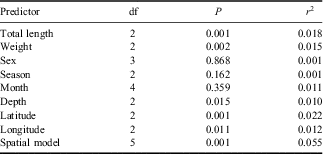
In the conditional DistLM tests of diet variability amongst adult toothfish from the subarea of the continental slope, there were significant relationships between diet composition and all predictors except sex, month and season, with the spatial model explaining the most deviance (Table III). The spatial model consisted of the terms x + x2 + xy + xy2. The overall model explained 14.1% of the variability in diet. Because the spatial model was the best predictor of spatial variability, the individual latitude and longitude effects were not considered further. Fish TL was preferred over weight because the former explained more deviance. Therefore, diet variability was characterized in terms of TL, depth and the spatial model.
Results of the DistLM analysis conditional tests using the subset from the continental slope, adults only, all stomachs containing prey (n = 275).
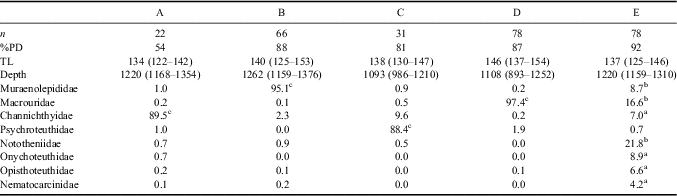
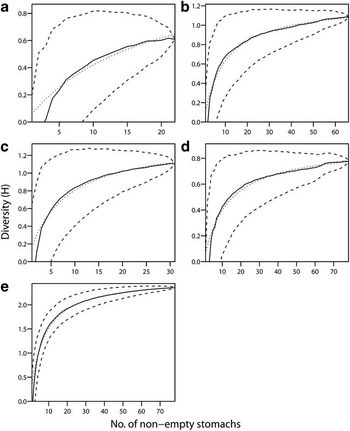
Five sub-groups of toothfish samples with similar diets were identified from cluster analysis. The number of samples in each group was sufficient to explain 81–92% of the estimated asymptotic prey diversity (%PD) in groups B–E, thus provided a near-complete estimate of diet in each group (Table IV). The cumulative diversity curve for group A was visually approaching an asymptote and was similar in shape to groups B–E. However, the relatively low %PD (54%) was considered unreliable because it was estimated from a poor fit of the asymptotic model to the data (Fig. 3).
Mean of standardized percent prey weight within groups A–E using the subset from the continental slope, adults only, all stomachs containing prey (n = 275). Prey types shown are those which together contributed at least 95% of the SIMPER within group similarity for one or more groups.

The SIMPER percentage contribution to within group similarity: a1–10%, b10–50%, c>50%, no superscript = not identified by SIMPER as characteristic for that group.
n = sample size, %PD = sample total prey diversity as a percentage of the estimated asymptotic prey diversity, TL = mean total length in cm (interquartile range), depth = mean (interquartile range).
a.–e. The mean cumulative diversity of prey categories for subgroups A–E (measured using the Brillouin index of diversity, H). Dashed lines indicate the 95% credible intervals. Dotted lines indicate the fitted curve from which asymptotic diversity was estimated.

There was substantial overlap in spatial, depth and TL distributions between the groups, but also some subtle differences. The mean TL in group D was significantly larger than all other groups (t-tests, P ≤0.01), with no significant difference between groups A, B, C and E (t-tests, P ≥0.08) (Table IV). The mean depths in groups A, B and E were significantly deeper than groups C and D (t-tests, P ≤0.05), and were not significantly different from each other (t-tests, P ≥0.10). The depths of groups C and D were not significantly different from each other (t-test, P ≥0.34) (Table IV).
The diet of the groups from shallower water was characterized by Psychroteuthidae (P. glacialis), predominantly in the north-west region of Iselin Bank (group C), or by Macrouridae (Macrourus caml and Macrourus whitsoni) in virtually all samples taken from the south-east flank of Iselin Bank and in the largest fish throughout the region (group D). The diet of deeper water groups was characterized by Channichthyidae (group A), Muraenolepididae (group B) and a variety of other species (group E) throughout the region. Groups B and E accounted for virtually all samples taken from an area of deeper water to the north of Mawson Bank.
Discussion
The diet of sub-adult toothfish was broadly similar to that of adult toothfish in the Ross Sea continental slope region, comprising mainly benthic fishes and cephalopods. Not surprisingly, sub-adult toothfish ate a greater variety of smaller prey than adults, including smaller fishes (such as Trematomus spp. and Bathydraco spp.) and prawns (Nematocarcinus sp.). Larger toothfish ate a greater proportion of large demersal fishes such as grenadiers (Macrourus spp.).
Grenadiers were the most important fish and overall prey species. The grenadiers were often well digested and could usually only be identified as Macrourus spp. A few grenadiers were taken from toothfish captured north of 65°S where Macrourus holotrachys Günther occurs in small numbers (Marriott et al. Reference Marriott, Horn and McMillan2003), but most Macrourus prey were probably Macrourus whitsoni or Macrourus caml. The new cryptic species Macrourus caml has only recently been identified (McMillan et al. Reference McMillan, Iwamoto, Stewart and Smith2012), hence, we did not distinguish between species of Macrourus in the present study. Macrourus whitsoni and Macrourus caml appear to occupy similar depths and be sympatric through the Ross Sea region (Pinkerton et al. Reference Pinkerton, Forman, Stevens, Bury and Brown2012). Further research is needed to determine the relative proportion of Macrourus whitsoni and Macrourus caml consumed by toothfish in the Ross Sea region.
Glacial squid (P. glacialis) were the most important cephalopod prey and were particularly important in toothfish sampled from the north-west region of the Iselin Bank. Although most P. glacialis were incomplete, their lower beaks were generally fully chitinized indicating that they were mature adults. Based on lower rostral length measurements, and using the regression of Gröger et al. (Reference Gröger, Piatkowski and Heinemann2000), the P. glacialis eaten by toothfish in this study would have had estimated mantle lengths (ML) of 19–46 cm (mean = 33.4 cm, n = 117) (Stevens, unpublished data). Lu & Williams (Reference Lu and Williams1994) suggested that P. glacialis undergo an ontogenetic descent with larger individuals occurring at greater depth. Their largest specimens were 9.5–20.1 cm ML and were captured in 430–530 m depths. The P. glacialis taken from toothfish stomachs in this study were generally much larger than any examined by Lu & Williams (Reference Lu and Williams1994) and support an ontogenetic descent with adult P. glacialis occurring at much greater depths. The relative importance in the toothfish diet in the north-west region of the Iselin Bank suggest that adult P. glacialis may be aggregated in this region.
The large onychoteuthid K. longimana was the most abundant cephalopod prey on oceanic features. Most K. longimana were incomplete, comprising mainly brachial crowns, occasionally with mantle remnants attached. The beaks varied in the level of chitinization indicating that they were from both immature and mature individuals.
Other cephalopods identified from toothfish stomachs in the Ross Sea region (this study and Stevens, unpublished data) were the squids Alluroteuthis antarcticus Odhner, Bathyteuthis abyssicola Hoyle, Filippovia knipovitchi (Filippova), Galiteuthis glacialis Chun and Mesonychoteuthis hamiltoni, the incirrate octopi Benthoctopus sp., Megaleledone setebos (Robson), Pareledone aequipapillae Robson, Pareledone turqueti (Joubin) and Thaumeledone sp., and the cirrate octopi Cirrata sp. A (Cherel), Cirrata sp. B, Cirroctopus sp. and Stauroteuthis gilchristi.
Our results support the assumption that D. mawsoni is a demersal species. Macrourus grenadiers and eel cods (Muraenolepis spp.) are important prey for D. mawsoni (this study, Fenaughty et al. Reference Fenaughty, Stevens and Hanchet2003, Kokorin Reference Kokorin2010, Roberts et al. Reference Roberts, Xavier and Agnew2011) and are regarded as benthopelagic in habit (Gon & Heemstra Reference Gon and Heemstra1990). Preliminary data for Macrourus grenadiers from the Ross Sea supports this assumption with benthic and pelagic components to their diet (Pinkerton et al. Reference Pinkerton, Forman, Stevens, Bury and Brown2012). The icefish C. dewitti is regarded as a benthic species, having extensive thickening of the skin on the distal end of the pelvic fins used for resting on the substrate (Kock Reference Kock2005). However, preliminary diet data supports a benthopelagic habit with mesopelagic prey, such as Gymnoscopelus spp. and euphausiids, important (Takahashi & Iwami Reference Takahashi and Iwami1997, Sutton et al. Reference Sutton, Manning, Stevens and Marriott2008, Forman, unpublished data). Therefore, the three key toothfish prey species appear to feed on benthopelagic prey. Large adult P. glacialis were also important prey and they are probably also abundant near the bottom as Gröger et al. (Reference Gröger, Piatkowski and Heinemann2000) reported specimens of P. glacialis larger than 100 mm ML have only been captured in big bottom and benthopelagic trawls.
The diet of D. mawsoni in the Ross Sea region varies between the continental shelf, slope and oceanic features, probably reflecting latitudinal differences in habitat and species assemblages. In McMurdo Sound, under shore fast ice and heavy pack ice, D. mawsoni feeds mainly on fish, in particular Pleuragramma antarctica (Calhaem & Christoffel Reference Calhaem and Christoffel1969, Eastman Reference Eastman1985a, Reference Eastman1985b). Preliminary data from the wider Ross Sea continental shelf suggests a more varied diet including small notothens and icefish (unpublished data). In deeper waters, largely over the continental slope, icefish, Macrourus grenadiers and eel cods comprise most of the diet (Fenaughty et al. Reference Fenaughty, Stevens and Hanchet2003, Kokorin Reference Kokorin2010, this study). In open oceanic waters, squid may dominate the diet (Yukhov, Reference Yukhov1971).
We found substantial differences in toothfish diet in the offshore oceanic features versus continental slope habitats, although grenadiers were important in the diet in both regions. On the continental slope, the wide variety of benthic fish prey, and the presence of stones, ophiuroids and small coral fragments (probably accidentally ingested), indicate benthic foraging. On oceanic features, the prey included Antimora rostrata, cephalopods and the occasional mesopelagic to epipelagic fish and jellyfish. These differences probably reflect changes in assemblage of potential prey between the continental slope and oceanic features. It has been suggested that seamount habitats provide an enhanced horizontal flux of mesopelagic prey and extended contact with the mesopelagic layers. Seamounts are also favourable habitat for fishes because the seabed is closer and more rugged, thus provide refuges in which to rest or escape from predators (Morato & Clark Reference Morato and Clark2007).
Toothfish may obtain a substantial component of their diet from scavenging. Fenaughty et al. (Reference Fenaughty, Stevens and Hanchet2003) and Roberts et al. (Reference Roberts, Xavier and Agnew2011) reported penguin remains from toothfish stomachs captured in the Ross Sea and South Sandwich Islands while Petrov & Tatarnikov (Reference Petrov and Tatarnikov2011) reported seal and ‘flying bird’ remains from the Lazarev Sea. Roberts et al. (Reference Roberts, Xavier and Agnew2011) also reported that many of the K. longimana beaks had probably come from individuals > 10 kg in total mass and were ‘either torn from living animals or scavenged from the seafloor’. We agree that squid remnants found in toothfish stomachs from large cephalopod species, such as K. longimana and Mesonychoteuthis hamiltoni (misidentified as Octopoteuthis rugosa Clarke in Fenaughty et al. Reference Fenaughty, Stevens and Hanchet2003), have probably been scavenged, possibly as discards from marine mammal feeding or spent adults. Conversely, octopus remains in toothfish stomachs were often intact, which is consistent with direct predation given that most Antarctic octopi are small enough to be eaten whole. In this study, we also found evidence for toothfish scavenging bait and depredation of captured fish from the longline. For example, one toothfish stomach contained six fresh C. dewitti, one of which had a hook, bait and snood in its mouth, two others had broken lower jaws (presumably where a hook had been ripped out of the mouth) and another was partially eaten internally by lysianassid amphipods (Orchomenella sp.) therefore was probably dead prior to ingestion. Furthermore, a small number of stomachs contained pilchard remains (Sardinops sp., Clupeidae) which were not used as bait by the vessels in this study indicating scavenging along longlines from other vessels in the fishery. Fishing discards (a pectoral fin, two caudal fins, intestines and male gonad from large nototheniids) were also recovered from five toothfish stomachs.
The aim of the analysis of diet variability of adult toothfish from within a relatively well-sampled area of the continental slope was to look for small-scale patterns in diet composition. Furthermore, to determine whether diet sampling for toothfish from the commercial fishery could be used to monitor ecosystem change in the Ross Sea region, pursuant to CCAMLR Article II, which commits managers to maintain the ecological relationships between species. One important set of interconnections in the ecosystem of the Ross Sea slope is the predator-prey (trophic) linkage between toothfish and benthopelagic fish prey, especially grenadiers, icefish and eel cods. Ecosystem modelling of the Ross Sea shelf and slope has suggested that large toothfish are the main predator of large fishes such as grenadiers and icefish, and consequently the toothfish fishery could lead to trophic cascades (Pinkerton et al. Reference Pinkerton, Bradford-Grieve and Hanchet2010). As fishing has been most intense on the continental slope near the Mawson and Iselin banks, any change in trophic interconnections due to fishing may first occur in this region. Consequently, in 2010 the sampling of toothfish stomachs was focussed on an area including the northern parts of the Mawson and Iselin banks (70°–73°S, 175°E–175°W). The majority of our toothfish stomach samples were from this area and within the subset analysed for diet variability.
The proportion of variance in diet composition explained by environmental and sampling factors was significant, although relatively small. Variability in the diet within the region will make it difficult to use fishery-based opportunist collection of toothfish diet samples as convincing temporal indicators of ecosystem status. To use toothfish diet as an ecosystem indicator will require a move away from opportunistic sampling, or at least enough opportunistic samples would need to be collected in order that a controlled subset of samples could be taken afterwards for analysis. Location and fish size had a significant influence on diet variability, but temporal factors did not, meaning that there was no change in diet between 2003 and 2010. In 2012, the spawning stock biomass of the Ross Sea toothfish stock was estimated to be 80% of the unfished level (Mormede et al. Reference Mormede, Dunn and Hanchet2011). The current catch limit for toothfish in the Ross Sea region is anticipated to lead to a long-term biomass of the spawning stock of 50% of the unfished value, consistent with CCAMLR management. Given the relatively low current level of toothfish stock depletion, and the lack of temporal change, the present study may be considered to be a ‘baseline’ against which to monitor for change in toothfish diet in the future.
Acknowledgements
This work was funded by New Zealand MBIE project C01×1001 (Protecting Ross Sea Ecosystems). We thank the scientific observers: Gerald Anderson, Jerry Buirski, Donovan Cole, Brent Fairhead, Rick Guild, Stacey Mulgrew, Howard Reid, Stephen Smith and Francois Stoffberg; and Sanford Ltd science advisor and company liaison, Jack Fenaughty, who collected the stomachs used in this study. Andrew Stewart and Peter McMillan helped with the identification of fish prey, while Martin Collins, Paul Rodhouse, Jose Xavier and Yves Cherel helped with the identification of cephalopod prey. Natant decapods and king crabs were identified by Rick Webber and Eliot Dawson. Amphipods and isopods were identified by Niel Bruce. Peter Shearer assisted with stomach examination and digital photography. Anna Kilimnik helped with Russian translation. Brent Wood and Erika Mackay produced Fig. 1. Ben Sharp, Colin Sutton and the New Zealand Antarctic Fisheries Working Group provided useful comments on an earlier draft. We would also like to thank the reviewers for their comments.