


1. Introduction
The most important measures against potential avalanches for backcountry users to take into consideration are the evaluation of snowpack instability (which is the determination of the possibility of avalanche occurrence based on the current snowpack condition; Reference McClung and SchaererMcClung and Schaerer, 2006) and the ability to determine a course of action based on such an evaluation.
However, many questions remain unanswered regarding the fracture processes within snowpacks that turn into avalanches (Reference SchweizerSchweizer, 1999) and it is difficult to physically evaluate the instability of a snowpack, even by using on-site observations. For a statistical approach, the monitoring of snowpacks and avalanches is necessary. However, instability also varies within time and space, and to obtain high-resolution temporal and spatial monitoring of snowpacks and avalanches is not easy. In practice, an evaluation of snowpack instability involves collecting data related to meteorology, snowpack structure and snowpack mechanics (Reference LaChapelleLaChapelle, 1980) and the analysis and integration of temporally and spatially incomplete information using experience-based knowledge, knowledge of the terrain and knowledge related to the physics of snow (Reference McClungMcClung, 2002). For this reason, the evaluation of snowpack instability is often likened to fitting limited puzzle pieces together to form a larger image (of a snowpack in the mountains) (Reference Fesler, Fredston and TremperFesler and others, 1995). In addition, Reference WilliamsWilliams (1980) points out the importance of having knowledge of the climate representing an average year for the region. This is because snowpack characteristics are determined by the local climate, which in turn affects the occurrence of avalanches. Knowledge of local snowpack characteristics gained through an understanding of the climate is similar to assembling the completed image of a picture puzzle. In reality, however, snowpacks in the mountains do not always mirror the completed image and such images are often corrected using current collected data. The process of constructing a whole image from incomplete data involves both universal and locally variable parts. The universal part is represented by knowledge of the physical properties and topography, while the variable part is an understanding of the local attributes of snowpacks, of which the characteristics vary from one mountain range to another.
Studies on the regional characteristics of snowpacks related to avalanches began in North America in the 1940s (Reference RochRoch, 1949). Such studies developed into snow avalanche climatology for North America (Reference LaChapelleLaChapelle, 1966; Reference Armstrong and ArmstrongArmstrong and Armstrong, 1987; Reference Mock and BirkelandMock and Birkeland, 2000; Reference Haegeli and McClungHaegeli and McClung, 2003), which continues to be studied beyond North America today (e.g. Reference Sharma and GanjuSharma and Ganju, 2000; Reference Laternser and SchneebeliLaternser and Schneebeli, 2002). Studies in Japan on the regional characteristics of snowpacks focusing on snow-grain type include those of Reference Akitaya and EndoAkitaya and Endo (1979), Reference Kawashima and Yamada Tand WakahamaKawashima and others (1994) and Reference IshizakaIshizaka (1998). However, these studies are limited to the plains and are not related to avalanches. Furthermore, many studies on snowpacks in mountain ranges are also limited to water resources, snowfall characteristics, atmospheric environment and climate change and do not deal with measures to be taken against avalanches (Reference OgasawaraOgasawara, 1964; Reference Nakagawa, Kawada, Okabe, Shimizu and AkitayaNakagawa and others, 1976, Reference Kawata, Satake, Iida and ShinodaKawata and others, 2000). Reference Ikeda, Wakabayashi, Izumi and KawashimaIkeda and others (2009) compared the snowpack characteristics in the central mountains in Japan with the snow and avalanche climate classification in North America (Reference LaChapelleLaChapelle, 1966; Reference Armstrong and ArmstrongArmstrong and Armstrong, 1987; Reference Mock and BirkelandMock and Birkeland, 2000; Reference McClung and SchaererMcClung and Schaerer, 2006). They found that the mountain ranges on the Sea of Japan side resemble regions with a coastal climate, while the mountain ranges on the Pacific side resemble regions with a continental climate but, in comparison with similar areas in North America, these areas are strongly affected by rainfall. However, the study was based on observations at only two sites. Further understanding of the regional characteristics of snowpacks requires more prolific observations.
Reference Armstrong and ArmstrongArmstrong and Armstrong (1987) and Reference Mock and BirkelandMock and Birkeland (2000) have attempted to grasp snowpack characteristics from meteorological data by relating the regional characteristics of the snowpack to meteorological factors. However, these studies do not take into direct consideration the properties of snowpacks and merely set the threshold values for meteorological factors to fit the snow and avalanche climatic classification already developed in North America. Such studies have been criticized for their inapplicability to other regions, such as to the central mountains of Japan (Reference Ikeda, Wakabayashi, Izumi and KawashimaIkeda and others, 2009).
Therefore, this study has two purposes: (1) to identify the regional characteristics of mountain snowpacks related to avalanches in the central mountains of Japan; and (2) to suggest indicators to determine the snowpack characteristics of the region from meteorological data by examining the relationship between snowpack characteristics and meteorological elements. For these reasons, this study involved snow-pit and weather observations at six sites in the central mountains of Japan.
2. Sites and Methods
2.1. Study sites
The mountainous region selected as the study area is a major destination for recreation in Japan. Many people visit the area throughout the year for mountaineering, snowshoe hiking and downhill and backcountry skiing, and avalanche disasters occur frequently.
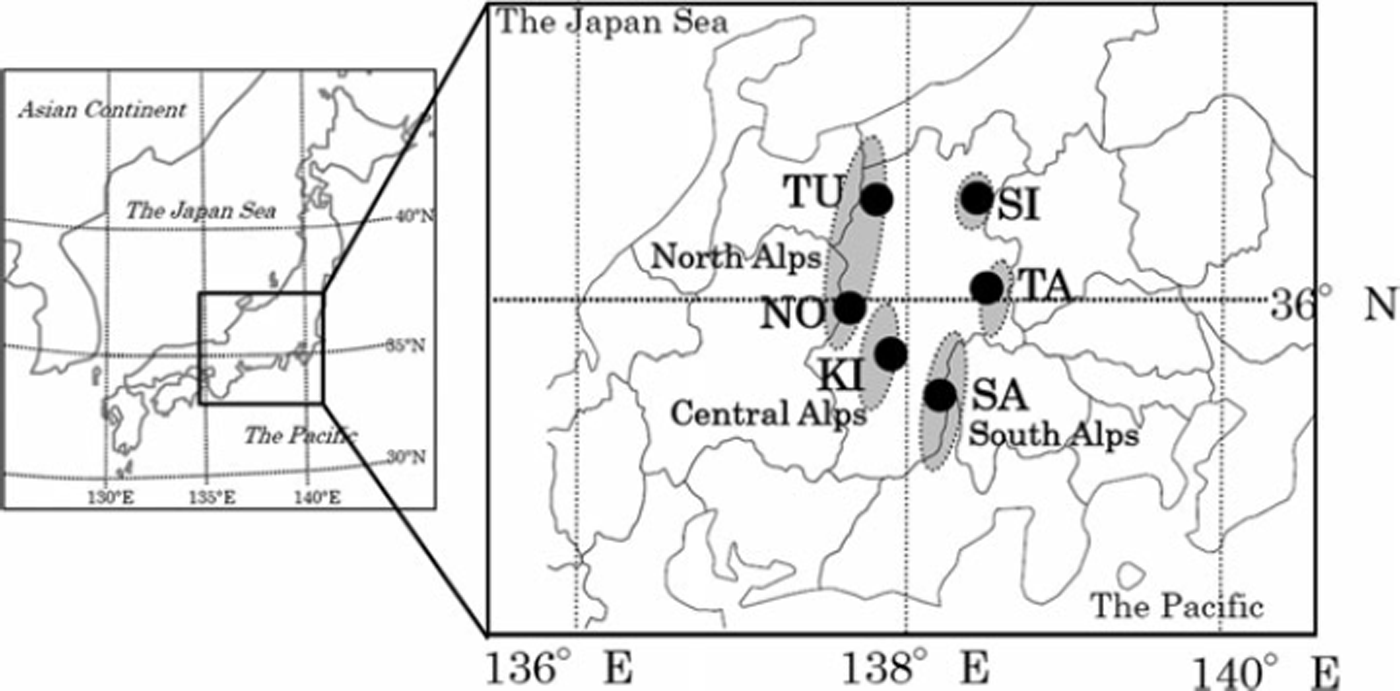
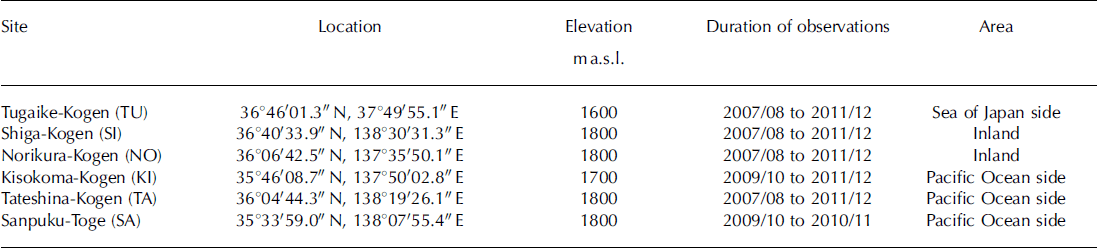
Table 1 and Figure 1 show the snow-pit observation sites and periods of observation. Observations were carried out over five winter seasons from 2007/08 to 2011/12 (December-May) at four sites: Tugaike-Kogen (TU), Shiga-Kogen (SI), Norikura-Kogen (NO) andTateshina-Kogen (TA). At two other sites, Kisokoma-Kogen (KI) and Sanpuku-Toge (SA), observations were only carried out over three (2009/10 to 2011/12) and two winter seasons (2009/10 to 2010/11), respectively.
The study area with the six study sites indicated by black circles and mountainous regions shown in grey.
Summary of study sites
Observations were made once every month. Mountaineers in this region are well aware that the amount of snowpack in the central mountains varies widely by region due to the distribution of winter atmospheric pressure, and the region is therefore divided into three areas: the Sea of Japan side, the inland area and the Pacific side (e.g. Reference IidaIida, 1970). For this reason, the observation sites were set so that these three mountain areas were covered. In order to determine the regional snowpack characteristics of each region, a flat area with an elevation lower than the treeline was selected as the site of observation for all three regions to avoid the drifting and accumulation of snow by the wind.
2.2. Observation methods
The snowpacks were dug down to the ground surface and the pit wall was observed based on the guidelines set by UNESCO in 2009 (Fierz and others, 2009). Items for observation included the following:
Snowpack layer structure (position and thickness).
Snow-grain type and diameter determined using a snow crystal screen (which has three sizes of 1, 2 and 3 mm grids with a hand loupe (10x)).
Hardness (per layer) measured by a hand test and a push gauge (Reference Takeuchi, Nohguchi, Kawashima and IzumiTakeuchi and others, 1998).
Snow temperature (every 10 cm) measured with a thermistor thermometer.
Density (per layer) measured with a 100 mL sampler.
Air temperature (every 1 hour) measured with a platinum sensor and data logger. The sensor was located at a height of 1.0–2.5 m above the snow surface. The height of the sensors was adjusted when snow-pit observations were carried out to maintain the height from the snow surface.
2.3. Characteristics of snowpack in relation to avalanches
Snowpack weakness, with respect to avalanche occurrence, can be divided into two types. The first type is a persistent weakness that exists for several weeks to several months and depends on the existence of depth hoar (DH) layers, near-surface faceted crystal (FCsf) layers, surface hoar (SH) layers and melt-freeze crust (MFcr) layers. The second type is a non-persistent weakness, which is typically resolved in a matter of days and is due to the existence of precipitation particles (PP) (Reference McClung and SchaererMcClung and Schaerer, 2006).
Because persistent weakness is known to have a strong relationship with avalanche accidents (Reference JamiesonJamieson, 1995) and non-persistent weakness cannot be identified by monthly observation because it disappears in a relatively short period of time, we decided to focus this study on persistent snowpack weakness.
FCsf, SH and MFcr layers are formed on the surface of snowpacks and are dependent on meteorological conditions such as temperature and radiation, with multiple layers forming within one winter season. This study focuses on the number of such layers within the entire snowpack. For example, the study aims to evaluate whether there is a correlation between an increased likelihood of further FCsf layer formation and the number of FCsf layers within the snowpack. It is known that weaknesses due to DH are caused by one (or a few) thick well-developed DH layer(s). The DH weaknesses are formed by an alteration of most of the snowpack into a weak DH (either during the snowpack’s early winter or throughout the formation of the entire snowpack over the entire winter period). The development of DH is therefore related to this weakness, rather than simply the number of DH layers, so the ratio of DH layers to all the layers within a snowpack, together with the strength of the entire snowpack, can be used as an indicator that a weakness caused by DH is being formed. This study thus uses two indicators: the ratio of snow-grain type to the entire snowpack and the average hardness of the entire snowpack as an indicator of strength.
The ratio of snow-grain type (%) is given as follows:

where t g (cm) is the sum of the thickness of each type of snow-grain layer and t a (cm) is the sum of the thickness of all types of snow-grain layer except the precipitation particles and decomposings.
Three variables are used to express these ratios of snow type: rounded grains (RG), which develop under low temperature gradient; DH (including faceted crystals (FC)), which develop under a high temperature gradient; and melt forms (MF), which develop under wet conditions.
3. Results and Discussion
3.1. Regional characteristics of snowpacks related to avalanches
Seasonal snowpacks show their characteristics most clearly in the coldest part of winter and change continuously in each season due to the process of melting, becoming simple melt-form layers in the spring. Results of observations reveal that the snowpacks at each site lose their regional characteristics after March by the process of melting. This study therefore focuses on data obtained in February.
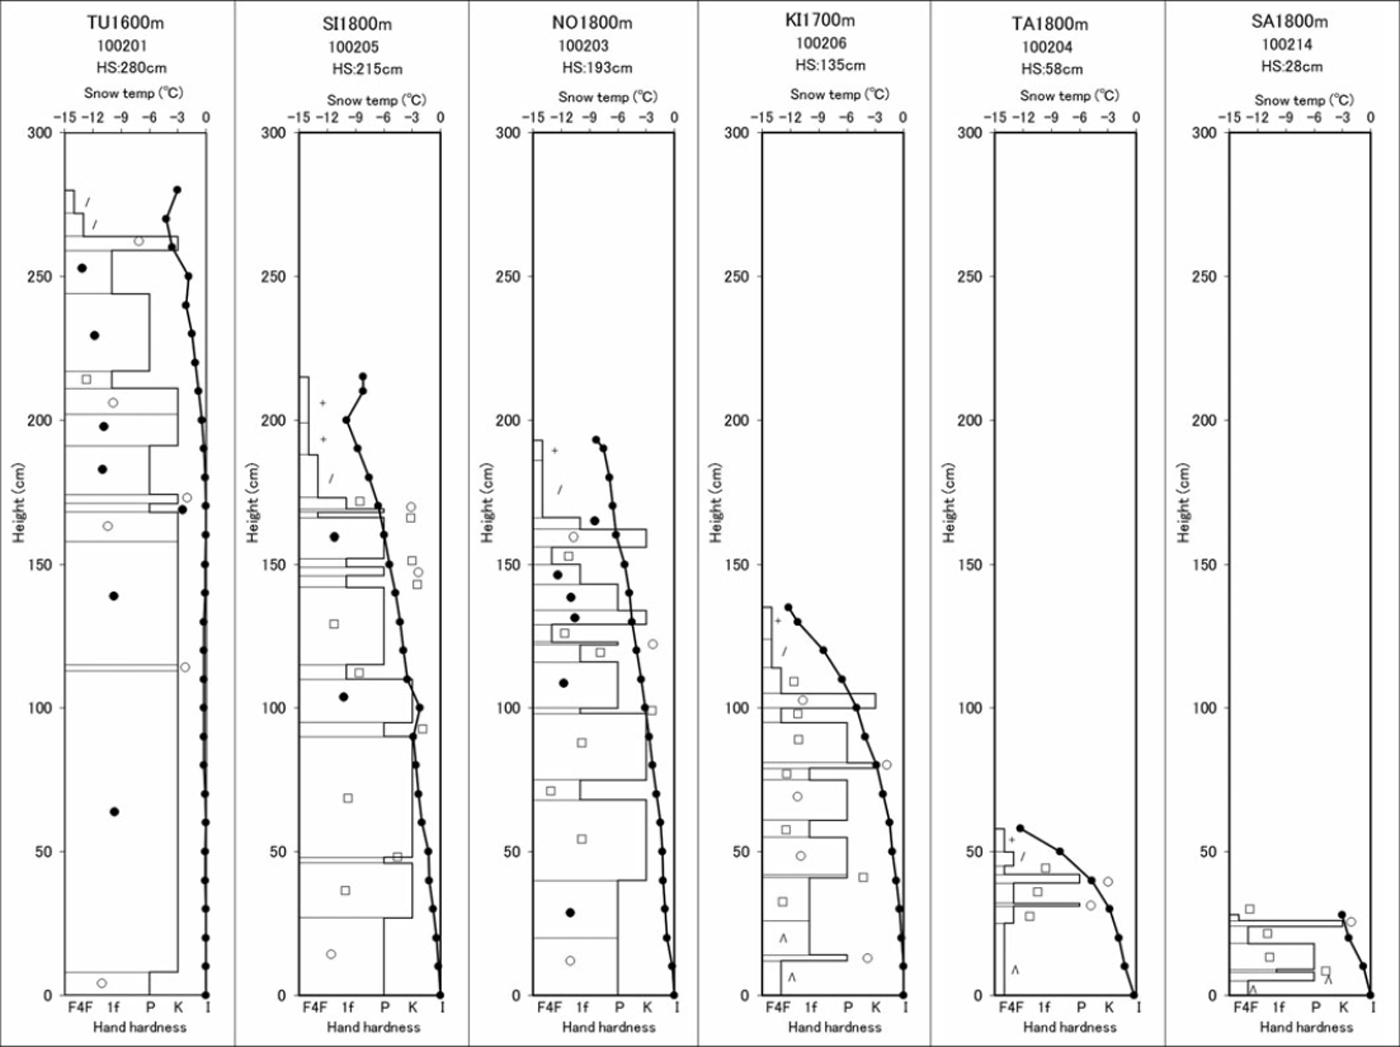
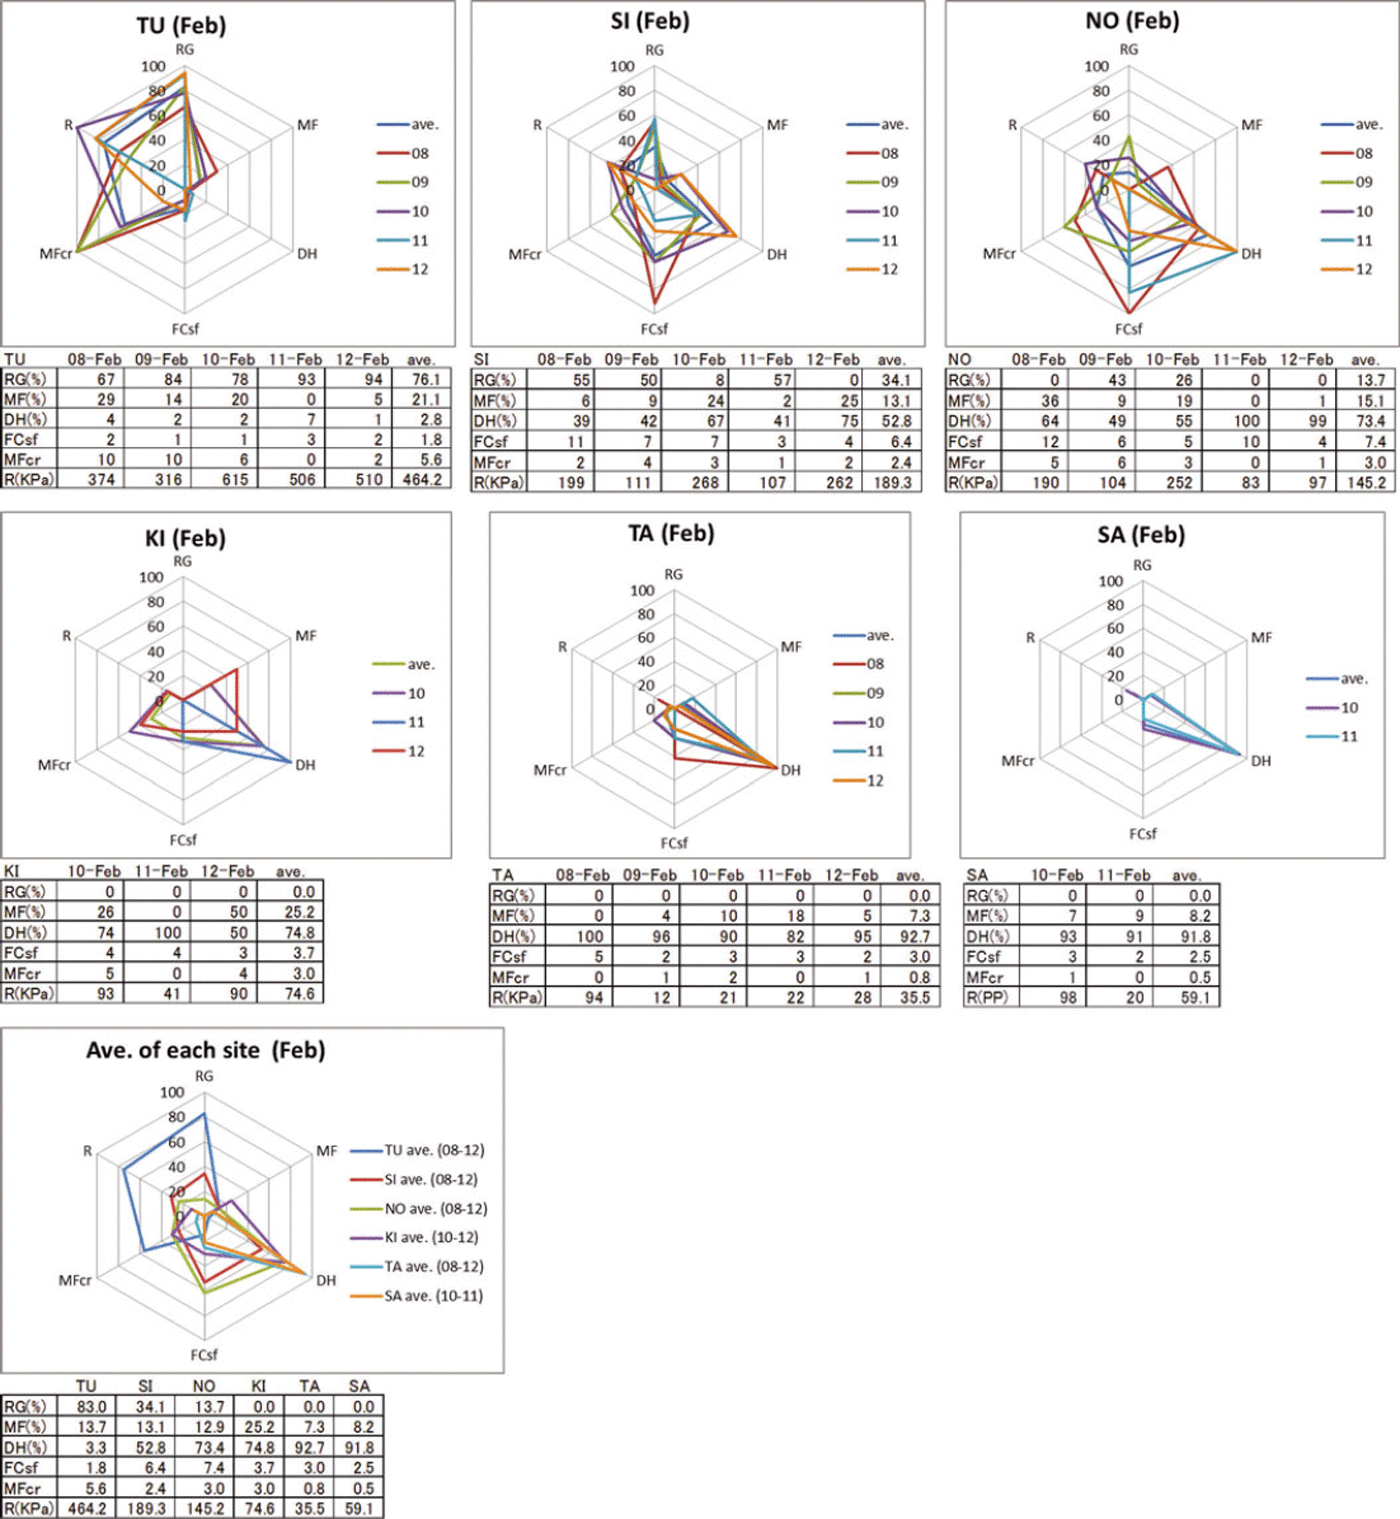
Figure 2 shows results recorded in February 2010. The depth of snow and the ratio of each snow layer vary greatly among the observation sites. In order to show the characteristics of the snowpacks, persistent weaknesses (as mentioned in Section 2.3) are summarized on a radar chart (Fig. 3) and below. The SH layer is not depicted in Figure 3 because it was not observed at any site. At times the SH layer was observed on the snow surface, but was never found within the snowpack.
Examples of snow-pit observation results (February 2010).
Regional characteristics of persistent weaknesses. RG: the ratio of the total thickness of RG layers to the total thickness (%); MF: the ratio of the total thickness of MF layers to the total thickness (%); DH: the ratio of the total thickness of DH (including FC) layers to the total thickness (%); FCsf: the number of FCsf layers; MFcr: the number of MFcr layers; R: the average hardness of total snowpack (kPa). In the radar charts, FCsf, MFcr and R are indicated by the ratio of each value to the maximum value observed at all the study sites.
3.1.1. Weakness caused by the DH layer
At TU, located on the Sea of Japan side of the mountain range, compacted snow was predominant, with high average snowpack hardness, and DH weakness was not confirmed across five observed seasons. However, three sites on the Pacific side – KI, TA and SA – havea predominantly weak DH and an average snowpack hardness of <100kPa, which is weak. However, in 2010 and 2012, the KI site had a higher ratio of MF and the same was found for the TA site in 2011. This is related to rainfall, as pointed out by Reference Ikeda, Wakabayashi, Izumi and KawashimaIkeda and others (2009), which is quite different from other places where similar studies have been conducted (e.g. in North America and Switzerland). For two inland mountain sites – SI and NO – the ratio of DH was lower on average than at the sites on the Pacific side, while the average snowpack hardness tended to be higher. However, in 2011 and 2012, NO had a similar DH ratio and average snowpack hardness to those on the Pacific side, suggesting the possibility that DH weaknesses may be more notable in some years at this site.
3.1.2. Weakness caused by FCsf, MFcr and SH layers
As a general tendency, MFcr is observed relatively more at TU, and FCsf is observed relatively more at SI and NO. MFcr and FCsf tend to be observed less frequently at KI, TA and SA. It was noted, however, that the number of these layers differed considerably from year to year. It is particularly interesting that SH is not observed at all, despite the layer being considered as the one displaying the most typical persistent weakness in North America and Switzerland (Reference LaChapelleLaChapelle, 1966; Reference Armstrong and ArmstrongArmstrong and Armstrong, 1987; Reference Haegeli and McClungHaegeli and McClung, 2003; Reference McClung and SchaererMcClung and Schaerer, 2006).
3.1.3. Comparisons with snow and avalanche climate in North America
Using a comparison of the snowpack characteristics discussed in Sections 3.1.1 and 3.1.2 with the snow and avalanche climate classification in North America (Reference LaChapelleLaChapelle, 1966; Reference Armstrong and ArmstrongArmstrong and Armstrong, 1987; Reference Mock and BirkelandMock and Birkeland, 2000; Reference McClung and SchaererMcClung and Schaerer, 2006), mountain ranges on the Sea of Japan side are classified as a ‘maritime snow climate’, the inland mountains as a ‘transitional snow climate’ and mountains on the Pacific Ocean side as a ‘continental snow climate’. However, it is notable that thick MF layers are often observed in some years on the Pacific Ocean side and that SH is not observed in any of the regions.
3.2. Examination of meteorological indicators of persistent weaknesses
This subsection discusses causes for the formation of regional snowpack characteristics as seen in Section 3.1 and evaluates the relationship with meteorological elements. The indicators for snowpack characteristics using meteorological elements are also examined. The snowpack characteristics are the persistent weakness caused by thick DH layers, FCsf layers and MFcr layers.
3.2.1 Weakness caused by the DH layer
Here we evaluate the persistent weakness caused by DH by consideration of the ratio of the total thickness of DH (including FC) layers to the total thickness (%) and the relationship between the average hardness of the total snowpack (kPa) and meteorological elements.
Temperature gradient is important for the formation of DH layers. As an example, an average temperature gradient is given as follows (Reference AkitayaAkitaya, 1974):

where TG is the average temperature gradient (°Cm−1), |T| is the absolute value of average air temperature (°C) and H is the average snow depth (m).
It is known that TG >10°C m−1 is a rule-of-thumb threshold for DH predominance (Reference McClung and SchaererMcClung and Schaerer, 2006). However, the DH ratio in the mountains on the Pacific Ocean side of the central part of Japan has a negative correlation with the amount of rainfall, because the DH ratio decreases as the DH becomes MF due to rainfall (Reference Ikeda, Wakabayashi, Izumi and KawashimaIkeda and others, 2009). Therefore, this study uses TG and the amount of rainfall (mm) as indicators of the DH ratio.
Figure 4 shows the relationship between the DH ratio and TG in February at each observation site per year. TG was calculated using the average air temperature from December to February divided by the average snowpack depth from December to February (the snow depth in early December was assumed to be 0m and the observations of snow depth at each snow pit were used for the snow depth in January and February). Figure 4 shows that the relationship between TG and the DH ratio is different above and below TG=10°C m−1. While there is a positive correlation between the DH ratio and TG when TG is <10°C m−1, no correlation is observed at 10°C m−1.
Relationship between DH ratio and TG.
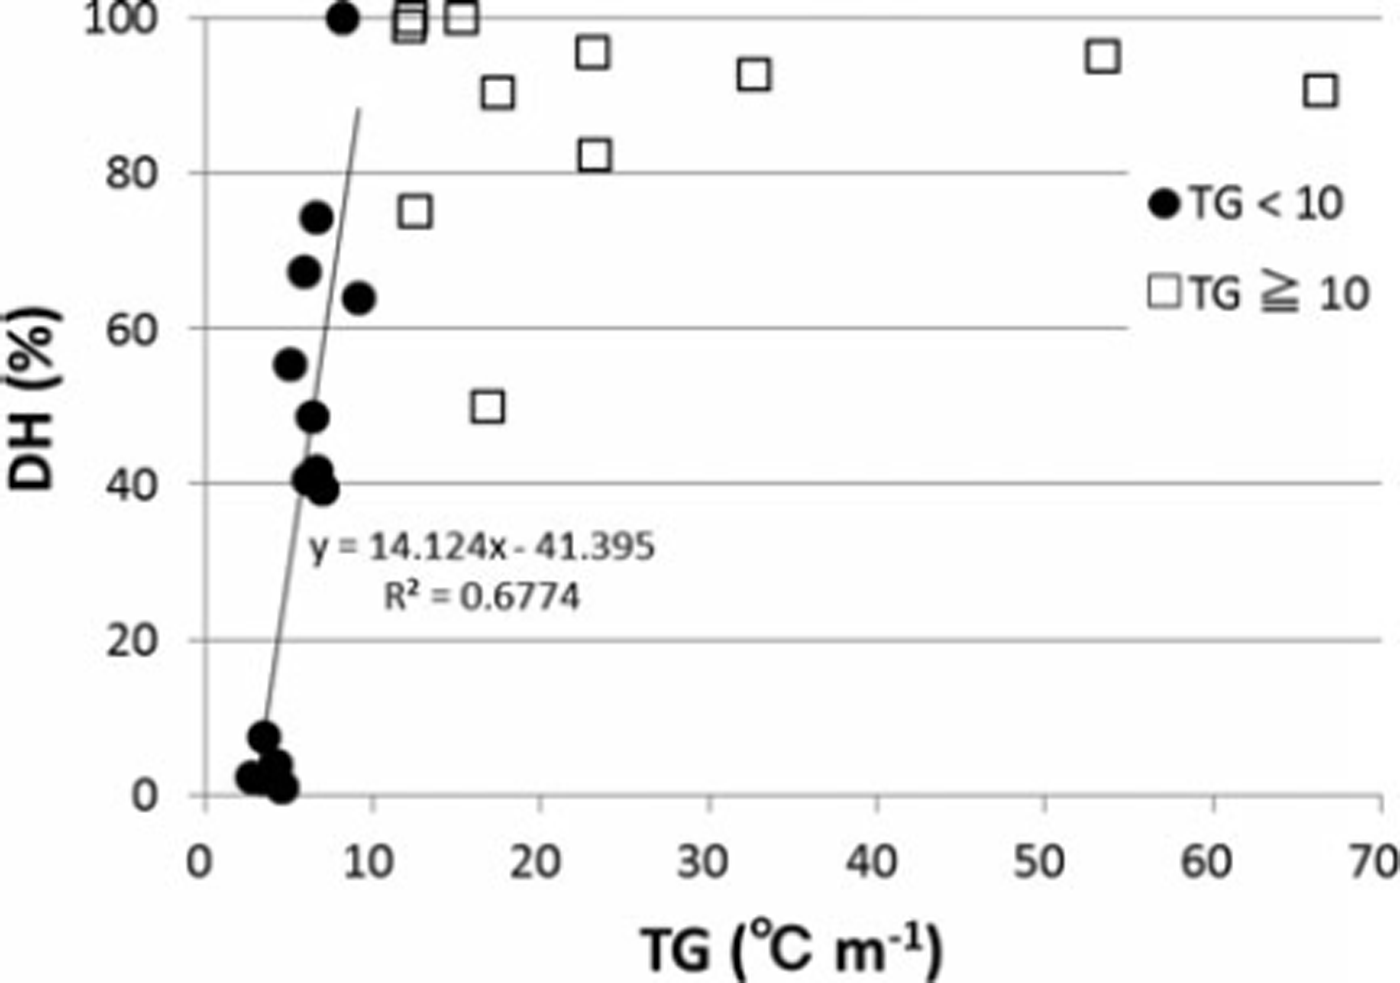
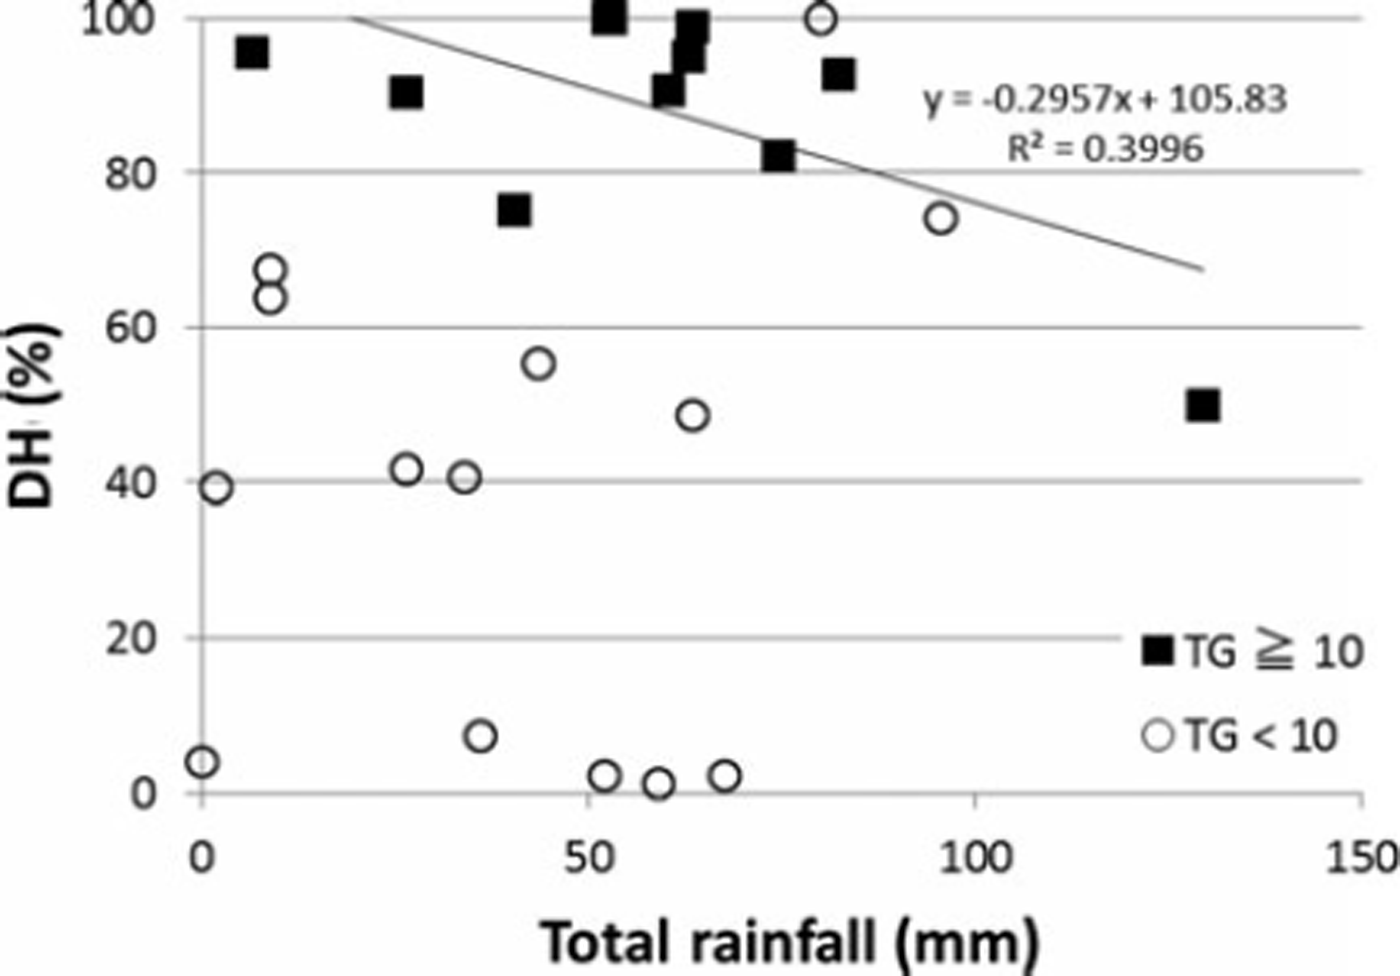
Figure 5 shows the relationship between the amount of rainfall and the DH ratio. The amount of rainfall was integrated from the hourly data collected by the Automated Meteorological Data Acquisition System (AMeDAS) station, operated by the Japan Meteorological Agency, located nearest to each of the observation sites for days when the temperature exceeded 0°C between December and February. All AMeDAS stations were within 5 km of the observation sites. Figure 5 also shows a negative correlation between the DH ratio and the amount of rainfall above TG=10°C m−1. As noted by Reference Ikeda, Wakabayashi, Izumi and KawashimaIkeda and others (2009), DH is formed in sufficient amounts when the TG is >10°C m−1, but the DH ratio decreases because the DH becomes MF due to rainfall. There is no correlation between the DH ratio and rainfall when TG is <10°C m−1 because in such a situation the snowpack depth is relatively deep and the value of the DH ratio against the entire snowpack does not change much despite the impact of rainfall.
Relationship between DH ratio and the amount of rainfall.
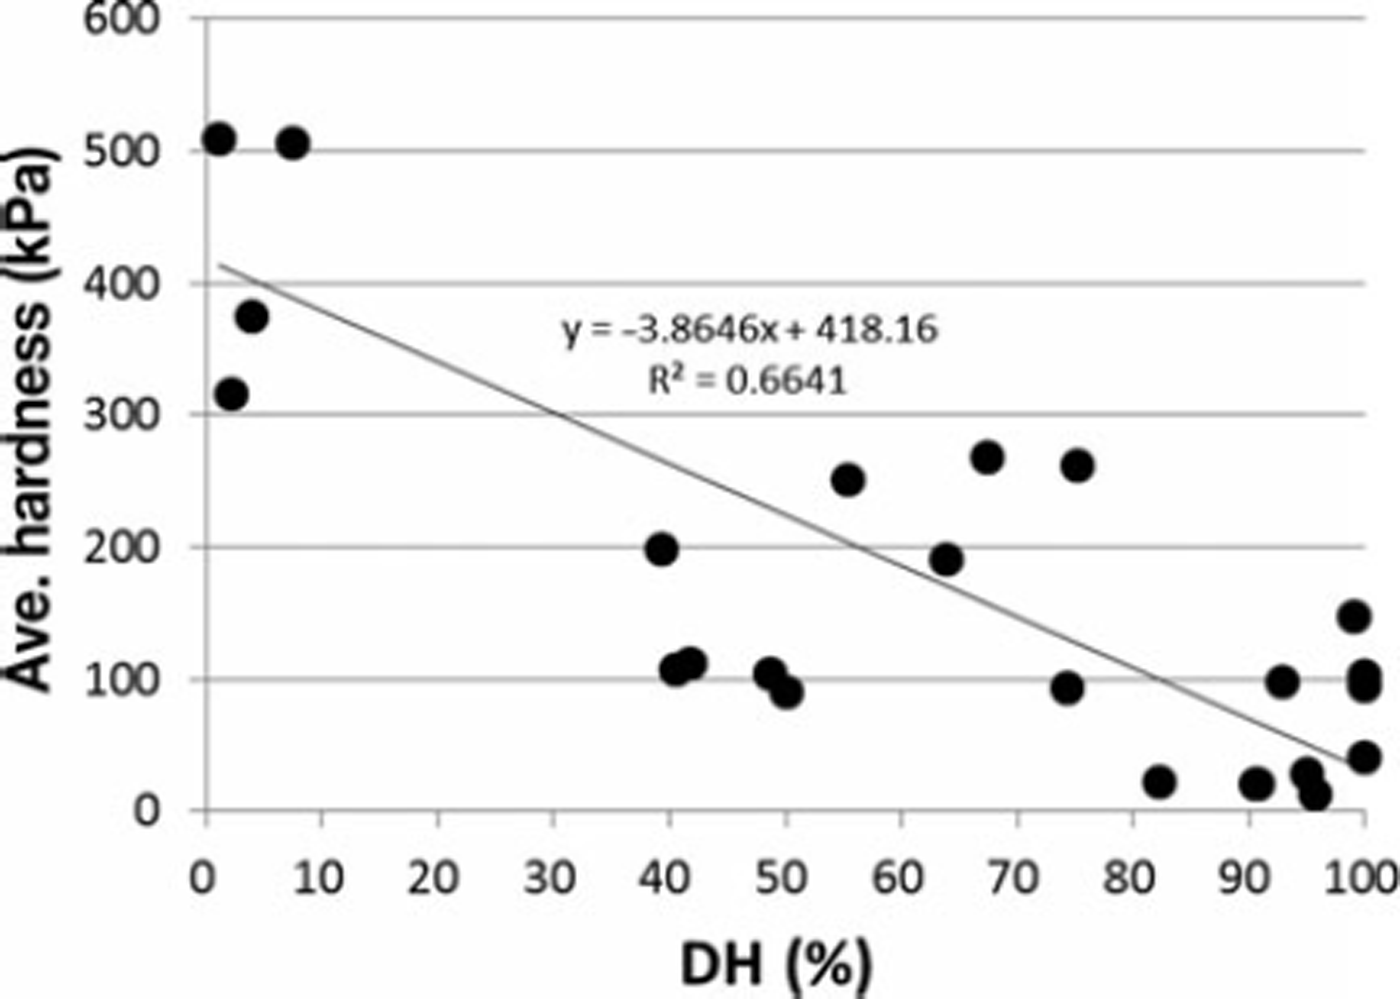
The average hardness of the snowpacks was then evaluated. Figure 3 shows that the DH rate is high in regions with a low average snowpack hardness. One of the possible causes considered is that in such regions the shallower snow depth diminishes the snow density and this diminishes the average snowpack hardness. Further, such a low-density snowpack promotes further faceting and enables a higher occupancy rate of weak DH layers. This decreases the average snowpack hardness and retains such a reduced hardness over a longer period. Figure 6 shows the negative correlation between the DH rate and the average snowpack hardness. As such, the DH rate is a useful indicator for estimating average snowpack hardness. As discussed earlier, the DH rate can be estimated from TG and the amount of rainfall. As an indicator of persistent weakness by DH, TG is useful for regions with TG< 10°Cm−1, while the amount of rainfall is the most useful indicator for regions with TG exceeding 10°Cm−1.
Relationship between average snowpack hardness and DH ratio.
3.2.2. Weakness caused by MFcr layers
An MFcr layer is formed when the snowpack surface refreezes after being melted by solar radiation, a rise in temperature or rainfall. For the formation of a number of MFcr layers, a new snowpack needs to accumulate on top of the existing MFcr layer, then melt and refreeze each time. If the MFcr layer remains on the surface due to a lack of new snow accumulation until the next surface melting, a new MFcr layer will not be formed and the number of MFcr layers will not increase. Therefore, an indicator is needed that can represent the frequency of melting on the surface with the frequency of snowfall. It is thought that there is a relationship between the melt-freeze frequency and the number of days that exceed 0°C, and the snowfall frequency and snowpack depth. Thus, we propose the MFcr index (daym) as an indicator of the number of MFcr layers:

where D0 (day) is the number of days on which the maximum air temperature exceeds 0°C from December to February and H feb (m) is the snow depth in February.
Figure 7 shows the relationship between the number of MFcr layers and the MFcr index annually at each observation site. The number of days on which the temperature is above 0°C is counted using the number of days on which the maximum air temperature at the observation site exceeded 0°C between December and February, with 00:00 as the starting time on each day.
Relationship between MFcr index and the number of MFcr layers.
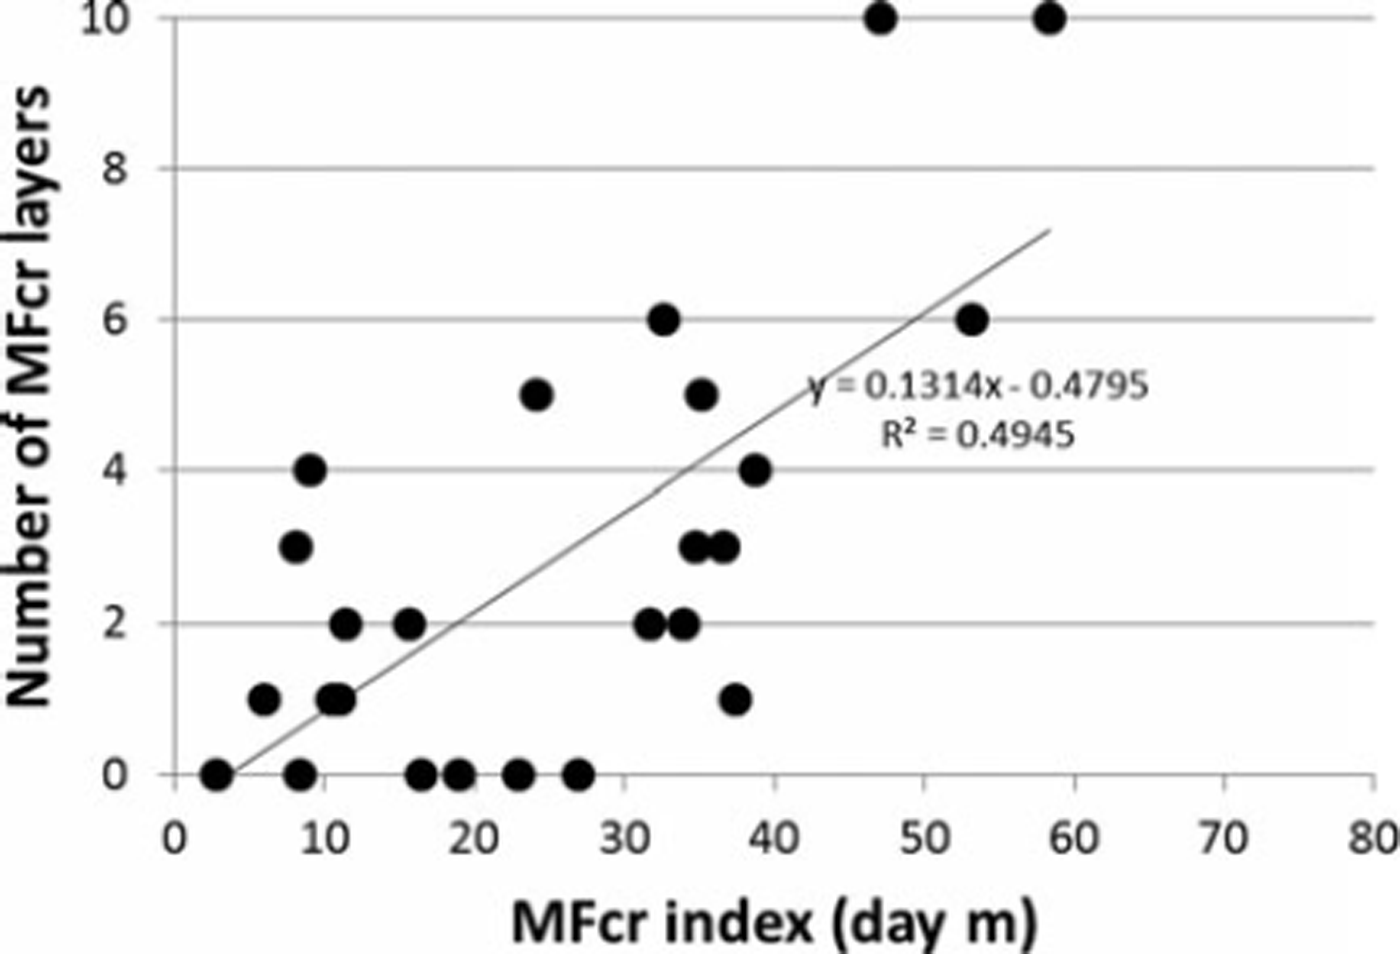
A measurement of snow depth was made from snow-pit observations in February. Figure 7 shows a positive correlation between the MFcr index and the number of MFcr layers. However the correlation is not very strong (R 2=0.4945), so this index is only a rough indicator of the tendency to form MFcr layers and not an accurate predictor of the number of MFcr layers.
3.2.3. Weakness caused by FCsf layers
An FCsf layer is formed when a strong temperature gradient is applied near the surface layer of the snowpack. There are three types of gradients: (1) a rapid decline of snow temperature by longwave radiation after the temperature has been raised by incoming shortwave radiation; (2) the accumulation of cold snowfall upon a melted snow surface; and (3) changes in the snow temperature near the surface layer from daytime to night-time (Reference BirkelandBirkeland, 1998). Therefore, it is necessary to acquire data on shortwave and longwave radiation together with snow temperature near the snowpack surface in order to make a precise estimation regarding the formation of an FCsf layer. Unfortunately, the opportunity to collect such data in mountain ranges is rare. As an alternative, we used the diurnal range of air temperature as an indicator of the likelihood of FCsf layer formation. This indicator is not precise, but we believe it can be used as a simple indicator for the formation of all three types of FCsf layer. In order for many FCsf layers to form as an MFcr layer, new snowfall needs to accumulate and form an FCsf layer on top of a pre-existing FCsf layer and the process then needs to be repeated. Thus, we propose the FCsf index (°Cm) as an indicator of the number of FCsf layers:

where T d(°C) is the average diurnal range of air temperature from December to February and H feb (m) is the snow depth in February.
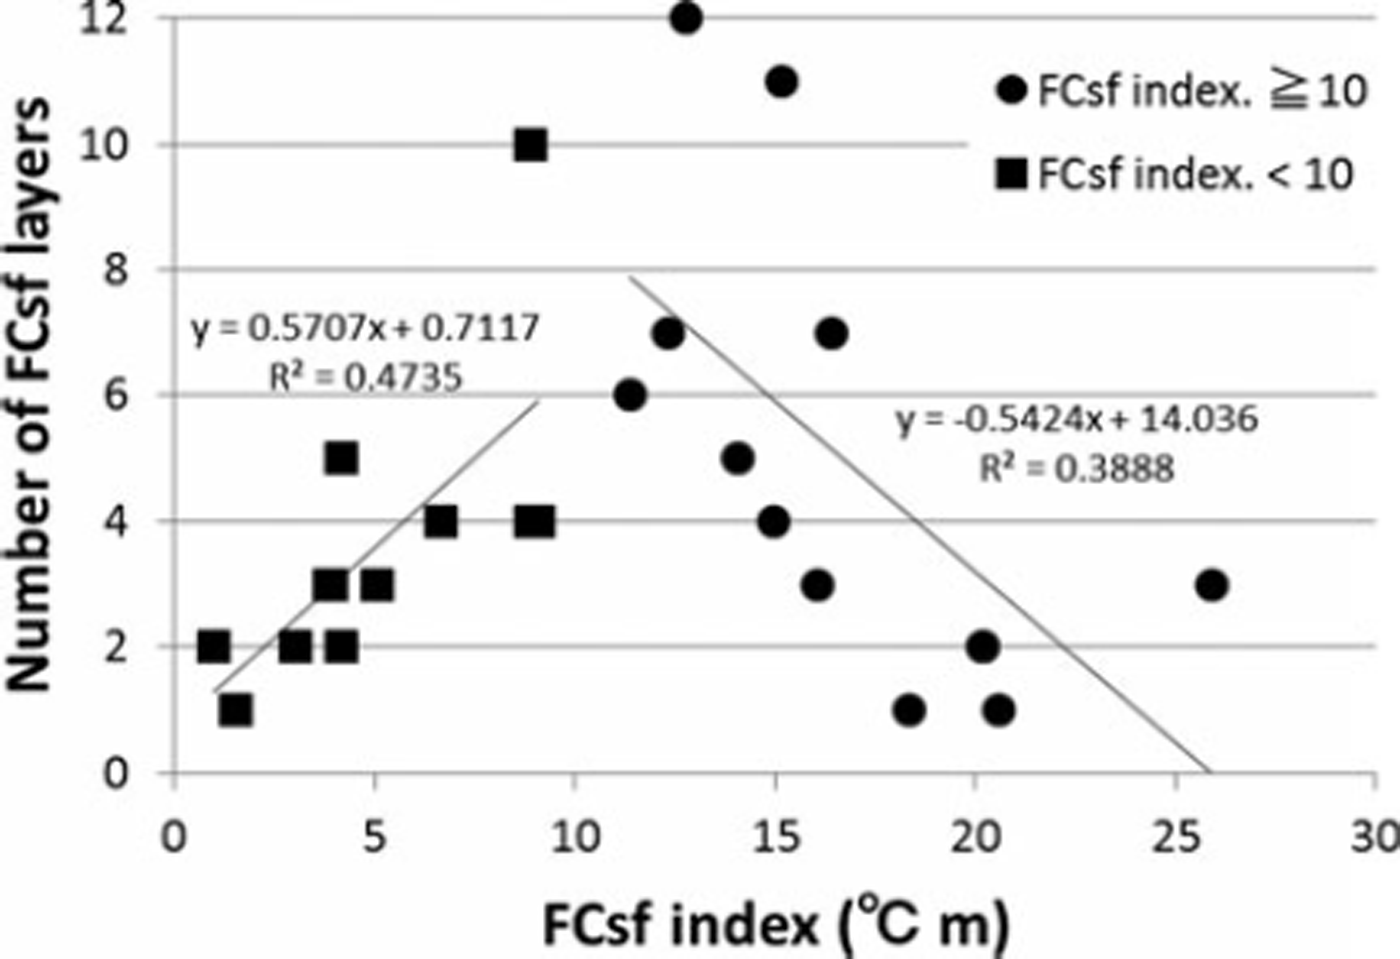
Figure 8 shows the relationship between the number of FCsf layers and the FCsf index recorded annually in February at each observation site. The average diurnal range of temperature is the average of the diurnal range based on the temperature data observed hourly from December to February at each observation site. Measurements from snow-pit observations in February were used as the snowpack depth. Figure 8 shows that the relationship between the FCsf index and the number of FCsf layers changes beyond FCsf index = 10°C m. For an FCsf index <10°C m, the number of FCsf layers and the FCsf index have a positive correlation, while the relationship has a negative correlation beyond FCsf index=10°Cm. We believe that in cases where the FCsf index is >10°Cm, the snowpack is too deep, i.e. the snowfall is too frequent. The formation of FCsf layers usually takes several days (Reference BirkelandBirkeland, 1998), so snowfall that occurs too frequently buries the snowpack surface with new snow accumulation before the FCsf layer is formed and therefore makes the formation of an FCsf layer unlikely. By drawing a boundary at 10°C m, it can be concluded that the FCsf index is useful as an indicator of FCsf layers. However, the correlation is not so strong (FCsf index <10°Cm: R2 = 0.4735; FCsf index >10°Cm: R2 = 0.3888), so this index is only a rough indicator of the tendency of FCsf layers to form, not an accurate predictor of the number of FCsf layers.
Relationship between FCsf index and the number of FCsf layers.
3.2.4. Values of indicators at study sites
Proposed indicators at each study site are shown in Table 2. In general, the values of the indicators vary each winter; however, the TG on the Pacific Ocean side of the mountainous region was characterized by a DH weakness usually exceeding 10°Cm−1, which is notably larger than in other regions. DH weakness is possibly affected by the amount of total rainfall the region receives, and in some winters this amount was large. In the inland mountain regions in some winters the TG exceeded 10°Cm−1, which suggests that the conditions there in some winters are close to those on the Pacific Ocean side.
Persistent weaknesses and indexes of study sites
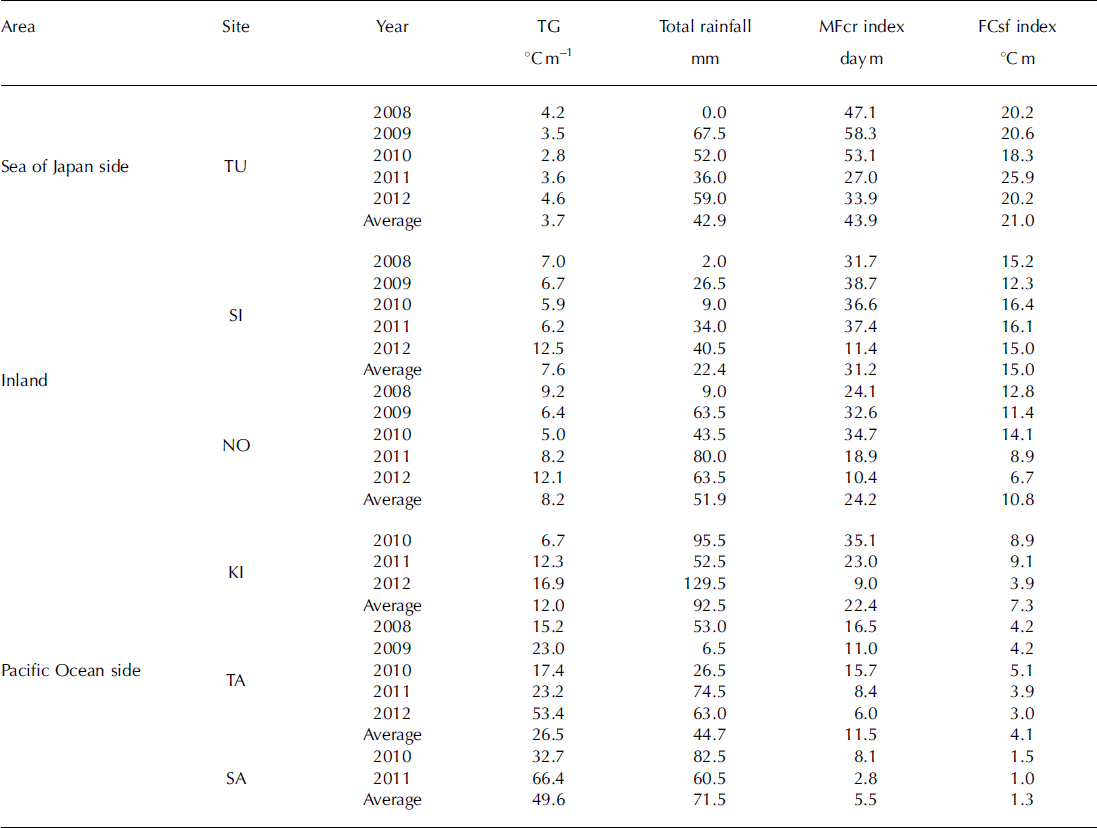
The MFcr index on average exceeded 40 daym in the mountain region on the Sea of Japan side, which is characterized by MFcr layers; this is notably larger than in the other mountain regions.
The FCsf index of the inland mountain regions, which are characterized by FCsf layers, was ∼10°Cm, which is suitable for the formation of FCsf layers. The FCsf index of the mountain region on the Sea of Japan side is too large and this suggests that snowfall that was too frequent prevented the formation of FCsf layers in this region.
As mentioned above, these indexes reflect the snowpack characteristics of the mountain regions mentioned in 3.1, so we believe that the indexes are useful indicators of snowpack characteristics.
4. Conclusion
Snow-pit observations were carried out over a period of between two and five winter seasons at six sites in the central mountains of Japan (Tsugaike-Kogen - the Sea of Japan side; Shiga-Kogen and Norikura-Kogen - inland; Kisokoma-Kogen, Tateshina-Kogen and Sanpuku-Toge - the Pacific Ocean side). The snowpack characteristics in the central mountains of Japan are revealed below with respect to typical persistent weaknesses: DH layers, FCsf layers, MFcr layers and SH layers.
For the mountains on the Sea of Japan side, the persistent weakness was caused mainly by the presence of MFcr layers. For the inland mountains, the persistent weakness was caused mainly by the presence of weak layers consisting of FCsf. For the mountains on the Pacific Ocean side, the persistent weakness was caused mainly by the formation of thick weak layers consisting of DH near the ground.
Compared with North America, SH was not seen in any of the mountain ranges and MF were often observed on the Pacific Ocean side where many DH layers exist. However, this study is based on observational data from only five winters, which are insufficient for summarizing climatic characteristics. There is thus a need to carry out long-term observations and improve the reliability of the data. However, findings on the regional characteristics of snow-packs with respect to avalanches have not been presented before and are expected to contribute towards safety measures to protect those who operate activities in the area, such as ski resorts, guided tours and recreationists.
The relationships between the regional characteristics of the persistent weaknesses and meteorological elements were evaluated. For each persistent weakness, meteorological elements were suggested as simple rough indicators of the likelihood of the formation of each persistent weakness:
DH layers: TG = |average air temperature| / averagesnow depth (°C m−1) (notable weakness in DH layers is found in areas where the TG exceeds 10°C m−1, but in such areas rainfall prevents the development of DH layers)
FCsf layers: FCsf index (°Cm) = average diurnal range of air temperature × snow depth (notable weakness in FCsf layers is found in areas where the FCsf index is ∼10°C m)
MFcr layers: MFcr index (daym) = number of days that exceed 0°C × snow depth (notable weakness in MFcr layers is found in areas where the MFcr index exceeds 40 day m).
The indicators proposed in this study focus on snowpack formation and represent snowpack characteristics more directly than do existing climatic classifications. Therefore, they may have broader applicability than only to limited areas, such as North America. Further, the indicators are available for each specific type of persistent weakness; therefore, it may be possible to recognize detailed characteristics of snowpacks related to avalanches in a particular region.
Because the indicators give only a rough tendency, they cannot be used for daily avalanche forecasting. However, we do believe that they are useful for anticipating avalanche problems for professionals undertaking new endeavours in unexplored regions or for recreationists who undertake expeditions in such regions. Furthermore, they are useful for gathering data on annual tendencies in well-used regions.
Using the same methodology, the next step would be to analyse data from North America and Europe and develop indicators for snowpack characteristics that are applicable globally. Such an analysis would also be helpful in identifying meteorological elements that can serve as indicators for regions in which the SH layer predominates and in explaining why the SH layer is not also observed in central mountain ranges in Japan.
Acknowledgements
We thank T. Katushima and T. Maehara for support with field measurements and for insightful suggestions.



