

Introduction
The late 2003 outbreak of highly pathogenic avian influenza (HPAI) H5N1 virus in East and Southeast Asia affected shell egg production, consumption, prices, and trade patterns in many countries around the world. In January 2004, Japan banned imports of shell eggs and products from HPAI infected countries to minimise the risks to poultry, laying hen flocks, and humans (USDA, 2004). The ban led to drastic reductions in Japan's imports of shell eggs, non-dried egg products, but a rise in the dried egg products. From the fourth quarter of 2003 to the first quarter of 2004, imports of shell eggs and non-dried egg products dropped 49 and 15 percent, respectively, but imports of dried egg products rose 10% (World Trade Atlas, Reference WORLD TRADE ATLAS2010).
However, in February 2004, Japan's poultry sector was infected by the HPAI virus, and foreign suppliers were needed to satisfy domestic requirements. Shell egg and product imports increased from 32.3 million kg in 2004 to a peak of 57.9 million kg in 2005. After the recovery of the laying hen flocks, import demand retreated to the pre-infection level, but the import-share pattern was different. Dried egg products grew to be the largest share, followed by non-dried egg products and shell eggs. Dried egg products were perceived to be much safer to import than shell eggs, which are a fertile media for potential transmission of several diseases on the shells surface, if not properly disinfected or fumigated. Thomas and Swayne (Reference THOMAS and SWAYNE2009) isolated HPAI virus from the internal contents of chicken eggs. The most volatile component of the non-dried egg product class is the albumin, due to its high water content: 87.7% compared with 6.5% to 8% in dried albumin (Thomas and Swayne, Reference THOMAS and SWAYNE2009). Higher water content increases the risk of transmitting diseases, if the product is not properly pasteurised.
The major objective of this article was to investigate whether Japan's import policies following HPAI created structural changes in import demand for eggs and products. The impact of HPAI virus outbreaks on Japan's import demand for eggs was evaluated by modelling an import demand system for 1994-2009. The basic model used was the Central Bureau of Statistics (CBS) model developed by Keller and Van Driel (Reference KELLER and VAN DRIEL1985). The basic model was modified to measure possible structural change in demand triggered by consumers’ rising demand for dried egg products, with a simultaneous weakening demand for non-dried egg product and shell eggs. The system model was estimated under the assumption that import demand for the three egg products can be separated from the demand for all other products, meaning that the demand system is conditioned on expenditures for these three egg classes.
Animal disease outbreaks
The two most serious animal diseases are Bovine Spongiform Encephalopathy (BSE) and HPAI, as both are potentially fatal to humans. The discovery of BSE in the United Kingdom (UK) in 1986 triggered a shift away from beef consumption toward pork, chicken, and lamb (Burton and Young, Reference BURTON and YOUNG1996; Henson and Mazzocchi, Reference HENSON and MAZZOCCHI2002; Leeming and Turner, Reference LEEMING and TURNER2004). Consumers’ fear of eating beef intensified after the British Government announced, on March 20th 1996, the possible fatal link between BSE and a new variant, Creutzfeldt-Jakob disease (vCJD), which is potentially fatal in humans. Declines in fresh beef purchases and consumption were reported in countries other than the UK (Atkinson, Reference ATKINSON2003), such as France (Latouche et al., Reference LATOUCHE, RAINELLI and VERMERSH1998), The Netherlands (Mangen and Burrell, Reference MANGEN and BURRELL2001), Belgium (Verbeke et al., Reference VERBEKE, WARD and VIAENE2000; Verbeke and Ward, Reference VERBEKE and WARD2001), Japan (Peterson and Chen, Reference PETERSON and CHEN2005), and the United States (Schlenker and Villas-Boas, Reference SCHLENKER and VILLAS-BOAS2008). Moreover, Peterson and Chen (Reference PETERSON and CHEN2005), Jin and Koo (Reference JIN and KOO2003), and Jin et al. (Reference JIN, SUN and KOO2003) found a structural change in Japan's meat market following the September 2001 BSE outbreaks in Japan, which caused a shift from domestic and imported beef consumption toward less risky substitutes, such as pork and chicken.
The HPAI (H5N1) virus was first found on a goose farm in Guangdong, China in 1996. The first HPAI outbreaks were reported on poultry farms, in live animal markets, and 18 human cases (6 fatal) in Hong Kong in 1997 (WHO, 2009). As of April 2010, HPAI outbreaks have been confirmed in 62 countries, with 495 human cases and 292 fatalities (OIE, 2009). In late 2003, the virus spread to other East and Southeast Asian countries, reaching Japan in 2004 (USDA, 2004). Several studies have addressed the impacts of HPAI outbreaks on poultry meat. Results indicated that production, consumption, prices, imports and/or exports of poultry declined in several countries. These included Japan (Ishida et al., Reference ISHIDA, ISHIKAWA and FUKUSHIGE2010), South Korea (Park, et al., 2008), Vietnam (Figuie and Fournier, Reference FIGUIE and FOURNIER2008), Turkey (Goktolga, and Gunduz, 2006), Nigeria (Obayelu, Reference OBAYELU2007), and a hypothetical HPAI outbreak in the United States (Paarlberg et al., Reference PAARLBERG, SEITZINGER and LEE2007).
Few economic analyses of the effect of HPAI outbreaks on consumer demand for eggs and egg products were found in the literature, due perhaps to the relative recentness of the first outbreaks. Under a hypothetical HPAI outbreak in the United States, U.S. consumer demand for poultry and eggs would decrease by 20% in the first quarter after the outbreak, and then recover totally by the fourth quarter (Paarlberg et al., Reference PAARLBERG, SEITZINGER and LEE2007). In Nigeria, the 2006 HPAI outbreaks had a negative impact on consumption and prices of chicken and eggs. Nearly 80% of the sampled households stopped buying and eating poultry products (Obayelu, Reference OBAYELU2007).
Although the HPAI virus did not strike Taiwan, three household surveys were conducted there to assess consumers’ reaction to poultry and egg consumption under possible outbreaks. The first survey reported that most consumers were aware that the HPAI virus is contained inside the egg or on its shell, and can be eliminated by prolonged cooking. Consequently, consumers reduced egg consumption and avoid eating poultry and eggs not thoroughly cooked (Liu et al., Reference LIU, HUANG and HSU2007). The second survey showed that about 44% of the primary household shoppers would reduce egg consumption, while 24% would not eat eggs at all amid HPAI outbreaks (Liu et al., Reference LIU, HUANG, HSU and LEE2009). The third survey indicated that previous knowledge of the HPAI disease was positively correlated with risk perception. Those with high risk perception would reduce consumption more amid the threat of HPAI outbreaks than those with low risk perception. Other authors reported that most consumers were aware that the HPAI virus could be eliminated by prolonged cooking of chicken and eggs, making them safe to consume (WHO, 2005; Hsu et al., Reference HSU, LIU, HUANG and LEE2008).
While consumers’ response showed a willingness to reduce egg consumption and to thoroughly cook eggs before consumption, there was no indication of any substitution effects for eggs and egg products following the HPAI virus outbreaks. In previous studies related to animal diseases, models of meat demand systems indicated that consumers switched, for safety reasons, from fresh beef to other meats such as pork, chicken, or lamb following BSE outbreaks (Burton and Young, Reference BURTON and YOUNG1996; Henson and Mazzocchi, Reference HENSON and MAZZOCCHI2002; Leeming and Turner, Reference LEEMING and TURNER2004; Peterson and Chen, Reference PETERSON and CHEN2005, Jin and Koo Reference JIN and KOO2003; Jin et al., Reference JIN, SUN and KOO2003). Similarily, following the HPAI outbreaks, consumer demand for fresh poultry decreased and was replaced by pork, beef, and fish products (Ishida et al., Reference ISHIDA, ISHIKAWA and FUKUSHIGE2010; Park et al., Reference PARK, JIN and BESSLER2008). Will consumers be willing to substitute processed egg products - either non-dried or dried - for shell eggs amid the threat of an HPAI outbreak? This question constitutes the major topic of this study.
The next three sections of this review provide background information about Japan's imports of shell eggs, non-dried and dried egg products, and import unit values for 1994-2009. Subsequent sections focus on data, methodology, empirical results, discussion, and final conclusions.
Japan's imports of shell eggs and egg products
There are three major global markets for eggs: shell eggs, non-dried egg products, and dried eggs products. In 2009, world imports of shell eggs totalled $2.45 billion; imports of non-dried egg products were valued at $572 million, and dried egg products were valued at $498 million. Over 1994-2009, the value of world egg imports rose more than three-fold to $3.5 billion, almost one-third of which were eggs products (World Trade Atlas, Reference WORLD TRADE ATLAS2010).
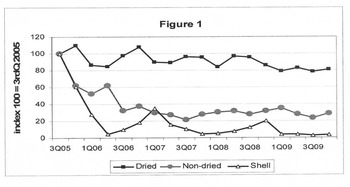
In 2009, Japan was the world's largest importer of dried-egg products, accounting for 24% of the world total in value terms. Following the 2003 HPAI outbreaks in East and Southeast Asia, Japan's aggregate egg imports dropped over 30% from the 4th quarter of 2003 to the 2nd quarter of 2004. However, the decline did not occur evenly in the three egg classes; shell eggs dropped 58%, non-dried egg products were down 61%, but dried egg products were up 4%. For all of 2005, and in reaction to the spread of the HPAI virus to Japan's layer flocks, imports rose 82% over 2004 to meet domestic requirements. Following the recovery of the layer flocks, imports declined in 2006 as much as they rose in 2005, with shell eggs dropping the most. The import index of dried egg-products decreased from 100 in the 3rd quarter of 2005 to 81 in the 4th quarter of 2009, while the indexes for non-dried egg products and shell eggs declined to 28 and 4 (Figure 1).
Import indices for shell and egg products, 3rd Q 2005-4th Q 2009.

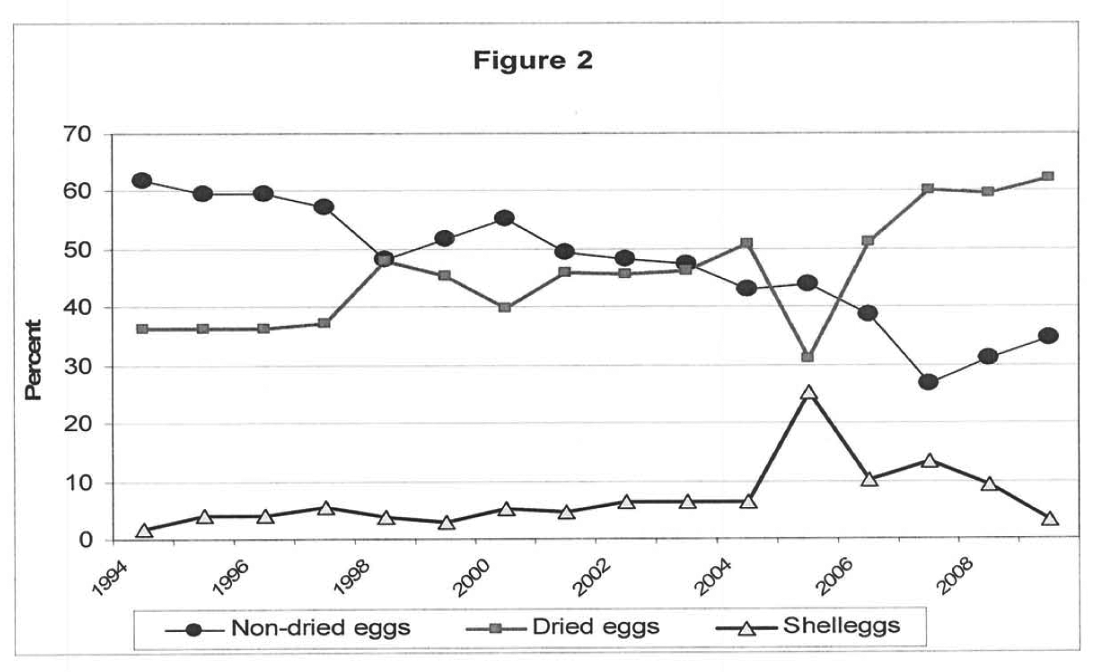
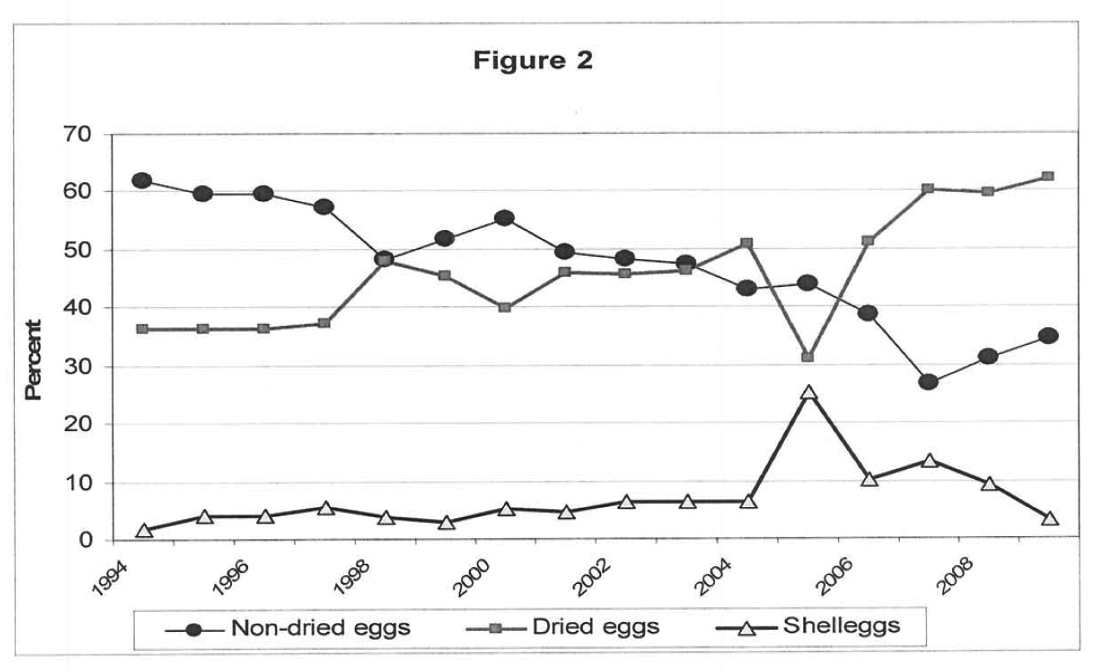
Quarterly expenditure shares also changed, with the index expenditure for dried eggs rising from 100 in the 3rd of quarter 2005 to 129 in the 4th quarter of 2009, whereas the indexes for non-dried and shell eggs dropped from 100 to 47 and 17, respectively. The rising pattern of import shares of dried egg products was also recorded over 1994-2009. The import share of dried egg products rose from 36% of total egg imports in 1994 to 62% in 2009, while non-dried egg products declined from 62% to 35% (Figure 2).
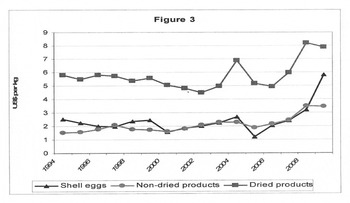
Dried egg products carry the highest price tag in Japanese markets, as indicated by the average-weighted import value per unit, including freight, insurance, and other costs. Dried albumin has the most expensive value per kilogram, ranging from $6.84 per kg in 1994 to as high as $9.08 in 2009 in nominal terms. Non-dried egg products carried lower values than the dried egg products by a factor between 2 and 3. Within this class, albumin was the least expensive, because it has the highest water content of 87.7%. Usually, shell eggs ran slightly higher in value than non-dried egg products, except for 2005, when their value decreased sharply to $1.20 per kg, compared with $1.89 for the weighted average of non-dried egg products.
In 2008, the unit value of all three egg classes rose substantially due to very high feed prices in the international markets. The 2009 import unit value of non-dried and dried egg products declined slightly, but not for shell eggs. In 2009, for the first time in the post HPAI-outbreak era, shell eggs - valued at $5.81 per kg - were valued higher than non-dried egg products (Figure 3). Import values of all three egg classes in 2009 were much higher than their 1994 levels, by nearly 132% for shell eggs, 128% for non-dried egg products, and 35% for dried egg products (Figure 3).
Japan's imports shares of shell, non-dried, and dried eggs, 1994-2009.
Import values of shell, non-dried, and dried egg-products in nominal-terms, 1994-2009.

Data sources
Japan's egg imports were divided into three classes: shell eggs, non-dried egg products, and dried egg products. The shell-eggs class contained two harmonised standards (HS) or harmonised tariff code categories; table eggs (HS 040700210), and preserved shell eggs (HS 040700220). Non-dried egg products are fresh, frozen, and cooked products defined by three codes: whole egg (HS 040819), yolk (HS 040899), and egg albumin (HS 350219). Dried egg products are comprised of whole eggs (HS 040891), yolks (HS 040811), and albumin (HS 350211) in dried form.
Monthly trade data on imports and prices are available at the HS 6-9 digit level for each product, with consistent trade categories beginning in January 1994. Data on import quantities for each egg class were aggregated, and a unit value ($U.S. per kilogram) was calculated as the weighted average for each of the three classes. The final data consisted of two series: the quantity imported in kilograms (kg) and the unit value in U.S. dollars (per kg), including freight, insurance, and other charges exclusive of any Japanese import duties at the port of arrival, which represents a monthly average price. Data were obtained from Japan customs data and the World Trade Atlas (World Trade Atlas, Reference WORLD TRADE ATLAS2010).
The applied model
A demand system for the three egg import categories was estimated using monthly data from January 1994 to November 2009, a total of 191 observations (121 of these observations occur before the Japanese Government's reaction to the HPAI outbreak). The system is estimated under the assumption that egg import demand can be separated from the demand for all other products. The specific demand system used a modification of the CBS model, which was developed by Keller and Van Driel (Reference KELLER and VAN DRIEL1985). The CBS model is a differential model based on the derivatives of the demand system. One advantage of differential demand systems is that it is easier to incorporate taste shifts into differential models than other common specifications, as reported by Alston et al. (Reference ALSTON, CHALFANT and PIGGOTT2000).
The CBS model represents a consumer demand system; egg imports are inputs into consumer products. As inputs, they should be modelled using derived demand. Theil (Reference THEIL1977) demonstrated that differential consumer demand systems could be used to model cost-minimising input demands. One merely needs to re-interpret some of the terms.
All differential demand systems use the total differential of the budget constraint:
(1) 
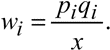
where, qi and pi are the quantity and price of good i, x is the total expenditure, and wi is the budget share for product ‘i’ defined as:
(2) 
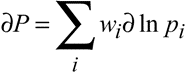
The summation terms in equation (1) are often replaced with divisia price and quantity indices, defined as:
(3) 
(4) 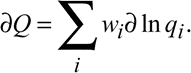
Equations (3-4) can be inserted in (1) and rearranged to produce:
(1a) 
In their development of the CBS model, Keller and Van Driel (Reference KELLER and VAN DRIEL1985) first focused on the price and expenditure derivatives. They started with a set of partial differential equations taking the form:
(5)  , or
(5a) 
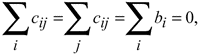
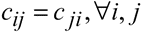
The forms in equation 5 and equation 5a are equivalent; one simply uses different sides of 1a in the specification. Keller and Van Driel (Reference KELLER and VAN DRIEL1985) used equation 5 in their discussion of the CBS; it is a more appealing version from the standpoint of consumer theory. The version shown in 5a makes more sense in a derived demand context. Theil (Reference THEIL1977) showed that changes in the diverse quantity index corresponded to changes in total output. The bi and cij are coefficients that, along with the egg's share of total egg expenditure, determine the elasticities of demand. The cij determine how cost-minimising demands change in response to prices and the bi show how demands react to the scale of the output. In order to be consistent with optimization, the coefficients have to be homogeneous of degree 0, consistent with the budget/total cost constraint and symmetric. The following equations assure that these conditions are met:
(6) 
(7) 
In both the consumer and input demand contexts, optimization implies that compensated or cost-minimizing demand derivatives must be negative, semi-definite (NSD) in prices. The CBS system is globally NSD when the matrix of cij is itself NSD. These economic restrictions were imposed on all the estimates.
The CBS is usually estimated under the assumption that the differential system is well-approximated by a difference-type model. Equation 8 shows the most complete version of the CBS model estimated for this study.
(8) 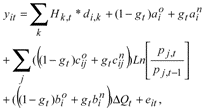 where
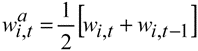
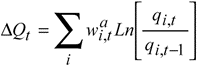 , and
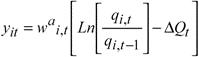
The subscript ‘t’ is the index number of a specific month, t‑1. The term yit is the endogenous variable of the model; it is a function of budget shares and quantities as demonstrated below the equation. The endogenous variables sum to 0 every month. This makes their random error terms, eit sum also to 0 every month.
The Hk,t are a set of dummy variables and the di,k are their estimated coefficients. The sum of the di,k over the equations must be 0 for each ‘k.’ The dummy variables are 11 monthly seasonal dummies, and 3 HPAI-related dummies for February, March, and April 2004. The ‘a’ terms are intercepts; their coefficients have to sum to 0 when summed over the three types of eggs.
In addition, there are two sets of ai, cij and bi coefficients in equation 8. Those with the superscript ‘o’ are pre-HPAI (old) terms, while those with the superscript ‘n’ are the post-HPAI (new) terms. The term gt makes the coefficients shift between the old and new variables. Before February 2004, g is 0; only the ‘old’ coefficients are used prior to then. After February 2006 g is 1; the model switches to the ‘new’ coefficients at that point. We allowed a 24-month adjustment period where the g can range between 0 and 1. The g term in the adjustment period is determined by the following equation:
(9) 
The new terms in equation 9 are zt,k a set of three positive exogenous variables, fk the three positive coefficients associated with the exogenous variables, and k, a positive coefficient. The numbers 122-145 in equation 9 are the time-period indices for the February 2004-Janaury 2006 adjustment period. The first of the ‘z’ terms is a dummy variable that is 1 for the entire adjustment period, February 2004 through January 2006. The second ‘z’ is 0 for the first 12 months of the adjustment period and 1 from February 2005 through January 2006. The third term is a trend that started at 1 in February 2004 and increases by 1 per month hitting 24 in January 2006. The model forces gt to lie between 0 and 1 in the adjustment period and require it to be monotonic. Consequently, the model requires fk and k to be positive.
The major objective of the paper is to determine whether the HPAI outbreaks and government corresponding policies caused structural changes in demand for imported eggs, or the effects were transitory. There are two components of equation 8 that allow for testing hypotheses about structural changes. The first is the shift from old to new values for the ai cij and bi. The cij and bi terms determine the demand elasticities. If the ‘new’ terms equal the ‘old’ ones, there will be no change in the elasticities of demand. The second set of demand shifters is the coefficients for the three dummies for the months of February, March, and April 2004, the HPAI monthly dummies. Non-zero HPAI coefficients indicate demand shifts that would increase some products’ demand and decrease others. The dummy variable effects are playing out over a relatively short time periodFootnote *, however, just because there are no dummy variables for the later months does not mean that HPAI-related shifts will not affect demand after April 2004. The CBS model is basically a first-difference model. Once demand is raised in one month, it is going to be higher in the following months and vice versa, that is, the effect of a demand decline in one month will decrease the following month's demand. There are no structural changes in demand if all the disease-dummy coefficients are 0 and all the new and old ai, cij and bi are identical.
The model was estimated by deleting an equation and using the budget-related restrictions to estimate the coefficients of the deleted equation. Since we used full information maximum likelihood (FIML), the estimates are independent of the excluded equation. Several versions of the model were run to compare the likelihoods of the more and less constrained models, using maximum likelihood estimation. Most of the executed tests are asymptotically chi-square under the null hypothesis.
Limitations of applied approach
The applied CBS model is based on the assumption that the demand for imported eggs can be separated from demand for other inputs in making products from imported eggs. Under these conditions, one can estimate demands for imported eggs conditional on the total scale of egg imports. The separateability assumption does not mean that the prices of other inputs are irrelevant to imported egg demand. Other input costs and domestic egg-product prices would help determine imported egg demand. Changes in consumer tastes and production technology could change the total scale of egg imports or change the relationship between imported eggs and other imports. The applied model cannot measure these effects. However, statistically-significant changes in the conditional model are evidence that something happened to imported egg demand. Statistically insignificant changes are not good evidence that nothing happened to egg-import demand; the analysis may not have included some potentially important effects (variables).
Another limitation of the applied CBS model is the modelling of the HPAI ‘event’ itself. For modelling purposes, February 2004 was designated as the observation of the breaking of HPAI out and changing government policies in Japan. If there had been ongoing structural change in conditional demand prior to HPAI, the results suggest that HPAI caused the shift. To strengthen the case for HPAI driving the shifts, we decided to estimate an alternative version of the CBS model that allowed the ‘g’ variable to begin shifting up to two years earlier. A 24-month-ahead-of-HPAI dummy was added along with a 12-month-ahead-of-time dummy, and another trend (running 0-23 from February 2002-January 2004, staying at 23 afterward). The sign constraints on the ‘g’ and its coefficients mean that these estimates will violate the regularity conditions for making the tests asymptotically chi-square. For instance, under the null hypothesis there is a non-0 chance that all the early-start parameters will be 0; a model that imposes no early start could have the same objective as one that allowed early start. The model test in this case would be 0. Consequently, Monte-Carlo techniques were used to evaluate the ‘early start’ tests.
Empirical results
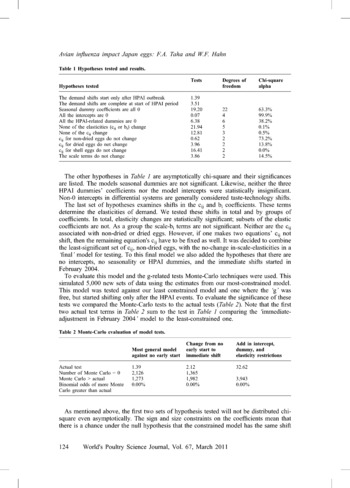
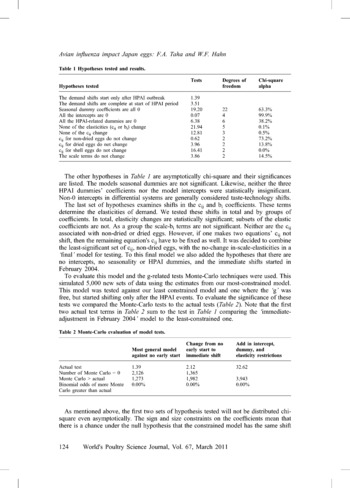
Preliminary hypotheses tests were run to compare constrained models with the most general alternative. As indicated in Table 1, the first two tests in the table deal with the ‘g’ terms, which initiate the parameters to shift-demand from the old to the new values. The first test was to determine whether the demand shifts started before the HPAI-outbreaks in February 2004. The second hypothesis tested is that the model's ‘g’ goes to 1 (and stays there) on February 2004. These two hypotheses are not distributed chi-square because they violate the regularity conditions, and therefore their chi-square based significances are not reported in Table 1. The two hypotheses were tested using Monte-Carlo techniques as indicated in Table 2 along with evaluation and test results of the model's ‘final’ structure. These results are discussed in detail below, but to summarize the results regarding the start of the demand shift of model's ‘g’ or equation 9: neither the ‘early start’ nor ‘slow-adjustment’ hypotheses are statistically significant. Therefore, we accept that the demand coefficients did change from their ‘old’ values to the ‘new’ ones in February 2004.
Hypotheses tested and results.

The other hypotheses in Table 1 are asymptotically chi-square and their significances are listed. The models seasonal dummies are not significant. Likewise, neither the three HPAI dummies’ coefficients nor the model intercepts were statistically insignificant. Non-0 intercepts in differential systems are generally considered taste-technology shifts.
The last set of hypotheses examines shifts in the cij and bi coefficients. These terms determine the elasticities of demand. We tested these shifts in total and by groups of coefficients. In total, elasticity changes are statistically significant; subsets of the elastic coefficients are not. As a group the scale-bi terms are not significant. Neither are the cij associated with non-dried or dried eggs. However, if one makes two equations’ cij not shift, then the remaining equation's cij have to be fixed as well. It was decided to combine the least-significant set of cij, non-dried eggs, with the no-change in-scale-elasticities in a ‘final’ model for testing. To this final model we also added the hypotheses that there are no intercepts, no seasonality or HPAI dummies, and the immediate shifts started in February 2004.
To evaluate this model and the g-related tests Monte-Carlo techniques were used. This simulated 5,000 new sets of data using the estimates from our most-constrained model. This model was tested against our least constrained model and one where the ‘g’ was free, but started shifting only after the HPAI events. To evaluate the significance of these tests we compared the Monte-Carlo tests to the actual tests (Table 2). Note that the first two actual test terms in Table 2 sum to the test in Table 1 comparing the ‘immediate-adjustment in February 2004’ model to the least-constrained one.
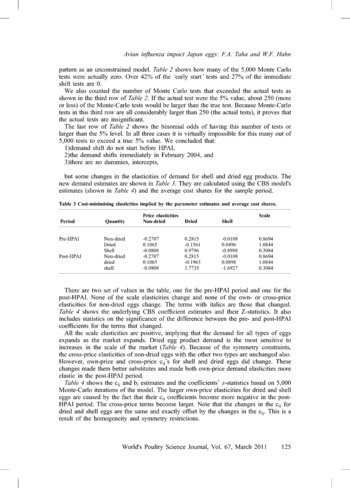
Monte-Carlo evaluation of model tests.

As mentioned above, the first two sets of hypothesis tested will not be distributed chi-square even asymptotically. The sign and size constraints on the coefficients mean that there is a chance under the null hypothesis that the constrained model has the same shift pattern as an unconstrained model. Table 2 shows how many of the 5,000 Monte Carlo tests were actually zero. Over 42% of the ‘early start’ tests and 27% of the immediate shift tests are 0.
We also counted the number of Monte Carlo tests that exceeded the actual tests as shown in the third row of Table 2. If the actual test were the 5% value, about 250 (more or less) of the Monte-Carlo tests would be larger than the true test. Because Monte-Carlo tests in this third row are all considerably larger than 250 (the actual tests), it proves that the actual tests are insignificant.
The last row of Table 2 shows the binomial odds of having this number of tests or larger than the 5% level. In all three cases it is virtually impossible for this many out of 5,000 tests to exceed a true 5% value. We concluded that:
1) demand shift do not start before HPAI,
2) the demand shifts immediately in February 2004, and
3) there are no dummies, intercepts,
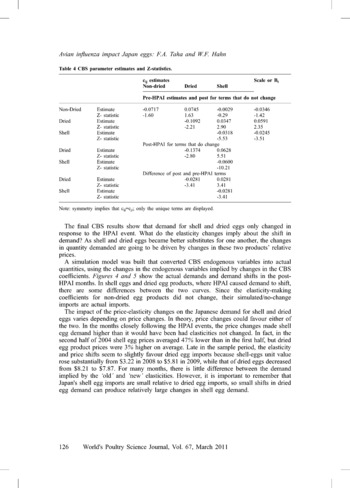
but some changes in the elasticities of demand for shell and dried egg products. The new demand estimates are shown in Table 3. They are calculated using the CBS model's estimates (shown in Table 4) and the average cost shares for the sample period.
Cost-minimising elasticities implied by the parameter estimates and average cost shares.

There are two set of values in the table, one for the pre-HPAI period and one for the post-HPAI. None of the scale elasticities change and none of the own- or cross-price elasticities for non-dried eggs change. The terms with italics are those that changed. Table 4 shows the underlying CBS coefficient estimates and their Z-statistics. It also includes statistics on the significance of the difference between the pre- and post-HPAI coefficients for the terms that changed.
All the scale elasticities are positive, implying that the demand for all types of eggs expands as the market expands. Dried egg product demand is the most sensitive to increases in the scale of the market (Table 4). Because of the symmetry constraints, the cross-price elasticities of non-dried eggs with the other two types are unchanged also. However, own-price and cross-price cij’s for shell and dried eggs did change. These changes made them better substitutes and made both own-price demand elasticities more elastic in the post-HPAI period.
Table 4 shows the cij and bi estimates and the coefficients’ z-statistics based on 5,000 Monte-Carlo iterations of the model. The larger own-price elasticities for dried and shell eggs are caused by the fact that their cii coefficients become more negative in the post-HPAI period. The cross-price terms become larger. Note that the changes in the cii for dried and shell eggs are the same and exactly offset by the changes in the cij. This is a result of the homogeneity and symmetry restrictions.
CBS parameter estimates and Z-statistics.

Note: symmetry implies that cij=cji; only the unique terms are displayed.
The final CBS results show that demand for shell and dried eggs only changed in response to the HPAI event. What do the elasticity changes imply about the shift in demand? As shell and dried eggs became better substitutes for one another, the changes in quantity demanded are going to be driven by changes in these two products’ relative prices.
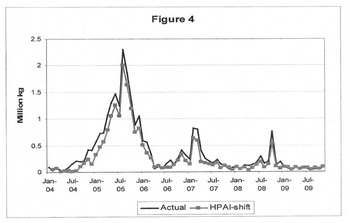
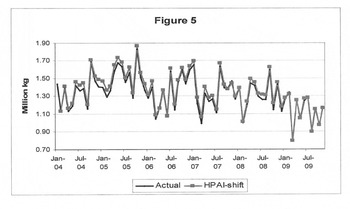
A simulation model was built that converted CBS endogenous variables into actual quantities, using the changes in the endogenous variables implied by changes in the CBS coefficients. Figures 4 and 5 show the actual demands and demand shifts in the post-HPAI months. In shell eggs and dried egg products, where HPAI caused demand to shift, there are some differences between the two curves. Since the elasticity-making coefficients for non-dried egg products did not change, their simulated/no-change imports are actual imports.
The impact of the price-elasticity changes on the Japanese demand for shell and dried eggs varies depending on price changes. In theory, price changes could favour either of the two. In the months closely following the HPAI events, the price changes made shell egg demand higher than it would have been had elasticities not changed. In fact, in the second half of 2004 shell egg prices averaged 47% lower than in the first half, but dried egg product prices were 3% higher on average. Late in the sample period, the elasticity and price shifts seem to slightly favour dried egg imports because shell-eggs unit value rose substantially from $3.22 in 2008 to $5.81 in 2009, while that of dried eggs decreased from $8.21 to $7.87. For many months, there is little difference between the demand implied by the ‘old’ and ‘new’ elasticities. However, it is important to remember that Japan's shell egg imports are small relative to dried egg imports, so small shifts in dried egg demand can produce relatively large changes in shell egg demand.
Japan's actual and simulated imports of shell eggs, 2004-2009.

Japan's actual and simulated imports of dried eggs, 2004-2009.

Conclusions
The paper has successfully modelled the first egg import demand system. Analysis showed consumer's willingness to substitute - for safety issues - processed dried egg-products for fresh shell eggs amid the threat of an HPAI outbreak. All previous studies, addressing the HPAI impact on egg consumption concentrated mostly on consumer risk perception rather than modelling import demand system. They reported that consumer's response was fluctuating from not eating eggs at all, reducing consumption, and cooking eggs thoroughly before consumption.
Prior to running the final version of the applied CBS model, the effective date of demand shift or structural change was examined. For modelling purposes, February 2004 was designated as the observation of the breaking of HPAI out, the start of demand shift, and changing government policies in Japan. If there had been ongoing structural change in conditional demand prior to February 2004, the results would suggest that HPAI could have caused the shift. To strengthen the case for HPAI driving the shifts, alternative version of the CBS model was estimated, allowing an earlier start of demand shifting up to 2 years earlier. Because the alternative CBS version has sign and bound constraints, it would violate the regularity conditions for making the tests asymptotically chi-square. Therefore, test statistics were evaluated by Monte Carlo techniques. Monte-Carlo results showed that neither allowing demand shifts to start early nor allowing slow-dynamic shifts were statistically significant. Consequently, the hypothesis that the demand shifted in February 2004 was accepted.
Analysis of the modified CBS model indicated statistically significant changes in own- and cross price elasticities of import demand for shell and dried eggs, while import demand for non-dried egg products was unchanged. These results are in accordance with scientific evidences determining the likelihood of HPAI-virus to transmit the disease. Non-dried egg products were the least likely because they are pasteurized--a way of killing the virus-- upon processing. Shell eggs are the most likely because they could carry the virus on the shells surface as well as inside (WHO; 2005). Dried egg-products require heating that kills the virus. In addition, the CBS results indicated that disease-dummies, seasonality dummies, and intercepts shifting were statistically insignificant.
The applied CBS model is based on the assumption that the demand for imported eggs can be separated from demand for other inputs in making products from imported eggs. This allows the demands to be estimated conditional on the total scale of egg imports. The model's results showed that the conditional demand shifted. Other factors may have shifted the scale of egg imports as well. However, this study is not designed to measure shifts in egg import scale that may have resulted from HPAI outbreaks. Analysing the impact of HPAI on total market scale would require a different type of statistical modelling approach, partially because import scale depends on both domestic demand and domestic supply. The statistically-significant changes in the conditional model are evidence that something happened to imported egg demand.
Testing the cij and bi coefficients, which determine the elasticities of demand, was undertaken in total and by groups of coefficients. In total, elasticity changes were statistically significant; subsets of the elastic coefficients were not. As a group, neither the changes in the scale nor in non-dried coefficients were statistically significant.
The impact of elasticity changes on Japan's egg imports varies depending on how prices change relative to one another and market scale. To see how these elasticity changes were translated to quantity changes a simulation model was used.
If Japanese buyers were concerned about the disease risks associated with imported eggs, they might tend to buy fewer eggs. This was generally the case, except for few months in 2005, which coincided with the time when the HPAI outbreaks spread intensively in Japan. Imports rose substantially from HPAI-free countries such as the United States, Brazil, and the Netherlands to compensate for the losses of domestic production. After the recovery of Japan's layer flocks in 2005, the domestic import market scale started to decline again as expected, with dried egg-products taking a larger and larger share of Japan's total imports.
Finally, the findings of the CBS model are in concurrence with Japan's actual post-HPAI statistical data. Both show a rising import demand for the safer dried egg products, with a simultaneous weakening demand for non-dried egg product and shell eggs. From 4th Q, 2003 to the 1st Q, 2004, Japanese imports of shell eggs and non-dried egg products dropped 49% and 15%, respectively, but those of dried egg products actually rose over 10%. This trend continued to the 4th Q 2009, as measured by their import shares. Both shares of shell eggs and non-dried egg products declined from 6% and 46% to 3% and 34%, respectively, while share of dried egg products rose substantially from 48% to 62%.
A differential demand system [CBS model] was used to evaluate the impact of the 2004 HPAI (H5N1) outbreaks on Japan's import demand for shell eggs and egg products, including yolk, albumin, and whole eggs in dried and non-dried form. The model is consistent with derived demand; imported eggs are used in the production of other products. It is also easy to add structural change to derived demand models while keeping them consistent with optimisation theory.
Egg imports were divided into three classes: shell eggs, non-dried egg products, and dried egg products. The demand for these three products were estimated (conditional on total egg imports) and tested for structural changes caused by changes in Japan's egg import policies. Analysis shows structural change in two of the three classes of egg imports; shell eggs and dried egg products. In the post-HPAI period (2004-2009), the two products became better substitutes for each other and their demand became more own-price elastic.
Knowing that the demand elasticity changes are statistically significant shows us that the structure of Japanese egg import demand changed. However, the effects of these elasticity changes on egg imports depend on how the relative prices of dried and shell eggs vary over time. To measure these effects, we simulated the model for the post-HPAI periods using the pre-HPAI coefficients. The elasticity changes can either increase or decrease the demand for a given product.
One of the interesting features of post-HPAI imports of eggs is their volatility. Because the post-HPAI demand for shell and dried egg products in Japan becomes more elastic, it tends to be slightly more volatile. For example, in 2005 shell and dried egg imports were quite volatile, dropping by 55% and 25%, respectively, from a year before. Prices favoured import substitution of shell eggs over dried eggs. In 2009, the prices favoured dried egg product imports because their price declined 4%, while shell egg prices rose 80% over the previous year. Volatility and trends in egg imports are largely due to changes in prices. Non-dried processed egg demand was also volatile, but the estimates suggest that its demand showed no statistically significant response to HPAI.
With the exception of few months in 2005, Japan's post-HPAI data show an overall decline in total egg imports. The decrease in imports was accompanied by new shares for each egg class, whereby dried egg products were vastly dominating up to 2009.
Results of the CBS model conclusively demonstrate structural change in the Japanese egg market after the 2004 HPAI outbreaks. HPAI could have affected egg demand by changing the total level of egg imports, which is defined as the ‘scale’ of the market. The CBS demand equations show how egg imports are divided among the three types of eggs given the total volume of eggs imported; that is the demand equations are estimated conditional on total egg imports. The generally lower levels of egg imports in the post-HPAI period are consistent with decreases in egg demand driven by consumer concerns about HPAI. However, the study did not intend to investigate eventual changes in Japan's market scale, which would require a different modelling approach. Explaining Japan's scale of imports requires comprehensive analysis of domestic egg supply and domestic egg demand by egg product and the overall substitution between imported and domestic eggs. One potential expansion of this work would be the development of a model to explain and predict these factors to test for HPAI-related shifts in market scale.