I. INTRODUCTION
Nanostructured materials form the basis of nanotechnology. Their unique morphology and small sizes can proportionate unique and largely improved properties compared to the coarse-grained bulk materials. Among these nanostructures, functional oxides have drawn much attention since they can be used for fabricating nanodevices. For example, tin oxides show potential applications in optoelectronic devices, gas sensors, field-effect transistors, biophysics, catalysis, batteries, among others. Reference Hu, Ma, Shang, Xie, Wong, Lee and Lee1–Reference Brovelli, Chiodini, Lauria, Meinardi and Paleari10
Nanostructured materials are generally synthesized in a number of forms like isolated or loosely connected nanoparticles in the form of powder, composites of nanoparticles dispersed in a host matrix, or a compact collection of nanograins as pellets or thin films.
High-energy ball milling or mechanical alloying is a technique that starts with a mixture of powders (elemental or prealloyed), which is milled down to finely dispersed particles to form alloy powders with unique microstructures. From the technological point of view, the manipulation of this microstructure may offer a possibility to design new materials with physical properties appropriate for specific applications. Reference Gleiter11 However, some researchers Reference Lee and Kwun12 have reported problems related to the desired final chemical composition and homogeneity after ball milling due to severe plastic deformation and welding of very ductile powders.
There exist two methods to prevent severe welding: (i) cryogenic milling and (ii) adding a process control agent (PCA). However, organic PCAs containing atoms such as O, C, H, etc. may affect the process. Sometimes these atoms remain as impurities after consolidation of mechanically alloyed powders.
This paper reports the possibility of obtaining nanostructured tin oxides (SnO and SnO2) from the milling of tin powder with stearic acid, followed by annealing at specific temperatures. The mean crystallite sizes, microstrain, and phase transformations are examined using XRD, Rietveld refinement, and DSC techniques.
II. EXPERIMENTAL PROCEDURES
Tin powder (Alfa Aesar, Ward Hill, MA, purity 99.8%, 325 mesh) was sealed together with four tungsten carbide balls of 10-mm diameter, in a cylindrical tungsten carbide container under a vacuum of 3.2 × 10⁻² Pa. As tin is a ductile material, 3 wt% of CH3(CH2)16CO2H (stearic acid) was added as PCA to avoid welding between the particles during the milling process. The ball-to-powder weight ratio (BPR) was 8:1. The container was coupled to a Pulverisette 7 Premium Line micro planetary mill operating at 850 rpm. Fourteen different ball-milling times were used: 2, 4, 6, 8, 10, 12, 14, 16, 18, 20, 22, 24, and 28 h.
The structural changes were followed by XRD measurements performed on a Bruker D2 Phaser diffractometer (Bruker AXS, Karlsruhe, Germany) equipped with a Cu target (λ = 0.15406 nm). The Rietveld method, Reference Rietveld13 as implemented in the GSAS Reference Larson and von Dreele14 package, was used to refine the structural parameters obtained from the XRD patterns, following the guidelines recommended by the International Union of Crystallography (IUCr). Reference McCusker, Von Dreele, Cox, Louër and Scardi15 Chebyschev polynomials were used to fit the background, while a convolution of the modified Thompson–Cox–Hasting pseudo-Voigt function was used to fit the peak shapes. A silicon standard sample was used to take into account the broadening due to instrumental effects, and it was assumed that the thermal parameters were isotropic. The thermal behavior of the samples was investigated by DSC thermograms in a Shimadzu DSC-60 cell (Shimadzu Corporation, Kyoto, Japan) under flowing argon in aluminum pans, from 50 °C until 350 °C using two heating rates: 10 and 2 °C/min. Based on DSC results, two isothermal annealings were performed at temperatures of 240 and 350 °C for 20 min.
III. RESULTS AND DISCUSSION
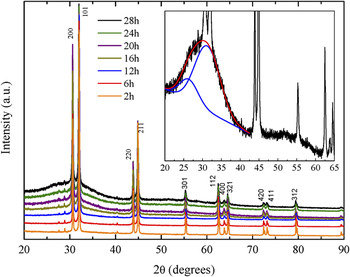
Figure 1 shows the seven most representative XRD patterns of milled samples. The precursor material was identified as the β-Sn structure, space group I41/amd (141), which is in excellent accordance with ICSD database 16 card 43,613.
XRD patterns measured with increase of milling time.

The peaks centered at 2θ ∼ 27.7° and 2θ ∼ 28.9° are indicative of Bi2Sn2O7, space group Fd-3m (227), in small amount. This phase was identified using the Bruker's Eva software in conjunction with the 2007 PDF-2 ICDD card 00-056-0657. 17 This type of impurity is usually added to Tin to suppress the allotropic phase transition which occurs at 13.2 °C Reference Gialanella, Deflorian, Girardi, Lonardelli and Rossi18 and, therefore, it was not considered in this paper.
The high-energy ball milling process introduces high densities of structural defects in metals and alloys, besides a reduction in the average crystallite sizes. Generally, when the sample components are fragile, it is common to observe a lot of the material in the grain boundaries. Reference Chookajorn, Murdoch and Schuh19,Reference Poffo, de Lima, Souza, Trichês, Grandi and de Biasi20 However, when the components are ductile, it is expected that such effect occurs in a less pronounced way.
In Fig. 1, the gradual increase of the baseline shows that successive collisions between spheres and particles produce large quantity of defects when stearic acid is present. In fact, PCAs containing carbon, hydrogen, and oxygen (such as stearic acid) are prone to introduce oxygen and carbon in the surface of the powder particles, resulting in the formation of oxides and carbides evenly dispersed in the matrix. Reference Suryanarayana21 In turn, hydrogen can act as a surfactant and does not participate in the alloy formation process. On the other hand, it is known that hydrogen induces embrittlement in several metal alloys. In particular, Muktepavela et al. Reference Muktepavela, Vasylyev, Czerwinski and Rogulski22 reported that the embrittlement of Sn–Al alloy, during contact with water vapors, happens mainly due to interaction of hydrogen with the tin surfaces forming SnH4 hydrides. The formation of SnH4 occurs only upon the fulfillment of two conditions Reference Samsonov23 : the presence of atomic hydrogen and of free bonds of tin. Indeed, the dissociation of the stearic acid and tin deformations, during milling processes, satisfies these two conditions. The authors also affirm that SnH4 shows instability and decomposes at room temperature.
The baseline profile can be seen in more detail in the inset of Fig. 1. This profile is characteristic of amorphous structures and the broad band, extended from 2θ = 20–40°, corresponds to x-ray scattering from atomic distribution of first neighbors. As this broad band is an atomic distribution of distances of the disordered structure, Gaussian functions are applied to fit the shape of the amorphous halo. A good fit is achieved only when two Gaussians are considered. Thus, the interatomic distances r of this structure can be estimated by applying the Ehrenfest formula Reference Rachek24 :
 $$2r\sin {\rm{\theta }} = 1.23{\rm{\lambda }}\quad ,$$
where λ is the wave length of x-rays and θ is the half angle of diffraction. The first Gaussian, with smaller area, is centered at 2θ = 26.4°, whereas the second, bigger and more relevant, is centered at 2θ = 31.1°. So, according to Ehrenfest formula, the interatomic distances are 4.1 and 3.5 Å. Using the same methodology applied to the x-ray diffraction pattern reported in Ref. Reference Idota, Kubota, Matsufuji, Maekawa and Miyasaka25 for the amorphous tin oxide, an interatomic distance of 4.0 Å was obtained, which the authors of the referred work claim to be the distributions of distances of Sn–Sn pairs. On the other hand, we observe a gradual enlargement of diffraction lines of the crystalline component indicating a gradual reduction in average crystallite sizes.
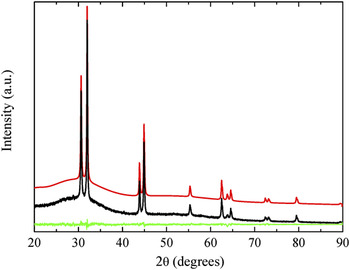
All patterns were simulated using the Rietveld structural refinement procedure through the GSAS code and the data given in the ICSD code. Good simulations were obtained only by choosing the Chebyschev function with ten parameters to fit the background, reaching R w and R wp factors smaller than 10%. Figure 2 depicts the experimental and simulated XRD patterns of the powder after 28 h of milling, where one can see an excellent agreement as it is shown by the difference curve (bottom).
XRD pattern of the sample milled for 28 h (black line) and its Rietveld simulation (red line). The bottom line represents the difference between the experimental and the simulated pattern.

The average crystallite sizes and microstrain can be estimated from the simulated XRD pattern taking into account the line broadening caused by both crystallite size and microstrain by the equation Reference Strand26
 $$\left( {{{{\rm{\beta }}_{\rm{t}} \cos {\rm{\theta }}} \over {K{\rm{\lambda }}}}} \right)^2 = {1 \over {d^2 }} + {\rm{\sigma }}_p^2 \left( {{{\sin {\rm{\theta }}} \over {K{\rm{\lambda }}}}} \right)^2 \quad ,$$
where θ is the diffraction angle, λ is the x-ray wave length, βt is the total broadening measured at the full-width at half-maximum (FWHM) of the peak (in radians), d is the crystallite size, σ
p
is the strain, and K is a constant dependent on the measurement conditions and definition of βt and d. Here, K is assumed to be 0.91 as usual in the Scherrer's formula. Graphical linearization of the above relationship, i.e., plotting
 ${\rm{\beta }}_{\rm{t}}^{\rm{2}} \cos ^2 {\rm{\theta }}/{\rm{\lambda }}^2$
versus
 $\sin ^2 {\rm{\theta }}/{\rm{\lambda }}^2 ,$
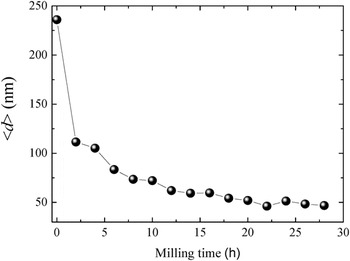
yields the average crystallite size free from strain effects and the strain. The GSAS code generates the βt and 2θ positions for all the simulated peaks. Thus, considering these values in Eq. (2), the mean crystallite sizes of the samples' crystalline phase for all milling times were obtained and are shown in Fig. 3. In the first 2 h of milling, a decrease of approximately 49% in the mean crystallite size was observed; whereas after 28 h, this decrease becomes approximately 84% relative to the precursor tin powder.
Mean crystallite size as a function of milling time.

Recently, Gialanella et al. Reference Gialanella, Deflorian, Girardi, Lonardelli and Rossi18 applied mechanical milling in Sn using 2 wt% of graphite as PCA in a mill similar to the one used in the present work. Upon 16 h of milling, they did not observe any significant reduction in average crystallite sizes. In this work, in 16 h of milling, we have observed a reduction of around 75%, as shown in Fig. 3. Therefore, the nature of the PCA may be an important variable to the crystallite reduction efficiency.
The obtained microstrains for all milling times were less than 1.0% with fluctuation at about 0.3%. This result is not a surprise, once Sn is notoriously ductile. For example, Hotta et al., Reference Hotta, Matsumoto, Murakami, Narushima and Ouchi27 in a study about dynamic and static restoration behaviors of tin and lead, in the ambient temperature range, reported relatively low activation energy of structural restoration, around 50 kJ/mol, which is half the energy of atomic self diffusion. So, in spite of the severe plastic deformations during ball milling, we observe a low microstrain value which can be understood by the successive deformation/restoration processes undergoing during milling. In other words, the energy originated from the collisions is sufficient to deform and to restore the tin structure at the same time.
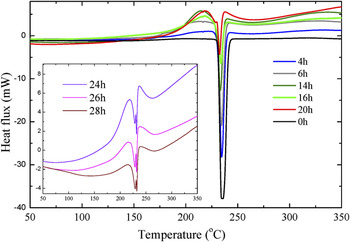
Figure 4 shows some DSC measurements performed with a heating rate of 10 °C/min. The measurement for the precursor powder is indicated as 0 h (black curve), and it shows a practically constant baseline with an endothermic reaction in 235 °C, which corresponds to the complete fusion of the β-Sn crystalline structure. Reference Hansen28
DSC thermograms measured with increase of milling time.

After milling, a wide exothermic band is observed starting approximately at 140 °C and overlapped by β-Sn melting. Owing to these simultaneous exothermic and endothermic processes, the determination of T onset of the β-Sn was affected. However, the difference between the T peak of precursor Sn and that of Sn milled for 28 h was less than 2%. Immediately after the melting of Sn, appears a new exothermic broad band followed by the elevation of the baseline, usually associated with variation in the specific heat. For example, the specific heats of β-Sn, SnO, and SnO2 in the room temperature are 26.943, 50.089, and 64.224 J/mol K, 29 respectively. There exists no data about the amorphous SnO specific heat. Therefore, this pronounced baseline variation after the oxides nucleation may be associated with the existence of these new phases.
After 16 h of milling, a second endothermic peak around 229 °C was observed whose resolution increases after 20 h of milling and it enhances with larger milling times, until the amplitude of the nanocrystalline Sn melting point is reached, as shown in the inset of Fig. 4. Part of the explanation may be found in Sn–Al phase diagram. Reference Hansen28 Once aluminum pans were used in DSC measurements, there is a eutectic reaction in 228 °C for a compound with 97.6 wt% of Sn and Al, which explains the observed phenomenon. However, this reaction is only noticeable in the thermogram when the mean crystallite size is smaller than 60 nm, indicating that the surface energy plays an important role in the activation process of such reaction.
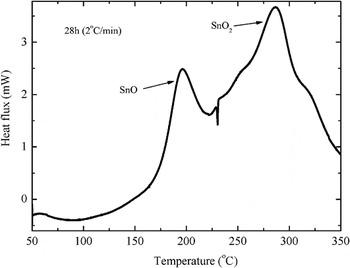
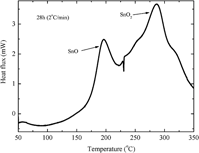
To investigate the exothermic processes, DSC measurement was performed at a reduced rate, 2 °C/min. The result is shown in Fig. 5. Now it is possible to distinguish clearly the two processes separated by the nanocrystalline β-Sn melting: the first one around 196 °C and the second one at 287 °C. Based on these features, two heat treatments were carried out under the same conditions in the sample milled for 28 h. The first annealing was performed at 240 °C and the second at 350 °C, both for 20 min.
DSC thermogram of the sample milled for 28 h at a rate of 2 °C/min. The exothermic peak at 196 °C has been associated with nucleation of tetragonal crystals of SnO. The exothermic peak at 287 °C corresponds to SnO2 tetragonal phase.

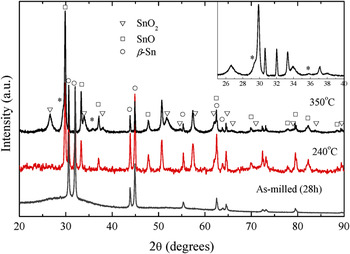
In Fig. 6, the XRD patterns for the annealed samples at 240 °C (red curve) and 350 °C (black curve) are shown together with the 28 h as-milled sample (gray curve). The peaks appeared at 240 °C have been associated with tetragonal crystals of SnO, space group P4/nmm (ICSD: 26,597). Once the heat treatment was hermetic, the appearance of these crystals is explained by the crystallization of the amorphous phase present in the sample.
XRD patterns measured for the annealed samples at 240 and 350 °C and the 28 h as-milled sample.

After the second annealing, new and enlarged peaks were observed. These peaks correspond to two new phases: the SnO2 tetragonal phase and an indeterminate phase, indicated by asterisks.
Legendre et al. Reference Legendre, Poissonnet and Bonnaillie30 produced SnO2 tetragonal phase powders with crystallite size smaller than 10 nm, at room temperature by reactive milling of metallic tin (Sn) powder under pure oxygen medium in a vertical planetary ball-mill. The authors have concluded that the significant agglomeration level of the powder attenuates the benefits of the decrease of the crystallite size and they suggest the addition of a PCA in the mill to work around this problem.
Some authors have reported the nucleation of a high pressure SnO2 orthorhombic phase in monoxide Sn when mechanically milled and heat treated at 575 °C. Reference Lamelas31 Also, the mechanochemical processing of SnCl2 and Na2CO3 resulted in the formation of nanocrystalline SnO during milling and oxidized to SnO2 after heat treatment at 700 °C in an air atmosphere. Reference Cukrov, Tsuzuki and McCormick32 However, none of the high pressure phases of SnO2 (Pnnm, Pbcn, Pa-3, Pbcn, Fm-3m, and Pnam) Reference Gracia, Beltrán and Andrés33 could be successfully indexed to the unknown phase present in the sample milled for 28 h and heat treated at 350 °C.
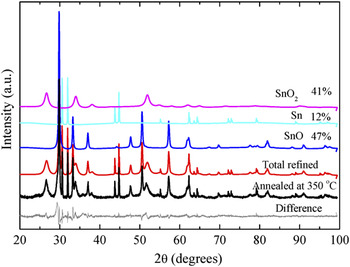
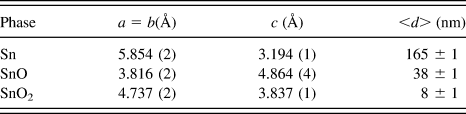
Figure 7 shows the x-ray pattern for the sample annealed at 350 °C, the total Rietveld refinement (red curve), and its deconvolution for 12 wt% of Sn, SnO 47 wt%, and 41 wt% of SnO2 phases. This deconvolution makes evident the presence of different degrees of crystallinity between the phases. While the β-Sn phase has narrow peaks, the peaks of SnO2 are considerably broadened. The calculated mean crystallite size for SnO2 phase is about 8 nm. The crystallographic parameters obtained are shown in Table I.
XRD pattern for the sample annealed at 350 °C, total Rietveld refinement, and the deconvolutions of Sn, SnO, and SnO2 phases.

Crystallographic parameters obtained by Rietveld refinement for the sample milled for 28 h and annealed at 350 °C.

IV. CONCLUSION
In this paper, we have shown the possibility of obtaining tin oxides (SnO and SnO2) from the milling of tin powder with stearic acid, followed by annealing at specific temperatures.
The high-energy ball milling process of tin with stearic acid is found to be an effective way to obtain the nanostructured β-Sn. Due to the presence of oxygen in the PCA, the milling process has gradually produced an amorphous Sn oxide phase. Based on the DSC measurements, two heat treatments have been performed. The annealing at 240 °C has confirmed the presence of the amorphous phase that crystallized in nanostructured tetragonal SnO phase. The annealing at 350 °C has revealed the nucleation of nanostructured tetragonal SnO2 phase.
ACKNOWLEDGMENTS
This research was financially supported by the Brazilian agency CNPq. We are also indebted to Dr. P. Chaudhuri for careful reading of the manuscript.