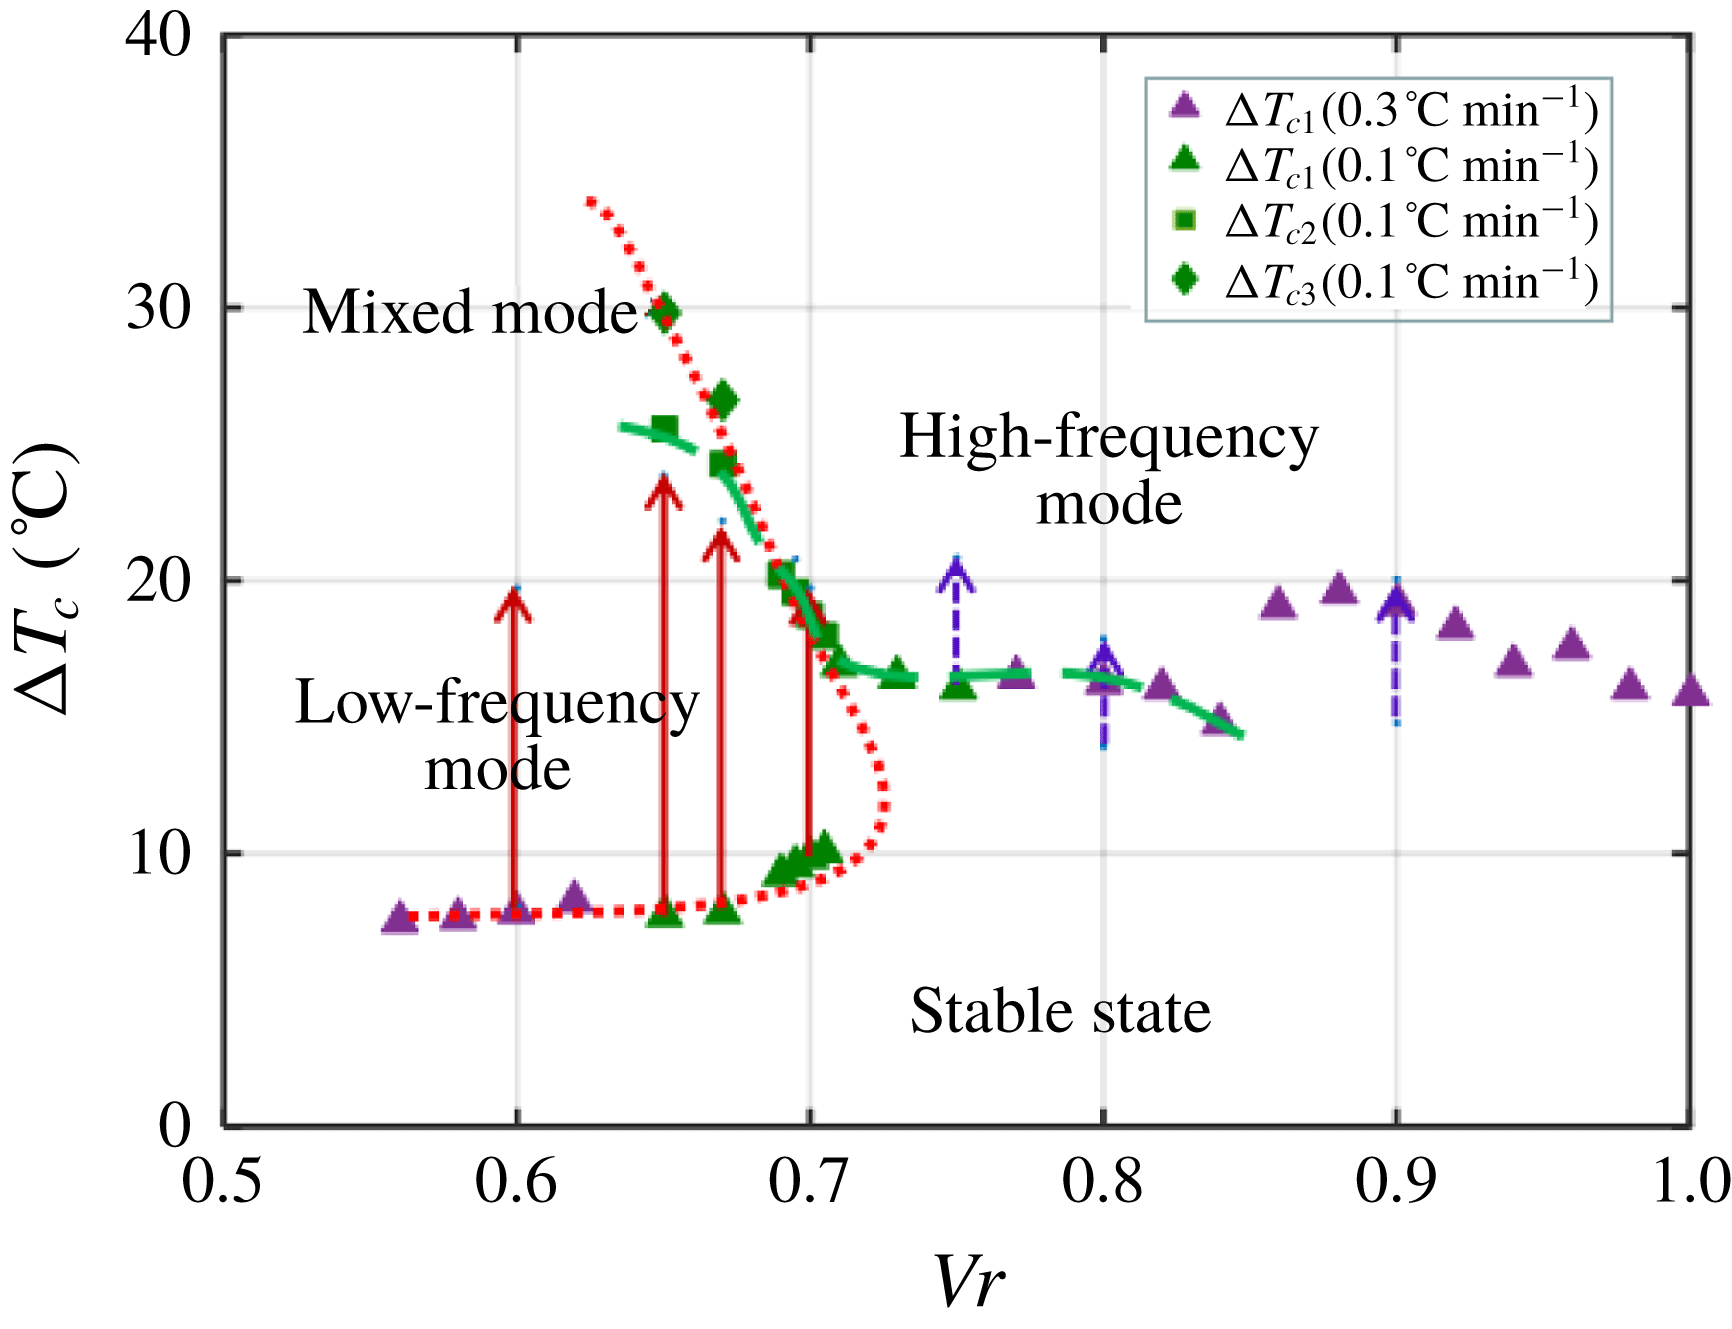
’ type curve. Based on this, we discuss the influence of heating rate on the oscillation mode. It is found that the heating rate affects the selection of critical mode, which results in a jump change of critical temperature difference. The findings of this study are helpful to better understand the critical modes and transition processes of thermocapillary convection in liquid bridges with different configurations.

1 Introduction
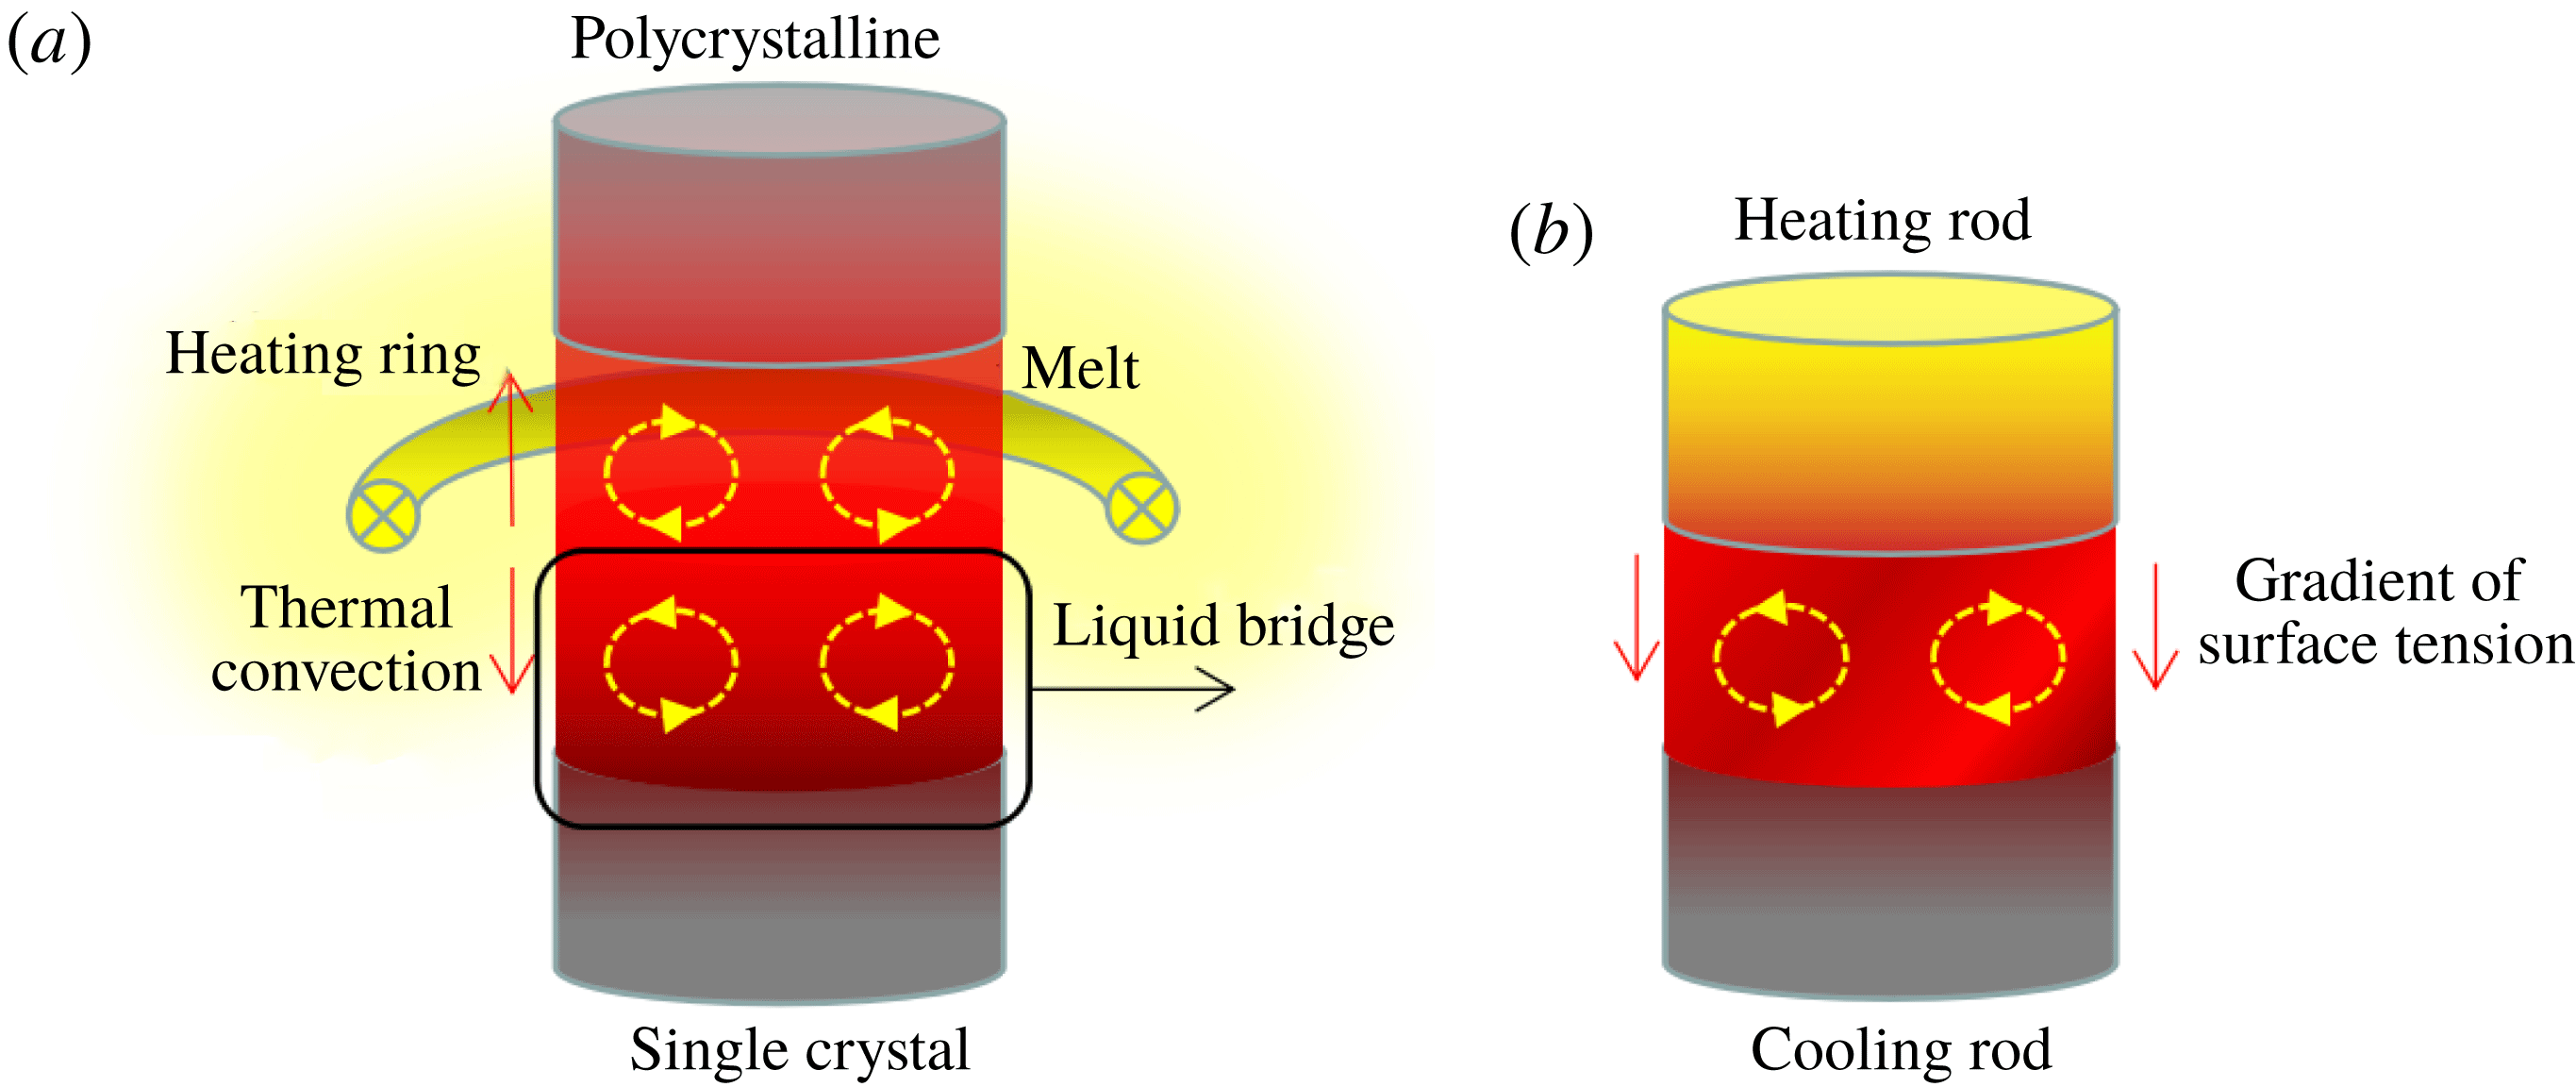
Liquid bridge refers to a section of liquid formed between two solid walls under the action of liquid surface tension. An example of a naturally formed liquid bridge can be found in porous media (Dejam & Hassanzadeh Reference Dejam and Hassanzadeh2011; Mashayekhizadeh et al. Reference Mashayekhizadeh, Kharrat, Ghazanfari and Dejam2012; Dejam, Hassanzadeh & Chen Reference Dejam, Hassanzadeh and Chen2014a ,Reference Dejam, Hassanzadeh and Chen b , Reference Dejam, Hassanzadeh and Chen2015), which is useful in industry, for example, oil recovery. In the single crystal growth of floating-zone method, the melt forms a liquid bridge between polycrystalline and single crystal. With the moving of the floating zone, the melt is directionally solidified and the single crystal is produced. Thermal convections, including buoyant convection and thermocapillary convection, are formed in the bulk of liquid due to temperature gradient. In the small liquid bridge or the liquid bridge under microgravity conditions, thermocapillary convection plays a dominant role. Thermocapillary convection originates from the property that surface tension decreases with the increase of temperature. Therefore, the surface tension drives the surface liquid to move from the hot end to the cold end, so thermocapillary convection forms.
Schwabe et al. (Reference Schwabe, Scharmann, Preisser and Oeder1978) and Chun & Wuest (Reference Chun and Wuest1979) found that thermocapillary flow in the floating-zone liquid bridge transits from steady flow to three-dimensional oscillatory flow when the temperature difference exceeds a certain value. This kind of oscillatory flow was thought to be related with the inhomogeneity in the crystal, i.e. there are striations in the crystal growth because the oscillation can affect the mass transfer. In space laboratories D-1, D-2 and the sounding rocket, the influence of thermocapillary flow on the process of crystal growth by floating-zone method has been studied (Eyer, Leiste & Nitsche Reference Eyer, Leiste and Nitsche1985; Cröll et al. Reference Cröll, Müller-Sebert, Benz and Nitsche1991, Reference Cröll, Tegetmeier, Nagel and Benz1994). Under the microgravity conditions, it has been proved that striations in the crystal growth are caused by oscillatory thermocapillary flow. Therefore, the study on oscillatory thermocapillary flow has great significance in the quality improvement of crystal growth as well as material preparation in space.
Thermocapillary instability from steady flow to oscillatory flow has received wide attention in fundamental research. The half-floating-zone liquid bridge with one rod being heated and another rod being cooled was proposed (see figure 1 b). It is used as a simplified model to study fluid dynamics in the liquid bridge. The melt of semiconductor materials, which is the fluid with a small Prandtl number, is not suitable for the experimental purpose because of its high melting point, easily oxidizing surface and opacity. Usually transparent fluids are used as the flow media in experiments, for example, silicone oil or salt-melt, which are fluids with large Prandtl numbers.
Schematic diagrams of liquid bridges. (a) The floating-zone and (b) half-floating-zone.

The mechanism of thermocapillary oscillation in the fluid with a small Prandtl number is different from that in the fluid with a large Prandtl number. Oscillatory thermocapillary flow in the fluid with a small Prandtl number is the destabilization process driven by the inertia force of flow, and its critical parameter is represented by the Reynolds number. However, oscillatory thermocapillary flow in a fluid with a large Prandtl number is caused by the instability of hydrothermal waves, and its critical parameter is represented by the Marangoni number. The instability of hydrothermal waves was first proposed by Smith & Davis (Reference Smith and Davis1983) in their linear stability analysis of an infinite horizontal liquid layer. Xu & Davis (Reference Xu and Davis1984) applied the instability of hydrothermal waves to the study of thermocapillary convection in the infinite liquid bridge. They assumed the disturbance to be a normal mode, i.e.
 $\exp (\text{i}(\unicode[STIX]{x1D6FC}z+m\unicode[STIX]{x1D703}-\unicode[STIX]{x1D70E}t))$
, where
 $\unicode[STIX]{x1D6FC}$
is the axial wavenumber, m is the azimuthal wavenumber and
 $\unicode[STIX]{x1D70E}$
is the growth rate. The instabilities of different modes, i.e.
 $m=0$
or
 $m=1$
and
 $\unicode[STIX]{x1D6FC}=0$
or
 $\unicode[STIX]{x1D6FC}\neq 0$
, were studied.
The best way to verify hydrothermal waves is to conduct space experiments with a very long liquid bridge, which reduces the deviation from theoretical study that assumes the infinite length of the liquid bridge. Schwabe (Reference Schwabe2005) carried out experimental study on MAXUS4 on thermocapillary convection with a large aspect ratio (
 $Ar=2.5$
), which was close to the Rayleigh limit
 $\unicode[STIX]{x03C0}$
. Hydrothermal waves in oscillatory flow were found in the experiments, and the critical conditions for starting oscillations were consistent with the results by Xu & Davis (Reference Xu and Davis1984) in the analysis of the liquid bridge with infinite length. Ryzhkov (Reference Ryzhkov2011) reanalysed the instability of thermocapillary flow in the liquid bridge with infinite length, and found that there existed a new mode with
 $m=1$
in the liquid bridge with a large Prandtl number. The critical condition of this new mode was closer to the experimental result by Schwabe (Reference Schwabe2005).
The critical conditions of oscillatory thermocapillary convection and the aspect ratio effect in the liquid bridge are the most widely studied issues (Schatz & Neitzel Reference Schatz and Neitzel2001; Hu, Tang & Li Reference Hu, Tang and Li2008). Velten, Schwabe & Scharmann (Reference Velten, Schwabe and Scharmann1991) systematically studied the influence of different aspect ratios in the 24-Alkane (
 $Pr=47$
) liquid bridge, and found that the critical Marangoni number decreased with the increase of aspect ratio Ar. However, Preisser, Schwabe & Scharmann (Reference Preisser, Schwabe and Scharmann1983) found an opposite trend in their ground experiments with the fluid media
 $\text{NaNO}_{3}$
, in which the critical Marangoni number increased with the increase of aspect ratio. The space experimental results with 5 cSt silicone oil as the fluid media given by Albanese et al. (Reference Albanese, Carotenuto, Castagnolo, Ceglia and Monti1995) also indicated that the critical Marangoni number increased with the increase of aspect ratio, from
 $0.8\times 10^{4}$
to
 $2\times 10^{4}$
. Hu & Tang (Reference Hu and Tang2013) carried out ground experiments and studied the aspect ratio effect on liquid bridges with different sizes (diameter
 $D=2$
mm, 3 mm, 4 mm, 5 mm and 6 mm) with 5 cSt and 10 cSt silicone oil as the fluid media, respectively. They found that the critical Marangoni number increased first and then decreased with the increase of aspect ratio.
Recently, a series of experiments named MEIS (2008–2013) were conducted in the ‘KIBO’ cabin on the International Space Station (ISS). The fluid media in these experiments included 5 cSt (
 $Pr=67$
), 10 cSt (
 $Pr=112$
) and 20 cSt (
 $Pr=207$
) silicone oil, the diameters of liquid bridges were 30 mm and 50 mm, and the maximum aspect ratio was 2.5. Nishino et al. (Reference Nishino, Yano, Kawamura, Matsumoto, Ueno and Ermakov2015) reported results of MEIS about the critical Marangoni number for liquid bridges with 5 cSt silicone oil and 20 cSt silicone oil as the media for different aspect ratios. The critical Marangoni number had a peak when
 $Ar=0.89$
, which was consistent with the trend of first increasing and then decreasing found by Hu & Tang (Reference Hu and Tang2013). In addition, it was found that the critical condition for the liquid bridge with 5 cSt silicone oil had a jump change when
 $Ar=1.25{-}1.50$
, and the corresponding jump change in oscillation frequency was more obvious, from 22 mHz to 6.3 mHz. Yano & Nishino (Reference Yano and Nishino2015) also suggested that the jump change was related to the change in heat transfer on the surface. Also, it was found by Nishino et al. (Reference Nishino, Yano, Kawamura, Matsumoto, Ueno and Ermakov2015) that the neutral stability curve given by linear stability analysis was in agreement with the critical condition obtained from the space experiments with 5 cSt silicone oil, but it was needed to set different Bi numbers for the two conditions of
 $Ar<1$
and
 $Ar>1$
. More recently, new space experiments named Dynamic Surf (2013–2016), which aimed to study the dynamic free surface deformation and the interfacial heat transfer, were conducted on board the International Space Station (Yano et al.
Reference Yano, Nishino, Matsumoto, Ueno, Komiya, Kamotani and Imaishi2018).
The shape of the meniscus is another important geometric factor that affects thermocapillary convection. It can be represented by non-dimensional parameters, the volume ratio
 $V/V_{0}$
or the diameter ratio
 $d_{min}/D$
, where
 $d_{min}$
is the necking diameter of the liquid bridge. Hu et al. (Reference Hu, Shu, Zhou and Tang1994) carried out systematic ground experiments about the influence of volume ratio on critical conditions with 10 cSt silicone oil as the fluid media. They proposed that the critical curve was separated into two branches, the branch of the slender liquid bridge (small volume ratio) and the branch of the fat liquid bridge (large volume ratio). The critical Marangoni number of the slender liquid bridge increased with the increase of the volume ratio, and the critical Marangoni number of the fat liquid bridge decreased with the increase of the volume ratio. There was a stable ‘gap’ between these two branches. Chen & Hu (Reference Chen and Hu1998) further proved that two branches of the critical curve existed in liquid bridges with large Pr numbers.
The branches of the critical curve have been verified in many ground experiments, but there are disputes of opinion regarding the gap. Masud, Kamotani & Ostrach (Reference Masud, Kamotani and Ostrach1997) carried out ground experiments at the aspect ratio
 $Ar=0.4{-}0.7$
, with the fluid media being 2 cSt silicone oil (
 $Pr=28{-}29$
). They obtained results similar to those by Hu et al. (Reference Hu, Shu, Zhou and Tang1994), but they suggested that there was not a stable ‘gap’, but a jump change in the critical condition. Xun, Li & Hu (Reference Xun, Li and Hu2010) analysed the influence of volume ratio on critical oscillations through the linear stability method, and suggested that there was an oscillation with
 $m=0$
in the ‘gap’. Sim & Zebib (Reference Sim and Zebib2002) studied thermocapillary oscillations in the liquid bridge with a meniscus (
 $Pr=27$
) through numerical simulations, and found that the volume ratio effect was in agreement with the experimental result when
 $Bi=1$
. Sakurai, Ohishi & Hirata (Reference Sakurai, Ohishi and Hirata2004, Reference Sakurai, Ohishi and Hirata2007a
) and Sakurai, Ohishi & Hirata (Reference Sakurai, Ohishi and Hirata2007b
) studied the volume ratio effect experimentally in the normal gravity environment and in the drop tower, respectively. They came to results in agreement with the opinion of Chen & Hu (Reference Chen and Hu1998) that the ‘gap’ region exists for the fluid with a relative large Pr number, such as 2 cSt and 5 cSt silicone oil, but it does not exist for the fluid with a small Pr number such as 1 cSt and 1.5 cSt silicone oil. They also found that oscillations would occur in the originally stable gap in the microgravity environment.
Most studies considered effects of the aspect ratio Ar and the volume ratio Vr separately on thermocapillary convection. Thermocapillary convection oscillations in cylindrical liquid bridges (
 $Vr=1$
) are more frequently studied in space experiments, such as the experiments carried out on D-2, the ISS and the sounding rocket. Indeed, experiments with various Ar and Vr are needed to assess the geometry effect on the Ar–Vr space. Shevtsova et al. (Reference Shevtsova, Mialdun, Kawamura, Ueno, Nishino and Lappa2011) summarized the ground experiments of five research groups, and reported the results for
 $Vr=0.8$
, 0.9 and 1.0, and
 $Ar=0.64$
, 1.0 and 1.2. Yano & Nishino (Reference Yano and Nishino2015) studied the onset of oscillation at various combinations of volume ratio,
 $Vr=0.6{-}1.1$
, and aspect ratio,
 $Ar=0.5{-}0.65$
. However, the shape of the liquid bridge is limited and the influence of buoyancy cannot be eliminated in ground experiments. Therefore, space experiments are necessary for a better understanding of thermocapillary instability in the liquid bridge under different geometric configurations. Moreover, thermocapillary convection in the liquid bridge has abundant transition processes, but we know little about the geometric effect on the transition process. The study on transitions may improve the understanding of the competition of different modes, especially in the ‘gap’ region.
In order to systematically study thermocapillary convection in the liquid bridge, we have carried out space experiments in the space laboratory on Tiangong-2 (TG-2). Kang’s research team carried out ground experiments for the preparation of space experiments on TG-2, with the height limited to 3–4 mm (Wang et al. Reference Wang, Wu, Duan and Kang2017). The experimental set-up entered the orbit on 15 September 2016 with the spacecraft. Based on the abundant space experiment resources supported by the TG-2 platform, more than 700 space experiments have been finished. The experiments were conducted at different aspect ratios, volume ratios and heating rates. The critical oscillations and transitions under different parameters were carefully analysed.
This paper mainly introduces results of critical oscillatory modes (i.e. low-frequency and high-frequency) and the mode transitions. In § 2, the space experiments are described. In § 3, the geometry effects (including the aspect ratio and the volume ratio) on the condition and mode of critical oscillation at the onset were studied. In § 4, the mode transition from low-frequency mode to high-frequency mode and the heating rate effect on the transition process are investigated.
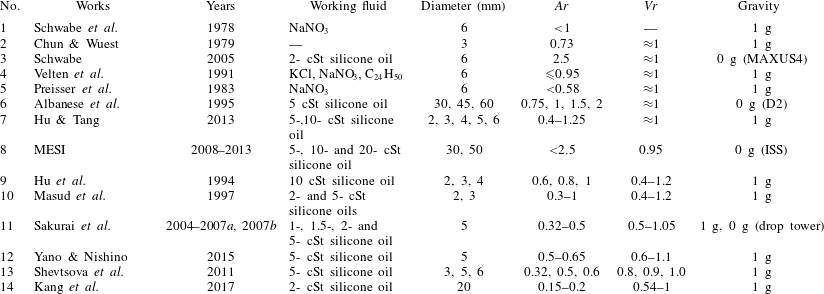
Experimental work on thermocapillary convection in liquid bridges.

2 Space experiments
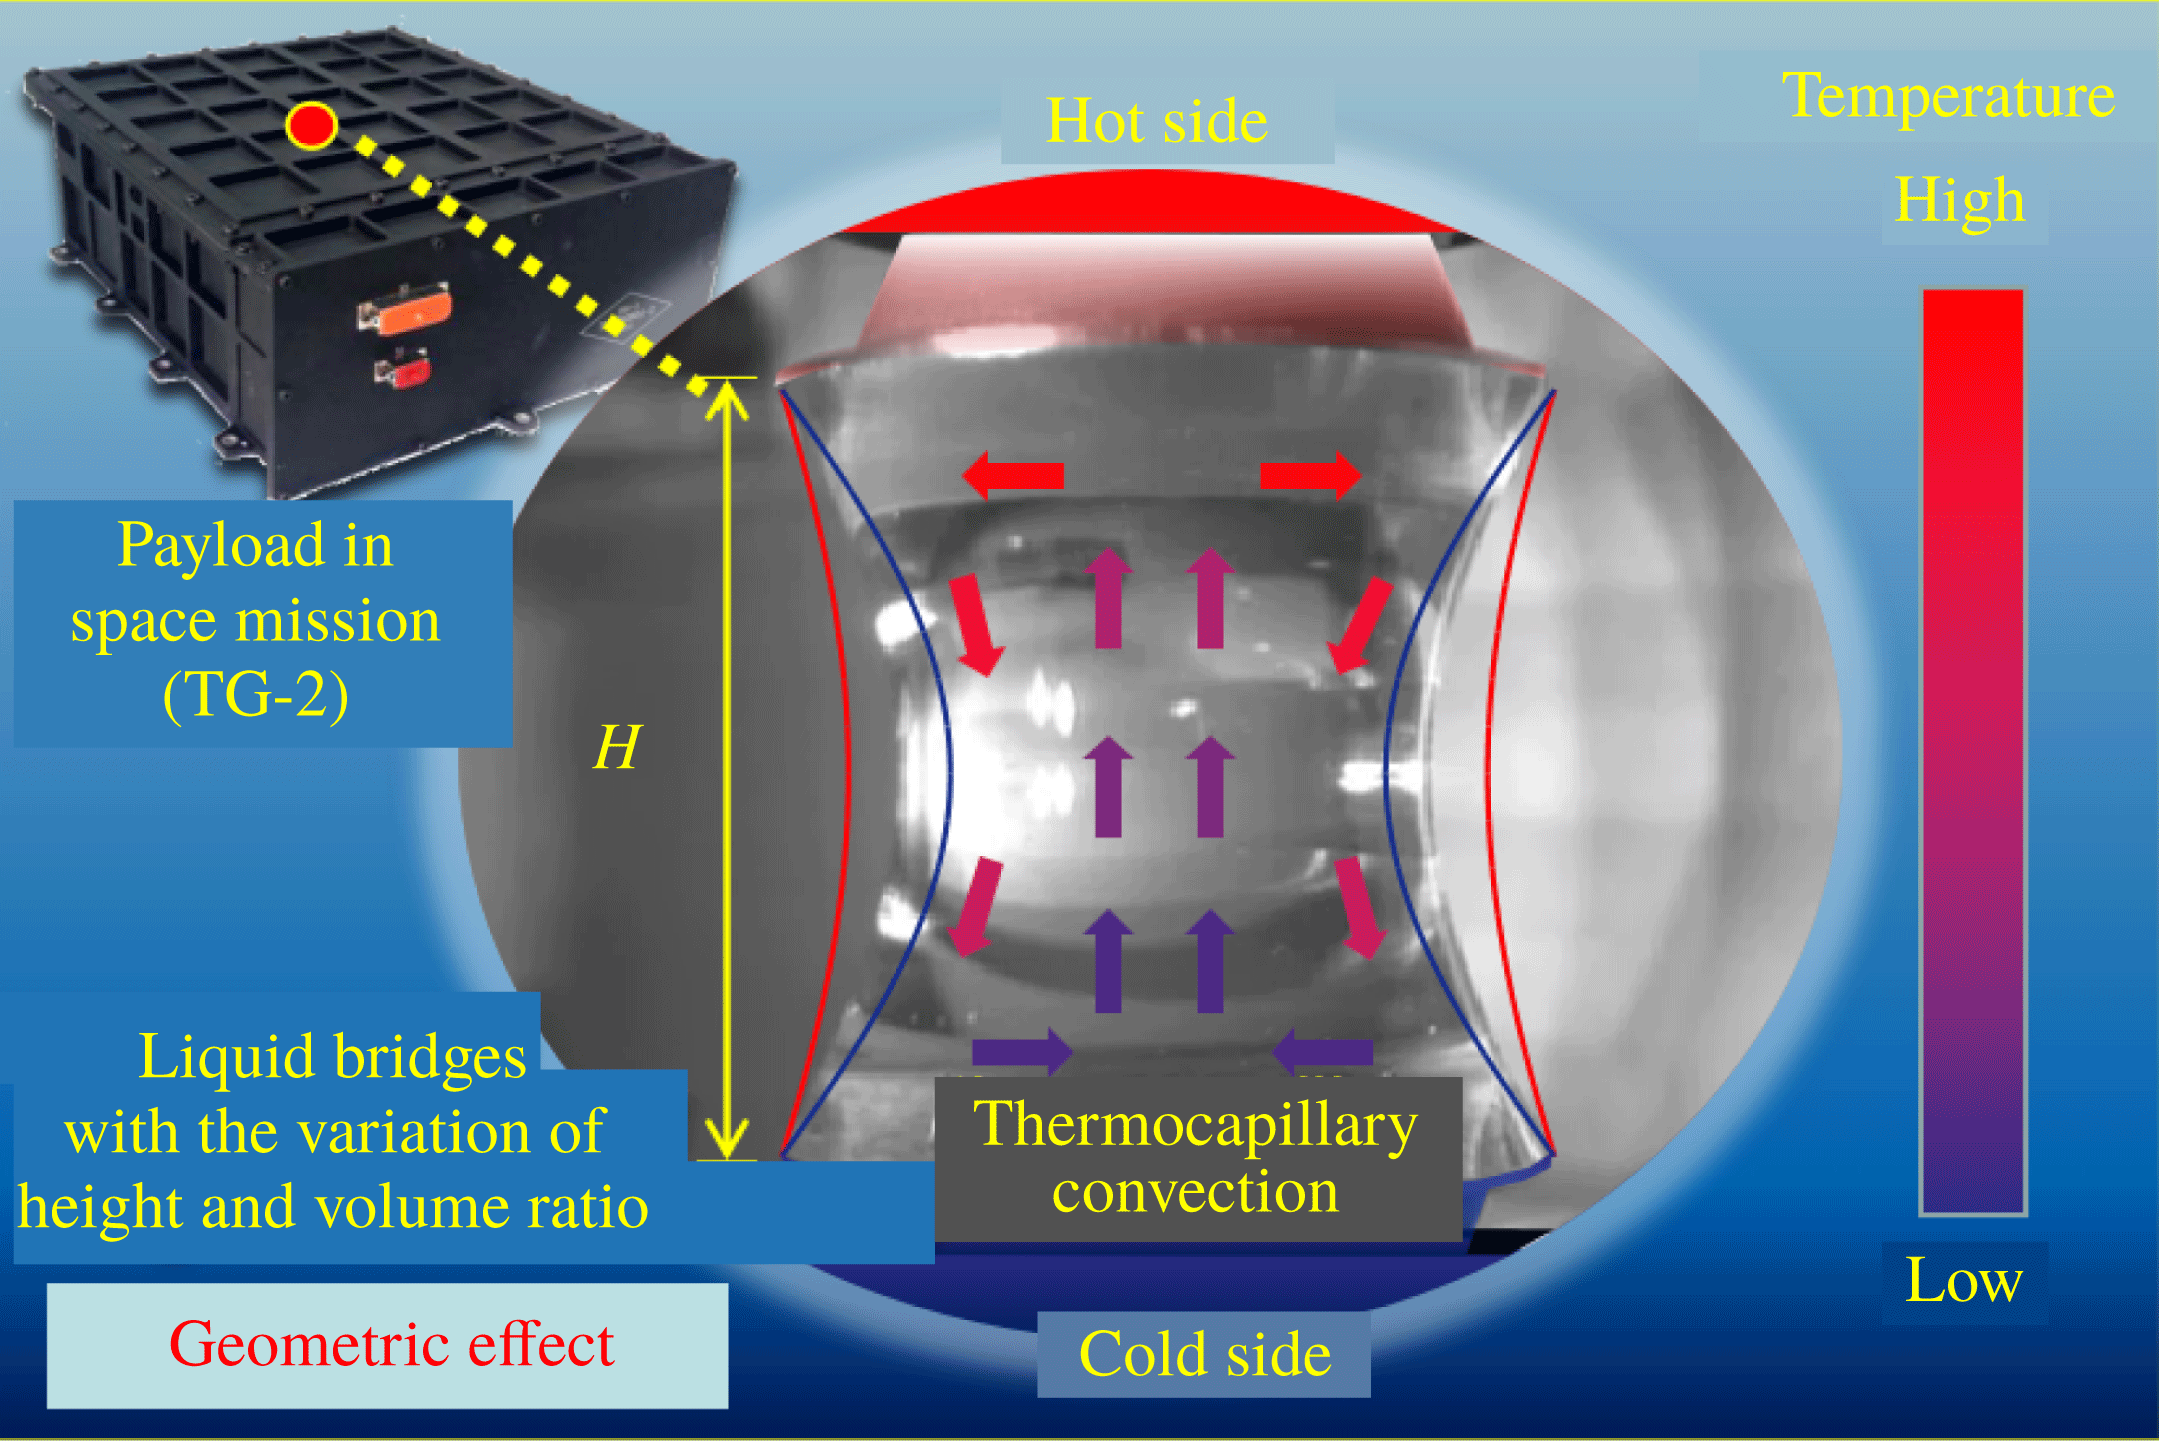
The payload of space experiments on thermocapillary convection in liquid bridges of large Prandtl number is shown in figure 2. This experimental set-up can accurately control the aspect ratio and volume ratio of the liquid bridge, as well as the temperature difference between the upper and lower copper columns to perform experiments on thermocapillary convection.
Experimental payload for studying thermocapillary convection in liquid bridges.

2.1 Geometric parameters
The bridge columns are made up of two coaxial copper cylinders with a diameter of
 $D=20$
mm. The distance of the gap between the two columns (i.e. the height of the liquid bridge H) is accurately controlled by a stepper motor with a moving range of 3–22 mm. The non-dimensional parameter of aspect ratio is defined as
 $Ar=H/D$
, which is used to normalize the height of the liquid bridge. As the aspect ratio is smaller than the Rayleigh limit
 $\unicode[STIX]{x03C0}$
, it is unnecessary to consider the Rayleigh instability which may lead to breakage of the liquid bridge. The liquid is injected from the hole at the centre of the lower column. The liquid injection volume V is accurately controlled by a stepper motor. The fluid in the space experiments is KF96-5 cSt silicone oil produced by Shin-Etsu, Chemical Co. Ltd and its physical properties are listed in table 2. The volume ratio of the liquid bridge is represented as
 $Vr=V/V_{0}$
, where
 $V_{0}$
is the volume of the cylindrical column,
 $\unicode[STIX]{x03C0}HD^{2}/4$
. It is used to characterize the geometry of free surface of the liquid bridge:
 $Vr<1$
or
 $Vr>1$
, which corresponds to the concave meniscus or the convex meniscus, respectively. Only when
 $Vr=1$
, is it the cylindrical liquid bridge that is consistent with liquid bridges in most theoretical and experimental studies.
Physical properties of KF96-5 cSt silicone oil.

When the aspect ratio Ar is fixed, the volume ratio Vr corresponds to a certain shape of free surface. The static free surface geometry is described by Laplace–Young equation as follows:
 $$\begin{eqnarray}\unicode[STIX]{x1D70E}\left\{\frac{z^{\prime \prime }}{[1+(z^{\prime })^{2}]^{3/2}}+\frac{z^{\prime }}{r[1+(z^{\prime })^{2}]^{1/2}}\right\}=\unicode[STIX]{x0394}p_{0}\end{eqnarray}$$
or
 $$\begin{eqnarray}\unicode[STIX]{x1D70E}\left\{\frac{r^{\prime \prime }}{[1+(r^{\prime })^{2}]^{3/2}}-\frac{r^{\prime }}{r[1+(r^{\prime })^{2}]^{1/2}}\right\}=-\unicode[STIX]{x0394}p_{0},\end{eqnarray}$$
where
 $z^{\prime \prime }$
and
 $z^{\prime }$
represent
 $\text{d}^{2}z/\text{d}r^{2}$
and
 $\text{d}z/\text{d}r$
, respectively;
 $r^{\prime \prime }$
and
 $r^{\prime }$
represent
 $\text{d}^{2}r/\text{d}z^{2}$
and
 $\text{d}r/\text{d}z$
, respectively.
Because of symmetry, a simplified model of one-quarter of a liquid bridge is established to calculate the configuration of the free surface. The boundary conditions can be determined by the position of the contact line and the value of contact angle:
 $$\begin{eqnarray}\displaystyle & \displaystyle r|_{z=H/2}=D/2\quad \text{(the position of contact line)}, & \displaystyle\end{eqnarray}$$
 $$\begin{eqnarray}\displaystyle & \displaystyle \left.\frac{\text{d}z}{\text{d}r}\right|_{r=D/2}=\tan \unicode[STIX]{x1D703}\quad \text{(the contact angle)}, & \displaystyle\end{eqnarray}$$
 $$\begin{eqnarray}\displaystyle & \displaystyle \left.\frac{\text{d}r}{\text{d}z}\right|_{z=0}=0\quad \text{(geometric symmetry)}. & \displaystyle\end{eqnarray}$$
The parameter
 $\unicode[STIX]{x0394}p_{0}$
is adjusted to make the free surface satisfy boundary conditions. So the shape of the meniscus
 $r(z)$
is determined by the contact angle
 $\unicode[STIX]{x1D703}$
. The volume ratio of the liquid bridge can be obtained by the integral
 $$\begin{eqnarray}Vr=2\int _{0}^{H}r(z)\,\text{d}z/D.\end{eqnarray}$$
The details of solving the shape of a liquid bridge can be found in the work done by Dejam et al. (Reference Dejam, Hassanzadeh and Chen2014a ,Reference Dejam, Hassanzadeh and Chen b ).
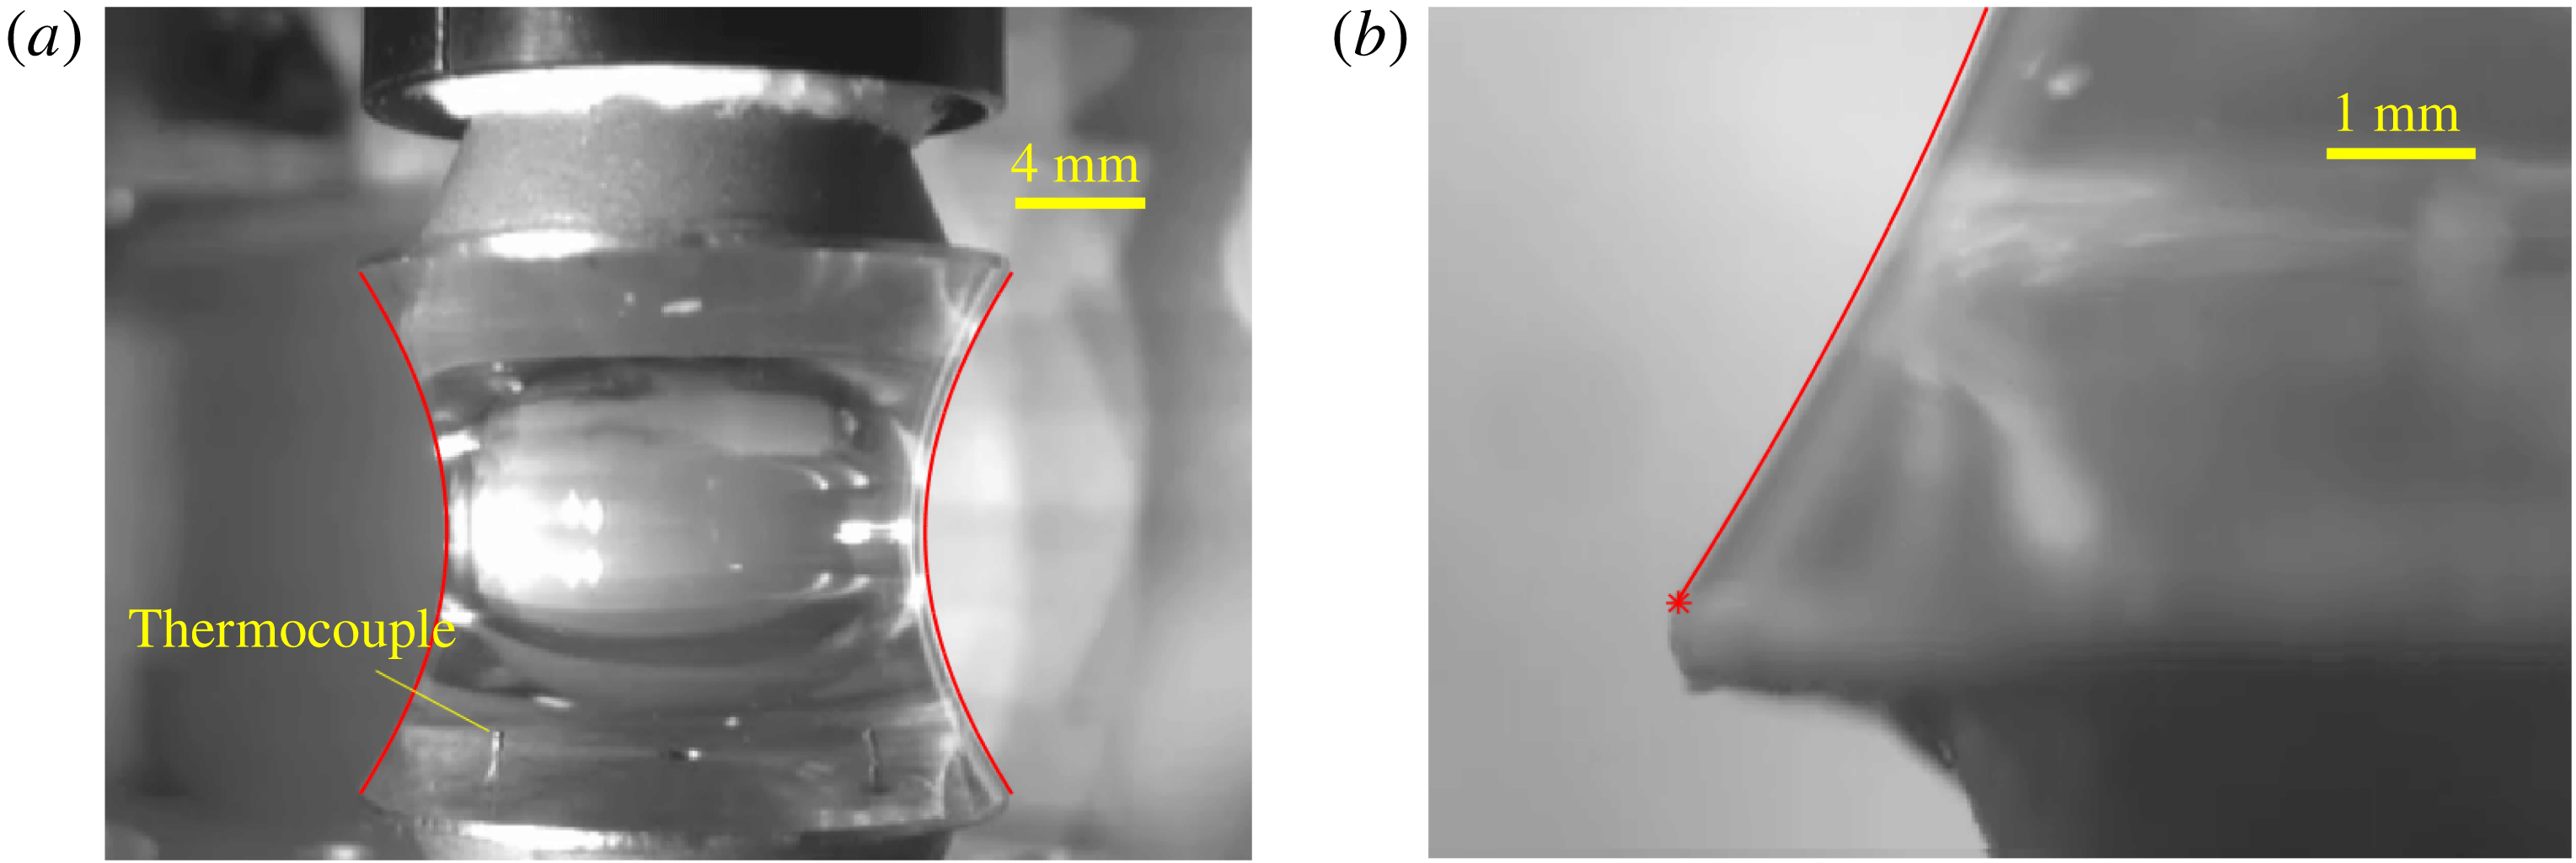
Two CCD cameras are installed in the experimental device of the liquid bridge for capturing the panoramic image and the close shot image near the contact angle, respectively. By comparison between the practical free surface shape of the liquid bridge according to the CCD image in the experiment and the numerical solution of Young–Laplace equation (the red curve), the volume ratio of the liquid bridge can be determined. Figure 3 shows the space experiment images and the numerical solution with the aspect ratio
 $Ar=0.8$
(
 $H=16~\text{mm}$
) and the volume ratio
 $Vr=0.69$
. Figure 3(a) is the panoramic image of the liquid bridge, and the free surface shape is very consistent with the numerical meniscus. Figure 3(b) is the close shot image near the contact angle, and the practical contact angle is also very consistent with the calculated contact angle. Theoretically, the free surface shape and the volume ratio can be completely determined by the contact angle. Therefore, by matching the numerical solution of the Young–Laplace equation and the experimental images, we can finally determine the volume ratio of the liquid bridge in the space experiments.
The CCD images of a liquid bridge and the numerical solution of the free surface. (a) The panoramic image and (b) the close shot image.

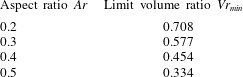
What needs to be particularly mentioned is that the contact line shrink is not considered in this study. With the decrease of the volume ratio, the contact angle decreases gradually. When the contact angle is
 $0^{\circ }$
, the corresponding volume ratio is the limit value
 $Vr_{min}$
, as shown in table 3. The contact angle between the silicone oil and the flat copper surface is approximately
 $0^{\circ }$
. Therefore, if the liquid volume is continuously reduced until
 $Vr<Vr_{min}$
, then contact line shrink will occur. This phenomenon will cause a decrease in the effective diameter of the liquid bridge, and it is not included in the discussions in this paper. In addition, contact line shrink only occurs in the short liquid bridge, because in the tall liquid bridge the broken bridge occurs before the contact angle reaches
 $0^{\circ }$
.
The limit volume ratios corresponding to different aspect ratios.

2.2 Thermocapillary flow
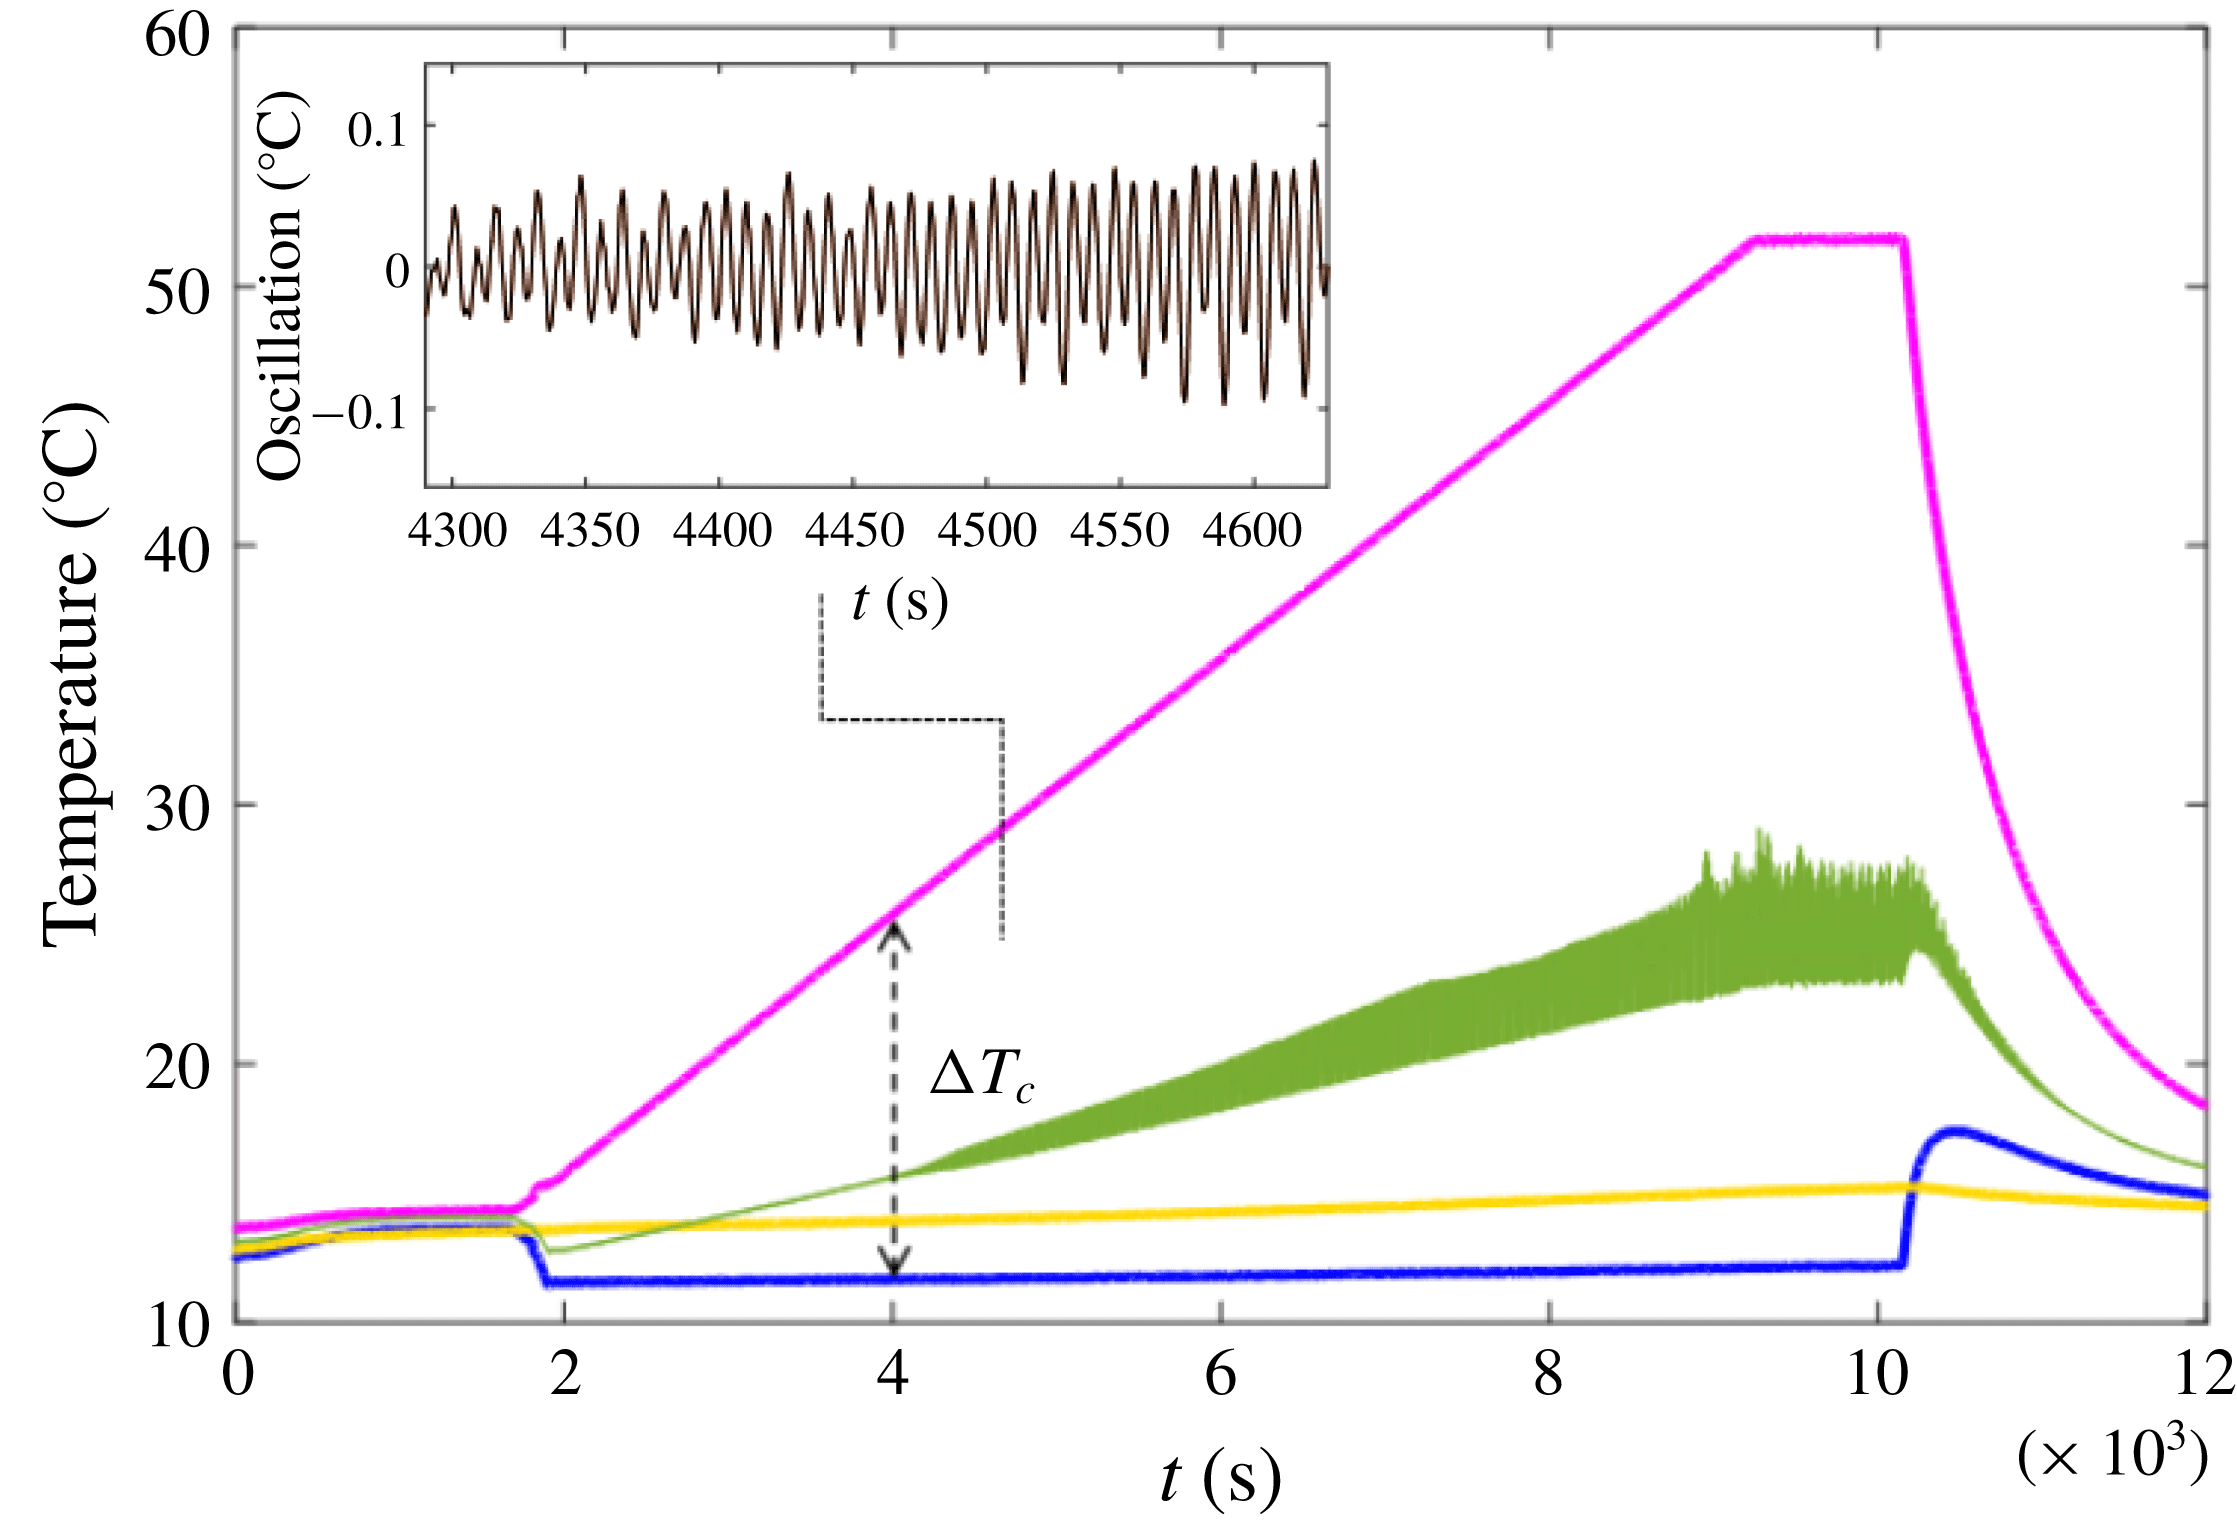
Liquid bridges with certain aspect ratios and volume ratios are established, and the temperatures on the upper and lower columns are controlled to establish the temperature gradient in the liquid bridge. The upper column is heated, as the hot end, by an electrothermal film, and the lower column is cooled, as the cold end, by Peltier elements. The temperature curve controlled by a PID is shown in figure 4. The temperature on the lower column is maintained at
 $T_{0}-1\,^{\circ }\text{C}$
, where
 $T_{0}$
is the environment temperature. The temperature on the upper column is linearly increased to the target value
 $T_{0}+\unicode[STIX]{x0394}T_{aim}-1$
at a slow heating rate. The maximum temperature difference that can be realized is
 $55\,^{\circ }\text{C}$
. The heating rate
 $Tv$
is 0.1–
 $2.0\,^{\circ }\text{C}~\text{min}^{-1}$
under control, and it is set to
 $0.3\,^{\circ }\text{C}~\text{min}^{-1}$
by default to ensure that the flow field in the liquid bridge is in a quasi-equilibrium state. When the target temperature is reached, it keeps the temperature difference constant for 5 min at
 $\unicode[STIX]{x0394}T_{aim}$
until the end of the experiment, or linearly decreases the temperature at the same rate for the study of thermocapillary convection oscillations during the cooling process.
The experimental data is a set of temperatures at five points in the fluid measured by thermocouples with high sensitivity. The filament diameter of thermocouples is 0.08 mm. They stick out from the holes on the lower column, in a distance of 2 mm to the surface of the lower column. The temperatures can reflect the transition process of thermocapillary convection from steady state to oscillatory state. When the temperature difference is small, thermocapillary convection in the liquid bridge is at a steady state. With the increase of temperature difference, thermocapillary flow intensifies and starts to be unsteady, then the steady flow transits into three-dimensional unsteady flow. At this time, the measured temperatures transfer from stationary state to oscillatory state.
Figure 4 shows the experimental results, where the pink line represents the temperatures at the hot end, the blue line represents the temperatures at the cold end, the yellow dashed line shows the ambient temperatures, and the green line gives the temperatures at a point in the fluid. The critical temperature difference for the transition of fluid temperature from stationary state to oscillatory state is
 $\unicode[STIX]{x0394}T_{c1}$
. As shown in figure 4,
 $\unicode[STIX]{x0394}T_{c1}$
is
 $11.5\,^{\circ }\text{C}$
. When
 $\unicode[STIX]{x0394}T>\unicode[STIX]{x0394}T_{c1}$
, thermocapillary convection is in the state of oscillatory flow. As the temperature difference is further increased, the flow pattern will transit many times. These transition points are defined in turn as the second critical temperature difference
 $\unicode[STIX]{x0394}T_{c2}$
, the third critical temperature difference
 $\unicode[STIX]{x0394}T_{c3}$
, and so on. Similarly, during the cooling process, the critical temperature difference at each transition point is marked in turn from beginning to end as
 $\unicode[STIX]{x0394}T_{c1}^{\ast }$
,
 $\unicode[STIX]{x0394}T_{c2}^{\ast }$
,
 $\unicode[STIX]{x0394}T_{c3}^{\ast }$
, and so on. Then we study the influencing laws of the geometric parameters (aspect ratio and volume ratio) and heating conditions.
Temperature data in the experiment on thermocapillary convection (
 $Ar=0.8,Vr=0.69$
).

Compared with the MEIS on the ISS, the experiments on TG-2 have fewer flow visualizations. Due to limitations on the size and weight of our payload, we only used thermocouples to measure temperature oscillations and the CCD camera to record videos. The MEIS on the ISS adopted several measuring techniques including thermocouple, infrared camera, particle image velocimetry, etc. However, TG-2 provides abundant resources of program injections and very quick data download. We can flexibly adjust our research strategy according to recent experimental results. Up until now, after 30 months, more than 700 groups of space experiments have been completed. Therefore, the advantage is that we have collected a large database and conducted very detailed research on the geometric effect and flow transitions. In addition, we have completed another set of space experiments on the scientific satellite SJ-10, in which plenty of measurement methods including thermocouples, infrared camera, displacement sensor and CCD camera were used (Kang et al. Reference Kang, Jiang, Duan, Zhang and Hu2019a ,Reference Kang, Wang, Duan, Su, He, Wu and Hu b ,Reference Kang, Wu, Duan, He, Hu, Duan and Hu c ). The SJ-10 experiments focused on the waves of thermocapillary instability in the annular liquid pool. We can draw lessons from the SJ-10 experiments when analysing the experimental data of TG-2.
2.3 The non-dimensional parameters
Thermocapillary convection in the liquid bridge under the microgravity condition can be described by the Navier–Stokes equation and the heat transfer equation with corresponding boundary conditions. We use
 $\unicode[STIX]{x1D707}/(\unicode[STIX]{x1D70E}_{T}\unicode[STIX]{x2202}T/\unicode[STIX]{x2202}z)$
,
 $\unicode[STIX]{x1D70E}_{T}(\unicode[STIX]{x2202}T/\unicode[STIX]{x2202}z)l/\unicode[STIX]{x1D707}$
,
 $(\unicode[STIX]{x2202}T/\unicode[STIX]{x2202}z)l$
and
 $\unicode[STIX]{x1D70E}_{T}(\unicode[STIX]{x2202}T/\unicode[STIX]{x2202}z)$
as the characteristic time, characteristic velocity, characteristic temperature difference and characteristic pressure to non-dimensionalize the hydrodynamic equation, and get the non-dimensional parameters
 $$\begin{eqnarray}\displaystyle Ma=\frac{\unicode[STIX]{x1D70E}_{T}\unicode[STIX]{x2202}T/\unicode[STIX]{x2202}zl^{2}}{\unicode[STIX]{x1D708}\unicode[STIX]{x1D705}},\quad Pr=\frac{\unicode[STIX]{x1D708}}{\unicode[STIX]{x1D705}},\quad Ca=\frac{\unicode[STIX]{x1D70E}_{T}\unicode[STIX]{x2202}T/\unicode[STIX]{x2202}zl}{\unicode[STIX]{x1D70E}_{0}}\quad \text{and}\quad Bi=\frac{hl}{k}, & & \displaystyle\end{eqnarray}$$
where, Ma is the Marangoni number, Pr is the Prandtl number, Ca is the Capillary number and Bi is the Biot number.
The Marangoni number represents the intensity of thermocapillary convection. Since the oscillation phenomenon is caused by the instability of thermocapillary convection,
 $Ma$
is used as the non-dimensional critical condition. The critical Marangoni number is defined as follows:
 $$\begin{eqnarray}Ma_{c}=\frac{\unicode[STIX]{x1D70E}_{T}\unicode[STIX]{x0394}T_{c}l^{2}}{\overline{\unicode[STIX]{x1D708}}\unicode[STIX]{x1D705}H}.\end{eqnarray}$$
The Marangoni number has different values for different characteristic lengths. The characteristic length is
 $l=H$
in this paper.
In addition, because the viscosity of silicone oil changes greatly with temperature, the mean value of the temperature on the upper bridge (
 $T_{0}-1+\unicode[STIX]{x0394}T$
) and the temperature on the lower bridge (
 $T_{0}-1$
),
 $T_{m}=T_{0}+\unicode[STIX]{x0394}T/2-1$
is used as the average temperature of the flow field, and the fluid viscosity depending on the temperature is provided by the data sheet of Kf-96 silicone oil,
 $$\begin{eqnarray}\log _{10}\unicode[STIX]{x1D708}_{T}=\frac{763.1}{273+T}-2.559+\log _{10}\unicode[STIX]{x1D708}_{25}.\end{eqnarray}$$
When calculating the Bi number, we should know the coefficient of heat transfer h. By taking account of both thermodifussion and thermoradiation, we estimate the heat transfer coefficient of the surface of liquid bridge to be
 $7.40~\text{W}~\text{m}^{-2}~\text{K}^{-1}$
. Therefore, the Bi number, which reflects the heat transfer capability of the free surface, is estimated as 1.2.
The aspect ratio Ar and the volume ratio Vr are non-dimensional parameters that represent the geometry of the liquid bridge. During the heating process, the volume ratio increases slightly due to the thermal expansion of liquid. When the temperature difference is
 $50\,^{\circ }\text{C}$
, the volume ratio has increased 2.6 %.
In order to keep good microgravity conditions, all experiments are carried out after the astronauts have returned to the ground and under the condition of three-axis-stable to the ground. The residual gravity
 $\unicode[STIX]{x0394}g$
is
 $-4{-}4~\text{mg}$
. Then, the dynamic Bond number that indicates the intensity of buoyancy convection as well as thermocapillary force is calculated as
 $$\begin{eqnarray}Bo_{d}=\frac{\unicode[STIX]{x1D70C}\unicode[STIX]{x0394}g\unicode[STIX]{x1D6FD}H^{2}}{|\unicode[STIX]{x1D70E}_{T}|}\approx 0.88.\end{eqnarray}$$
The static Bond number is
 $$\begin{eqnarray}Bo=\frac{\unicode[STIX]{x1D70C}\unicode[STIX]{x0394}gH^{2}}{|\unicode[STIX]{x1D70E}_{0}|}\approx 0.29.\end{eqnarray}$$
3 Critical oscillations
Critical oscillation refers to the initial transition from steady convection to oscillatory convection as the temperature difference reaches a certain threshold. The onset of oscillation and the oscillation mode are affected by the geometry of liquid bridge.
3.1 The aspect ratio effect
The height of the liquid bridge has a great influence on the critical temperature difference for the oscillatory thermocapillary convection. Previous studies on the aspect ratio effect on thermocapillary convection in the liquid bridge are mostly focused on cylindrical liquid bridges (
 $Vr=1$
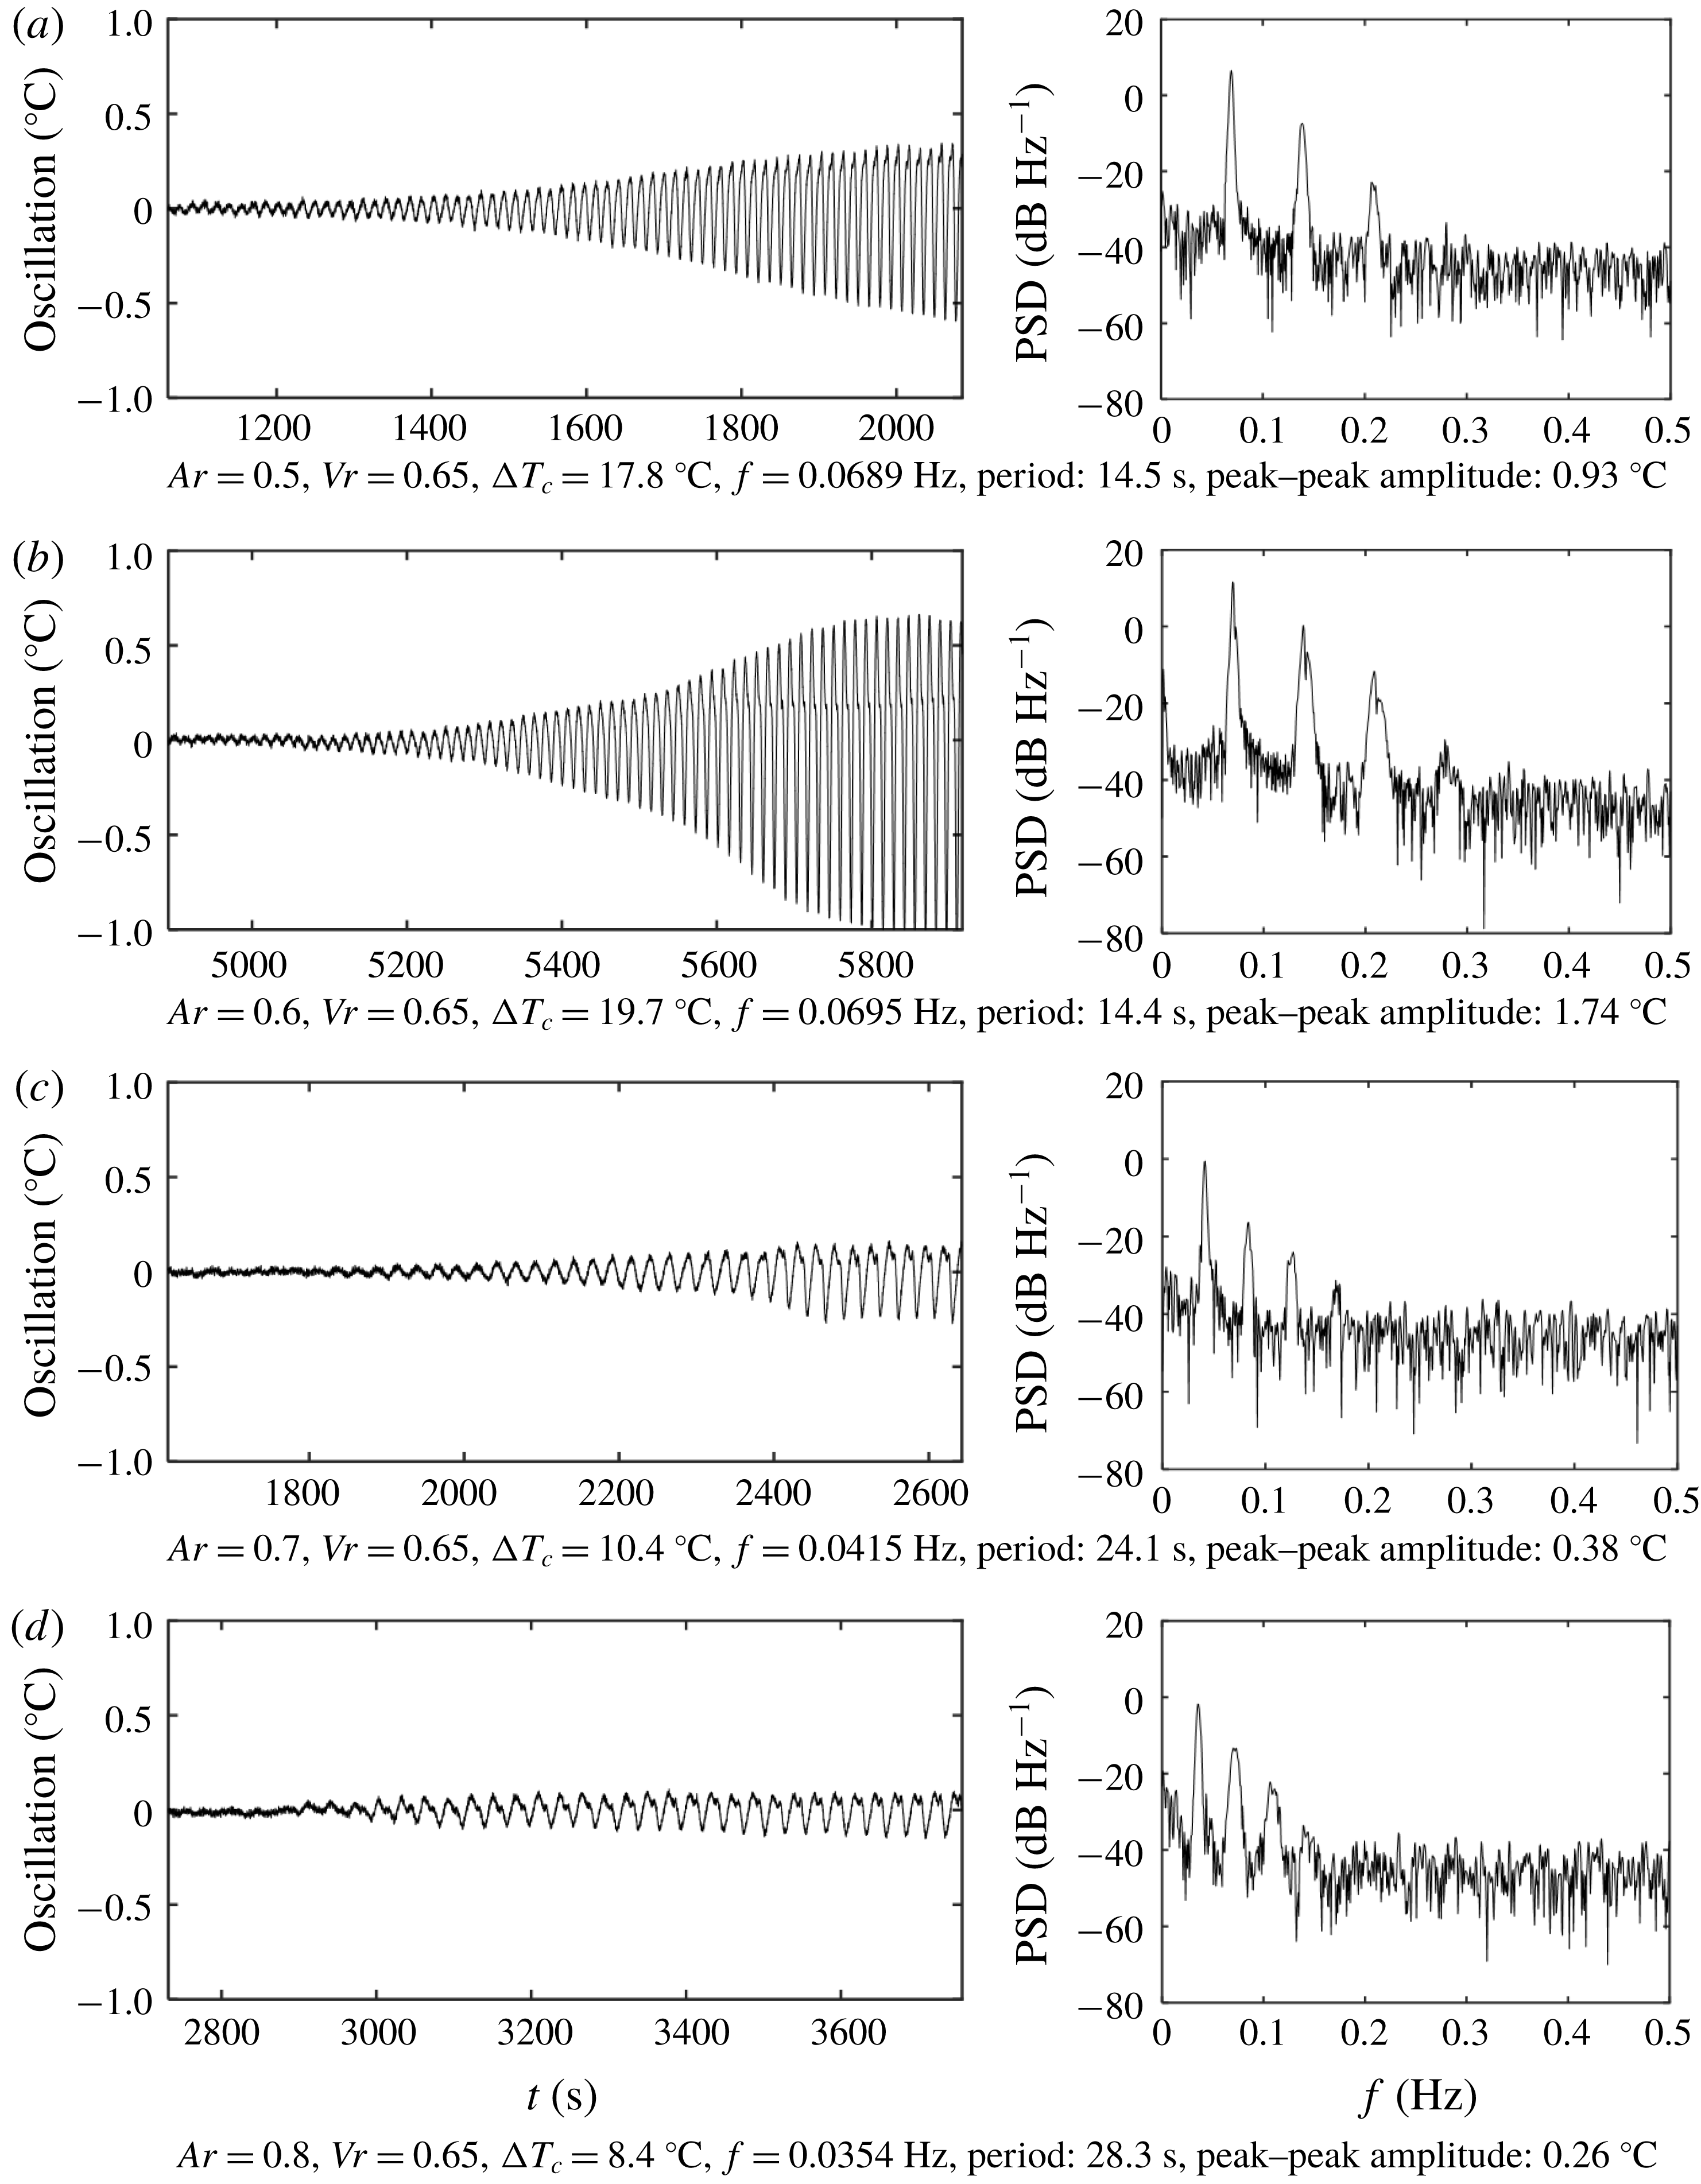
). In this paper, the aspect ratio effect in the liquid bridge with a meniscus is studied. Figure 5 shows the temperature oscillations and corresponding spectra in liquid bridges with
 $Ar=0.5$
, 0.6, 0.7 and 0.8 and
 $Vr=0.65$
. The corresponding critical oscillation parameters are shown in table 4. To research the characteristics of the onset, we pick up the signal within 1000 s time interval at the beginning of the oscillation. The amplitude of oscillation first increases and then saturates, which is consistent with the theory. According to the linear stability, the critical wave is unstable and grows exponentially. While the nonlinear theory tells us that the critical wave will be saturated, which can be modelled as the Landau equation. As the temperature difference increases, the saturated amplitude gradually increases.
Critical oscillations and spectra for different aspect ratios (
 $Vr=0.65$
).

Characteristics of critical oscillations for different aspect ratios.

We found that the critical oscillation with a small aspect ratio and that with a large aspect ratio have significant differences. For example, when
 $Ar=0.5$
and 0.6, thermocapillary convection has characteristics including high onset temperature difference (
 $17.8\,^{\circ }\text{C}$
and
 $19.7\,^{\circ }\text{C}$
), short oscillation period (14.5 s and 14.4 s) and large amplitude. When
 $Ar=0.7$
and 0.8, thermocapillary convection has characteristics including low onset temperature difference (
 $10.4\,^{\circ }\text{C}$
and
 $8.4\,^{\circ }\text{C}$
), long oscillation period (24.1 s and 28.3 s) and small amplitude. The former is called high-frequency oscillation mode, and the latter is called low-frequency oscillation mode.
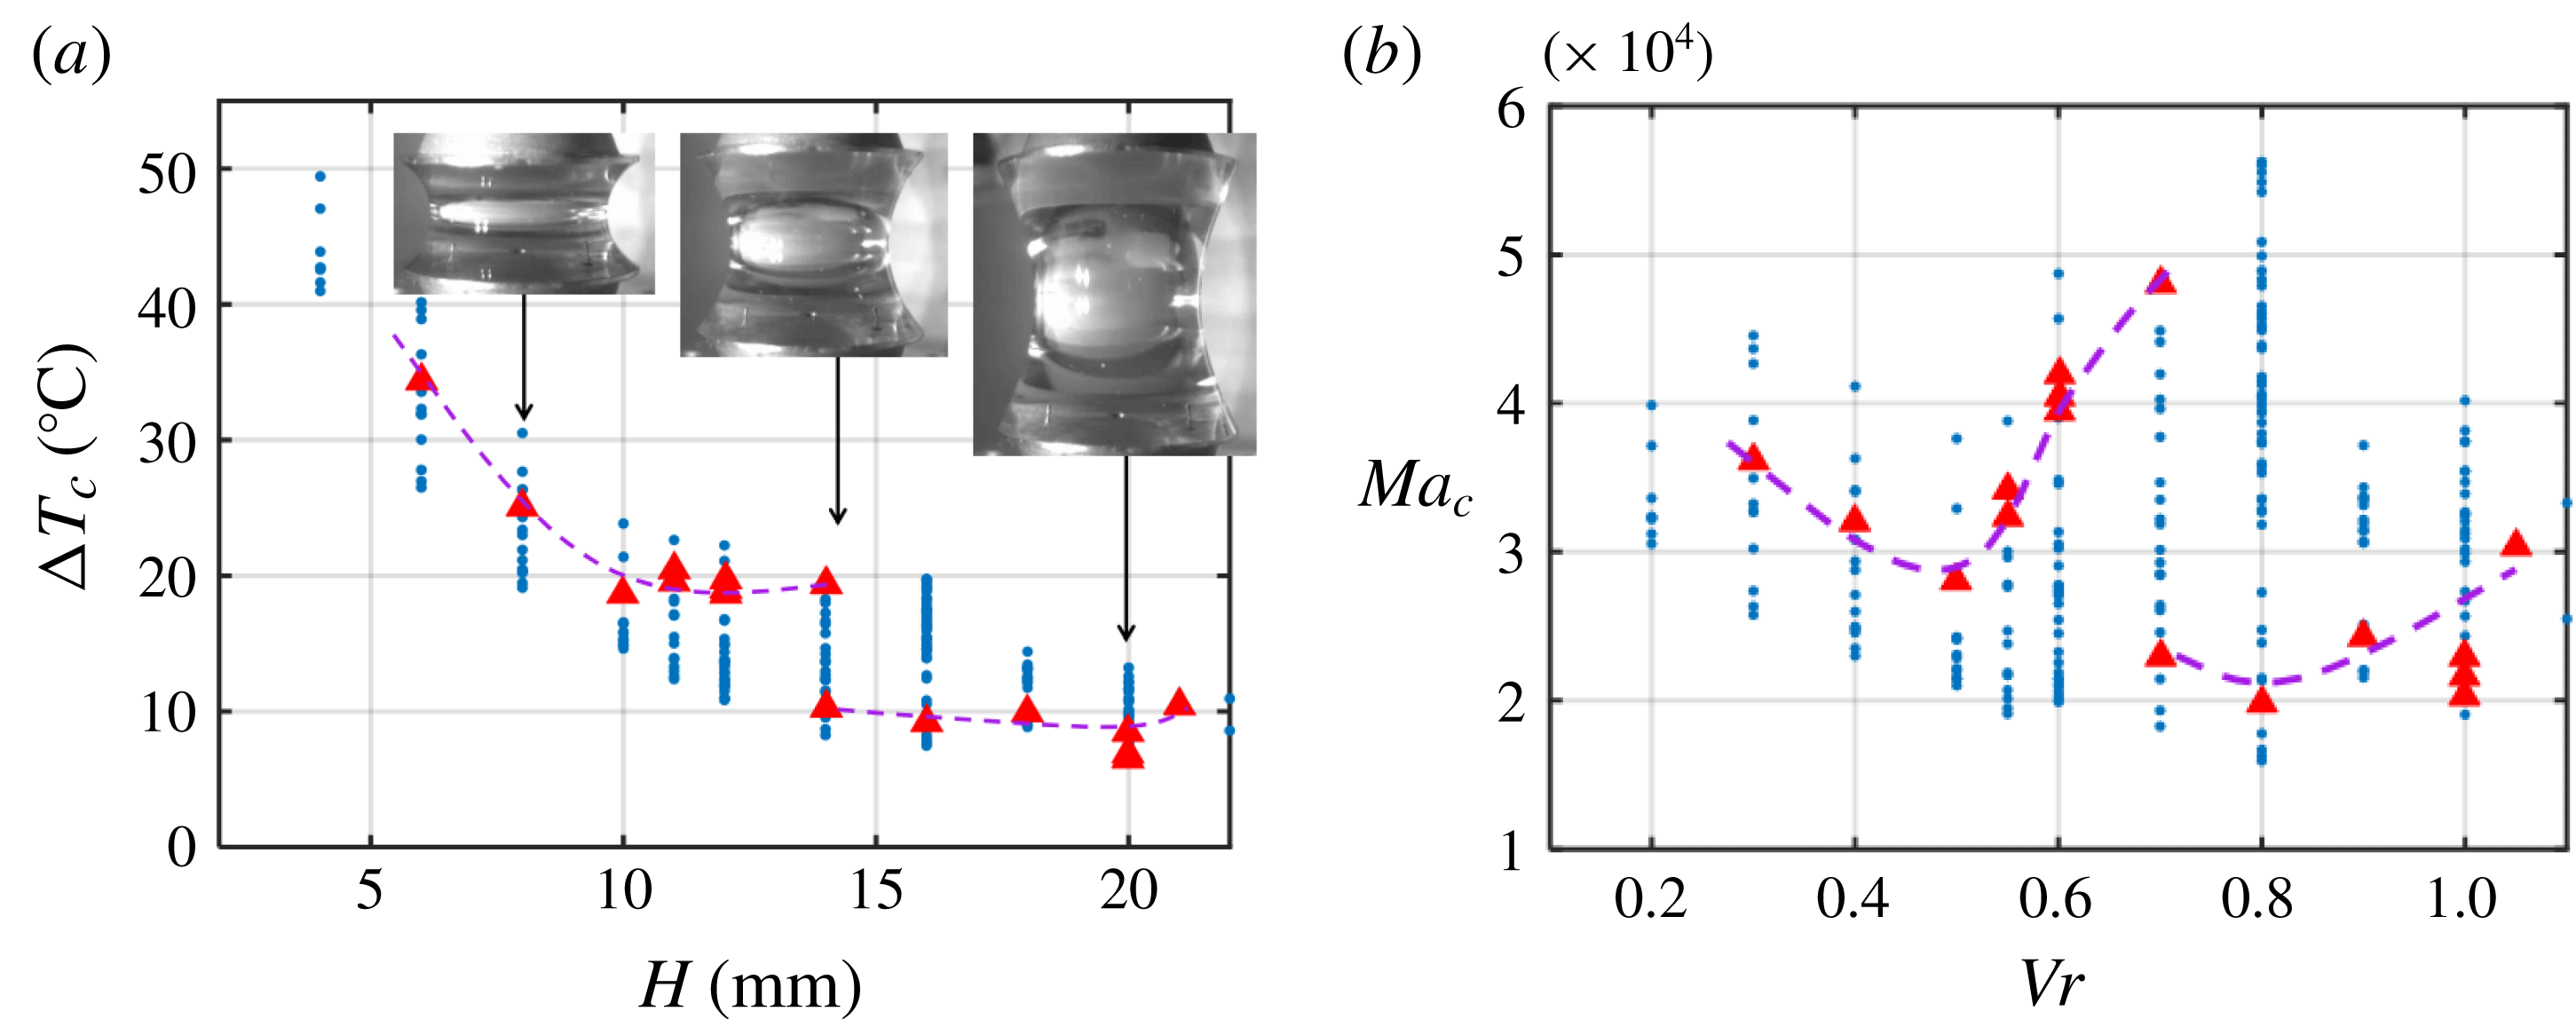
Figure 6(a) shows critical temperature differences of thermocapillary convection in liquid bridges with different heights. As the height of the liquid bridge increases, there is a significant downward trend in the critical temperature difference. When the height increases from 4 to 20 mm, the critical temperature difference decreases from approximately
 $45$
to approximately
 $10\,^{\circ }\text{C}$
. Because there are differences in volume ratios for liquid bridges of the same height, the critical temperature differences in figure 6(a) are discrete. For the liquid bridge with a volume ratio of
 $0.64\leqslant Vr\leqslant 0.66$
, as shown in figure 6 with the marks ▴, the influencing curve of height on the critical temperature difference is separated into two branches of the short and tall bridges, corresponding to high-frequency oscillation mode and low-frequency oscillation mode, respectively. The critical condition has a significant jump change at the separation point,
 $H=14$
mm. Therefore, with the increase of the liquid bridge height, the overall trend of the critical temperature difference is decreasing, and the critical curve is separated into two branches of the short bridge and the tall bridge.
Figure 6(b) shows the relationship between the critical Marangoni number and the aspect ratio. Almost all obtained Marangoni numbers for various aspect ratios are within the range
 $2\times 10^{4}{-}5\times 10^{4}$
. This means that using the dimensionless Marangoni number to characterize the critical oscillation condition of thermocapillary convection is very effective. The aspect ratio has a significant influence on the critical Marangoni number. For liquid bridges with a volume ratio of
 $0.64\leqslant Vr\leqslant 0.66$
, as shown in figure 6 with the marks ▴, the curve showing the change of critical Marangoni number with the aspect ratio is separated into two branches, one of which is for the short bridge (small aspect ratio) and the other is for the tall bridge (large aspect ratio), and the separation point is
 $Ar=0.7$
. In addition, the critical curve of the short bridge decreases first and then increases with the increase of aspect ratio. The values of the critical curve of the tall bridge are obviously lower than that of the short bridge.
The aspect ratio effect on critical conditions of thermocapillary oscillation. (a) The critical temperature difference versus height and (b) critical
 $Ma_{c}$
versus aspect ratio.

3.2 The volume ratio effect
The volume ratio effect means the influence of the volume ratio
 $Vr=V/V_{0}$
(
 $V_{0}$
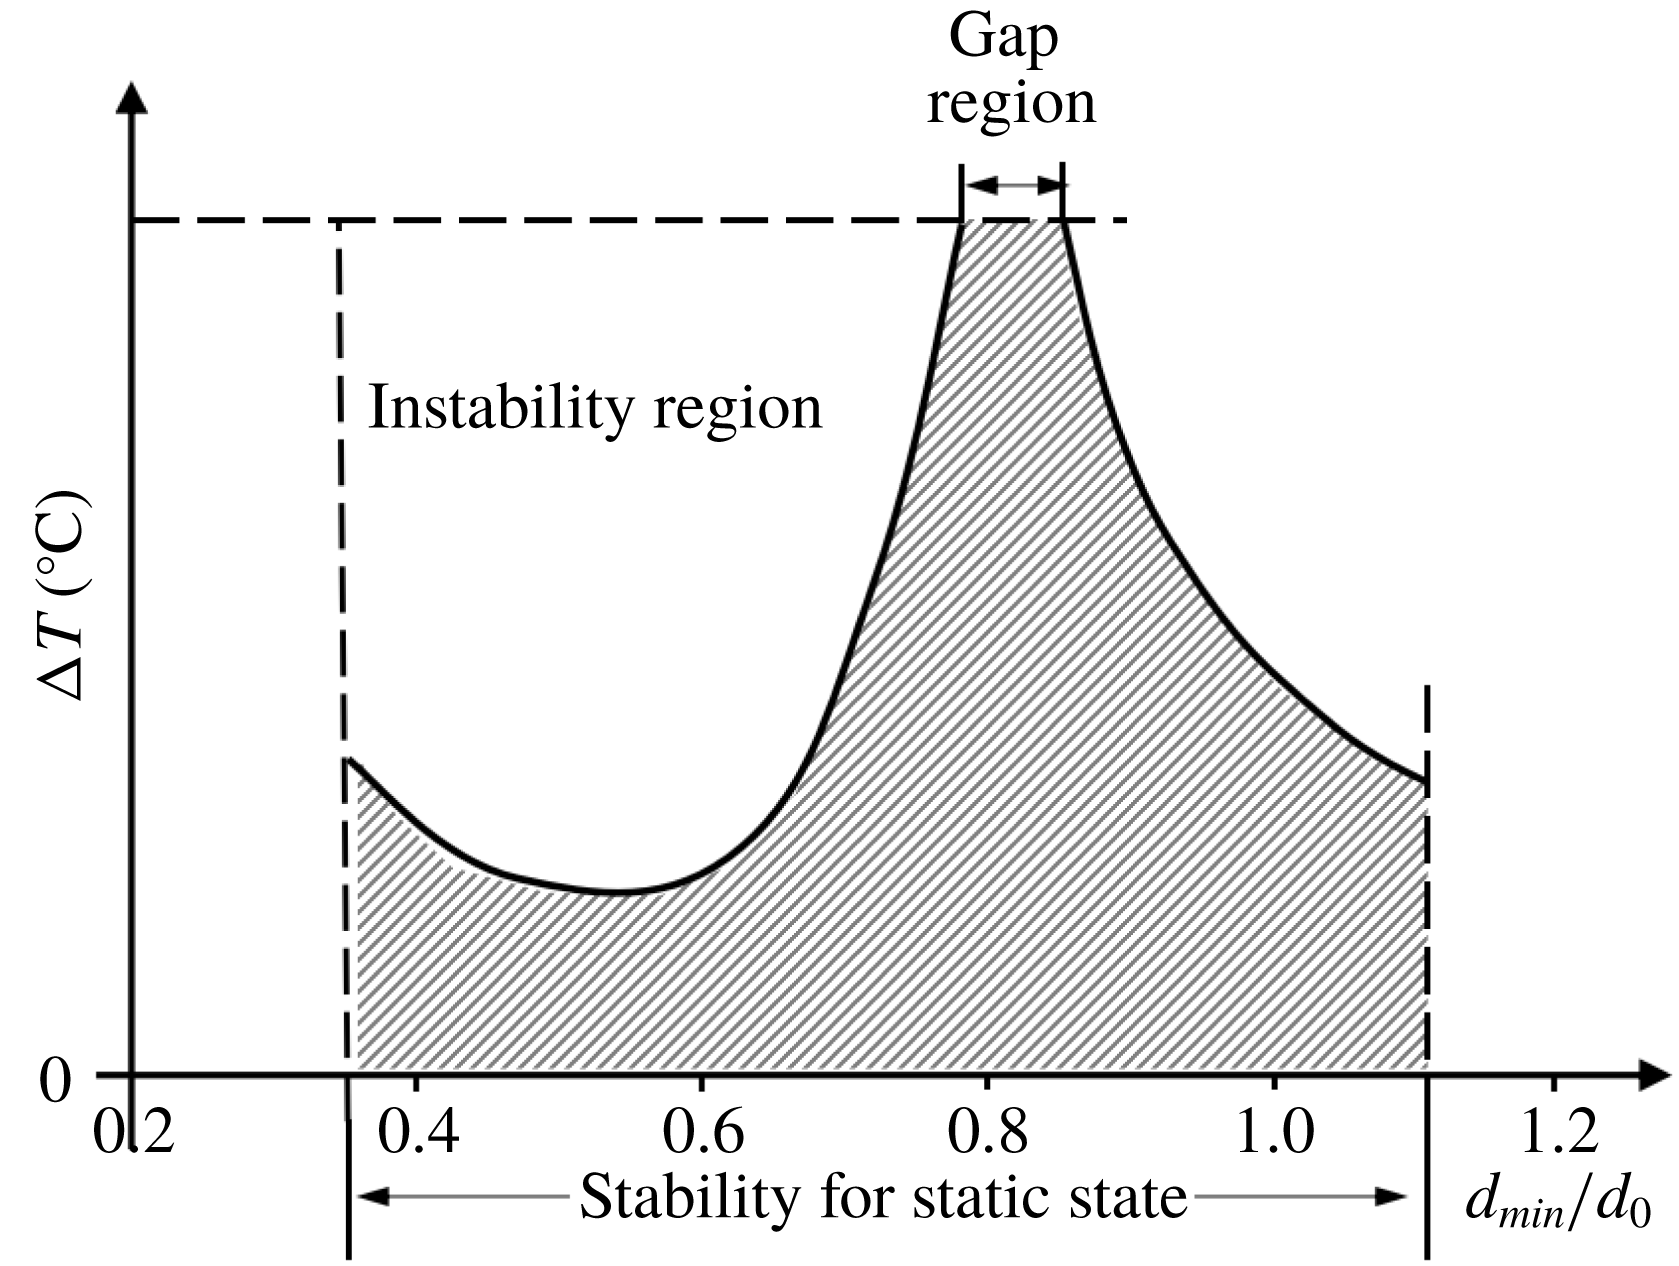
is the cylinder volume of the liquid bridge) on the critical oscillation by changing the fluid volume V of the liquid bridge. The volume ratio represents the geometric configuration of the meniscus. When Vr is small, the liquid free surface is a deep ‘concave’, which is of the ‘slender bridge’. When Vr is large, the liquid free surface is approximately flat or ‘convex’, which is of the ‘fat bridge’. According to the results of Hu et al. (Reference Hu, Shu, Zhou and Tang1994), the curves of critical temperature difference for various volume ratios are separated into two branches, the slender bridge and the fat bridge. The critical temperature difference of the slender bridge decreases first and then increases with the increase of the volume ratio, also, the critical temperature difference of the fat bridge decreases monotonically with the increase of the volume ratio. There is a stable ‘gap’ between the two branches, where the critical temperature difference is infinity, as shown in figure 7.
The volume ratio effect of the liquid bridge.

Oscillation signals and spectra for various volume ratios at
 $Ar=0.7$
(
 $H=14~\text{mm}$
).

Take the liquid bridge with aspect ratio
 $Ar=0.7$
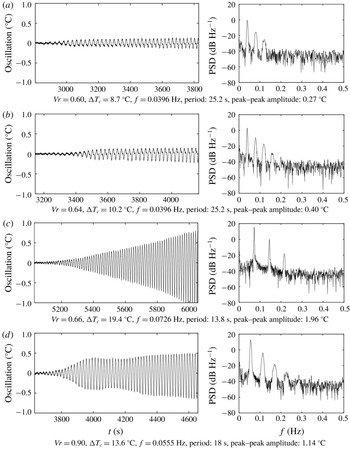
as an example, the critical temperature difference and oscillation characteristics of thermocapillary convection at various volume ratios are studied. The temperature oscillation signals and spectra at volume ratios
 $Vr=0.60$
, 0.64, 0.66 and 0.90 are shown in figure 8(a–d), respectively, and the critical oscillation parameters are listed in table 5. Two oscillation modes, low-frequency oscillation and high-frequency oscillation, are also found. Figures 8(a) and 8(b) are low-frequency oscillations with a frequency of 39.6 mHz and a period of 25.2 s; figures 8(c) and 8(d) are high-frequency oscillations with oscillation frequencies of 72.6 mHz and 55.5 mHz, respectively. The small change in volume ratio from
 $Vr=0.64$
to
 $Vr=0.66$
leads to almost two times the critical value and the oscillation frequency. The critical temperature differences at volume ratios
 $Vr=0.64$
and
 $Vr=0.66$
are
 $10.2\,^{\circ }\text{C}$
and
 $19.4\,^{\circ }\text{C}$
, respectively, and the corresponding oscillation frequencies are 39.6 mHz and 72.6 mHz, respectively. In addition, the amplitude of high-frequency oscillation is five times larger than the amplitude of low-frequency oscillation. Therefore, the critical oscillation mode of thermocapillary convection has the phenomenon of bifurcation with the change in volume ratio Vr. Low-frequency oscillation mode appears in the slender bridge, and it has the characteristics of low onset temperature difference, low oscillation frequency, and small oscillation amplitude. High-frequency oscillation mode appears in the fat bridge and it has characteristics of a high onset temperature difference, high oscillation frequency, and large oscillation amplitude.
The volume ratio effect in the liquid bridge at
 $H=14$
mm. (a) The critical temperature difference versus volume ratio and (b) onset oscillation frequency versus volume ratio.

Characteristics of critical oscillations for various volume ratios.

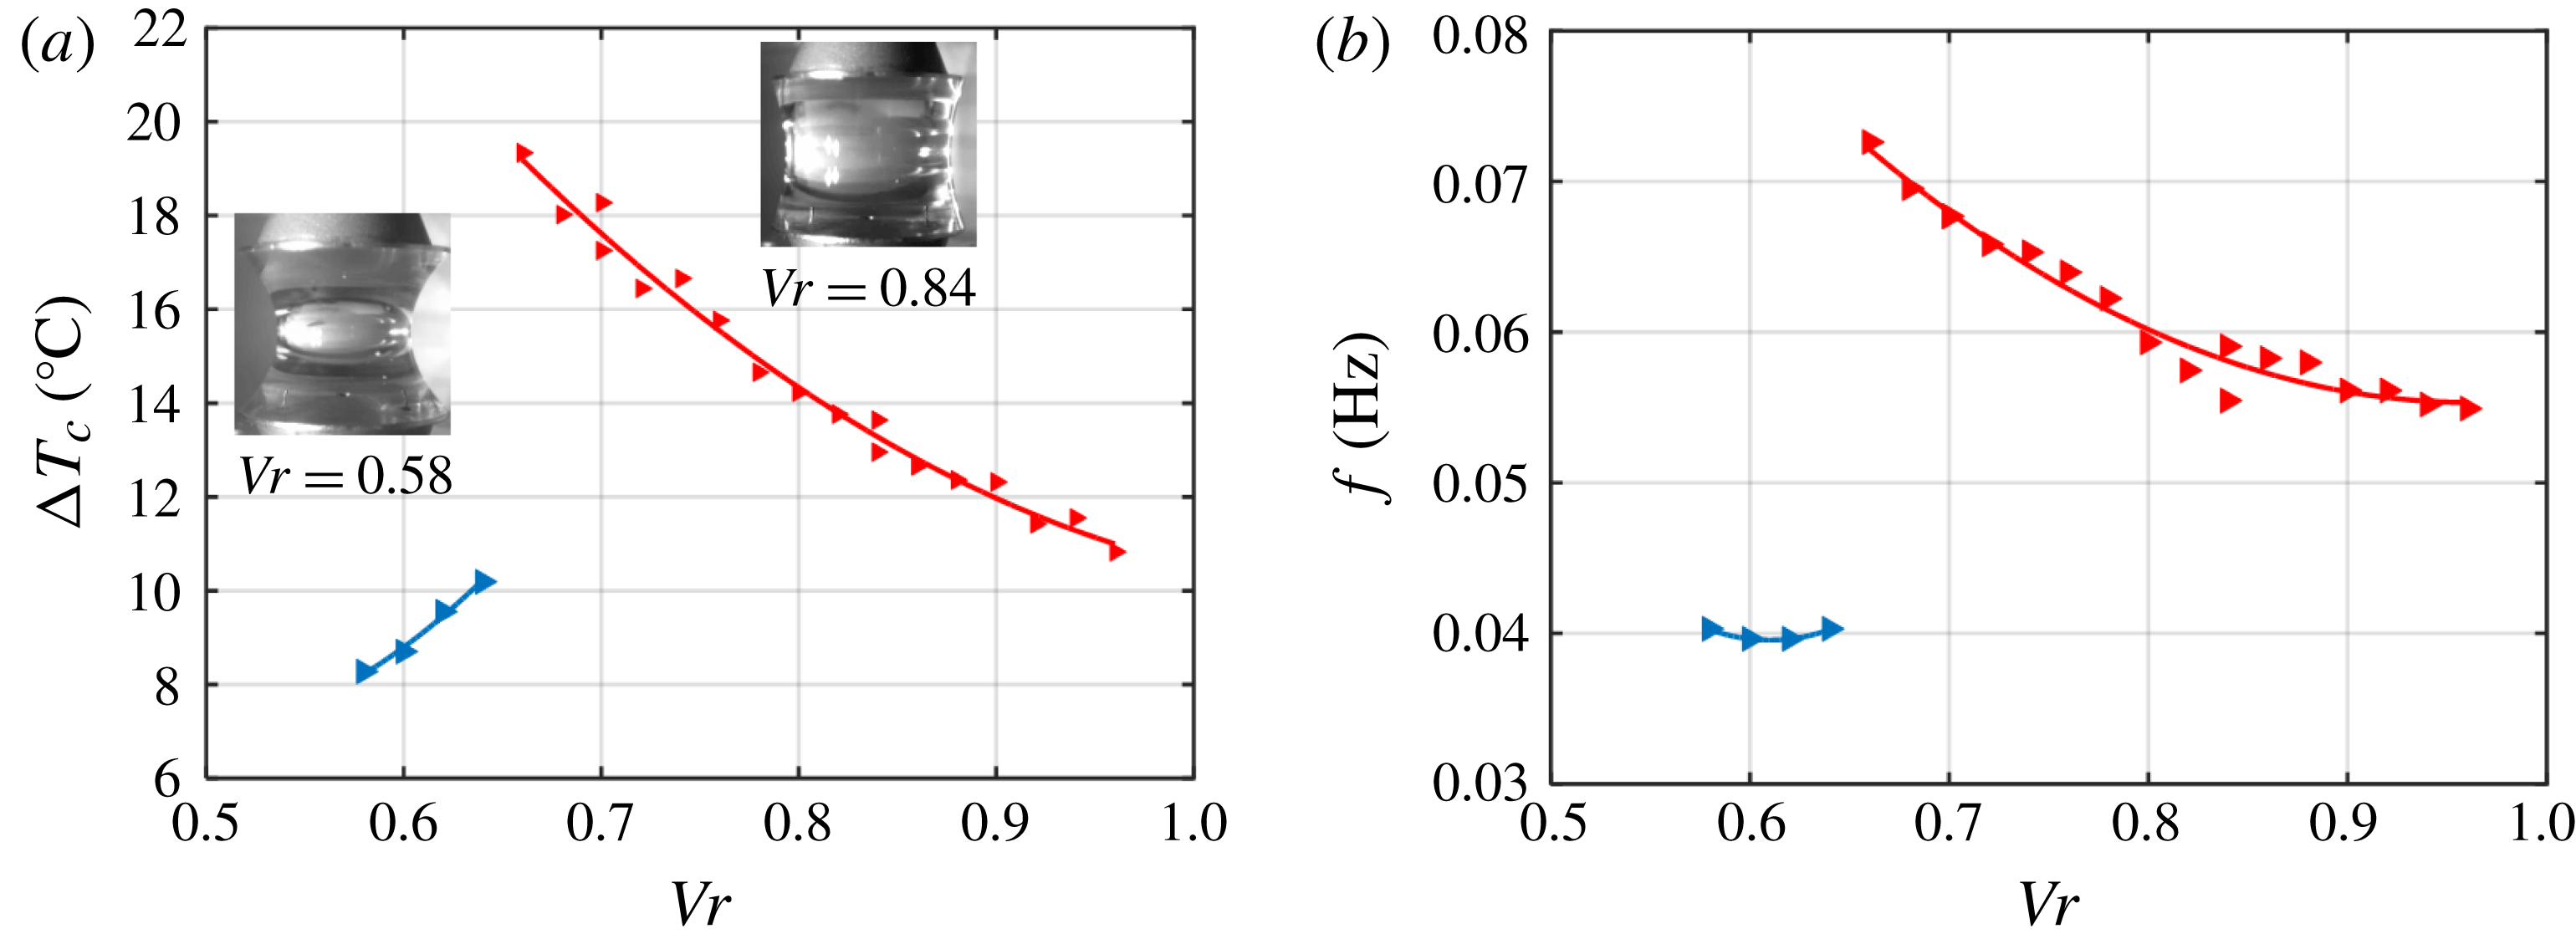
Figure 9 shows critical temperature differences corresponding to various volume ratios of the liquid bridge at
 $Ar=0.7$
. The critical curve of temperature difference has two branches, and the demarcation point is
 $Vr=0.65{-}0.66$
. The critical temperature difference on the left branch has much lower values, and it increases from
 $8$
to
 $10\,^{\circ }\text{C}$
with the increase of the volume ratio; the critical temperature difference on the right branch has higher values, and it decreases from
 $20$
to
 $13\,^{\circ }\text{C}$
with the increase of the volume ratio. The critical temperature difference has a jump change at
 $Vr=0.65{-}0.66$
. We name this volume ratio the critical volume ratio,
 $Vr_{c}$
. The curve of oscillation frequency also has two branches as shown in figure 9(b). The oscillation frequency on the left branch is approximately 40 mHz, and 25 s in period; the oscillation frequency on the right branch has relatively high values, and it decreases from 75 to 55 mHz with the increase of the volume ratio. Therefore, the left branch corresponds to low-frequency oscillation mode, and the right branch corresponds to high-frequency oscillation mode.
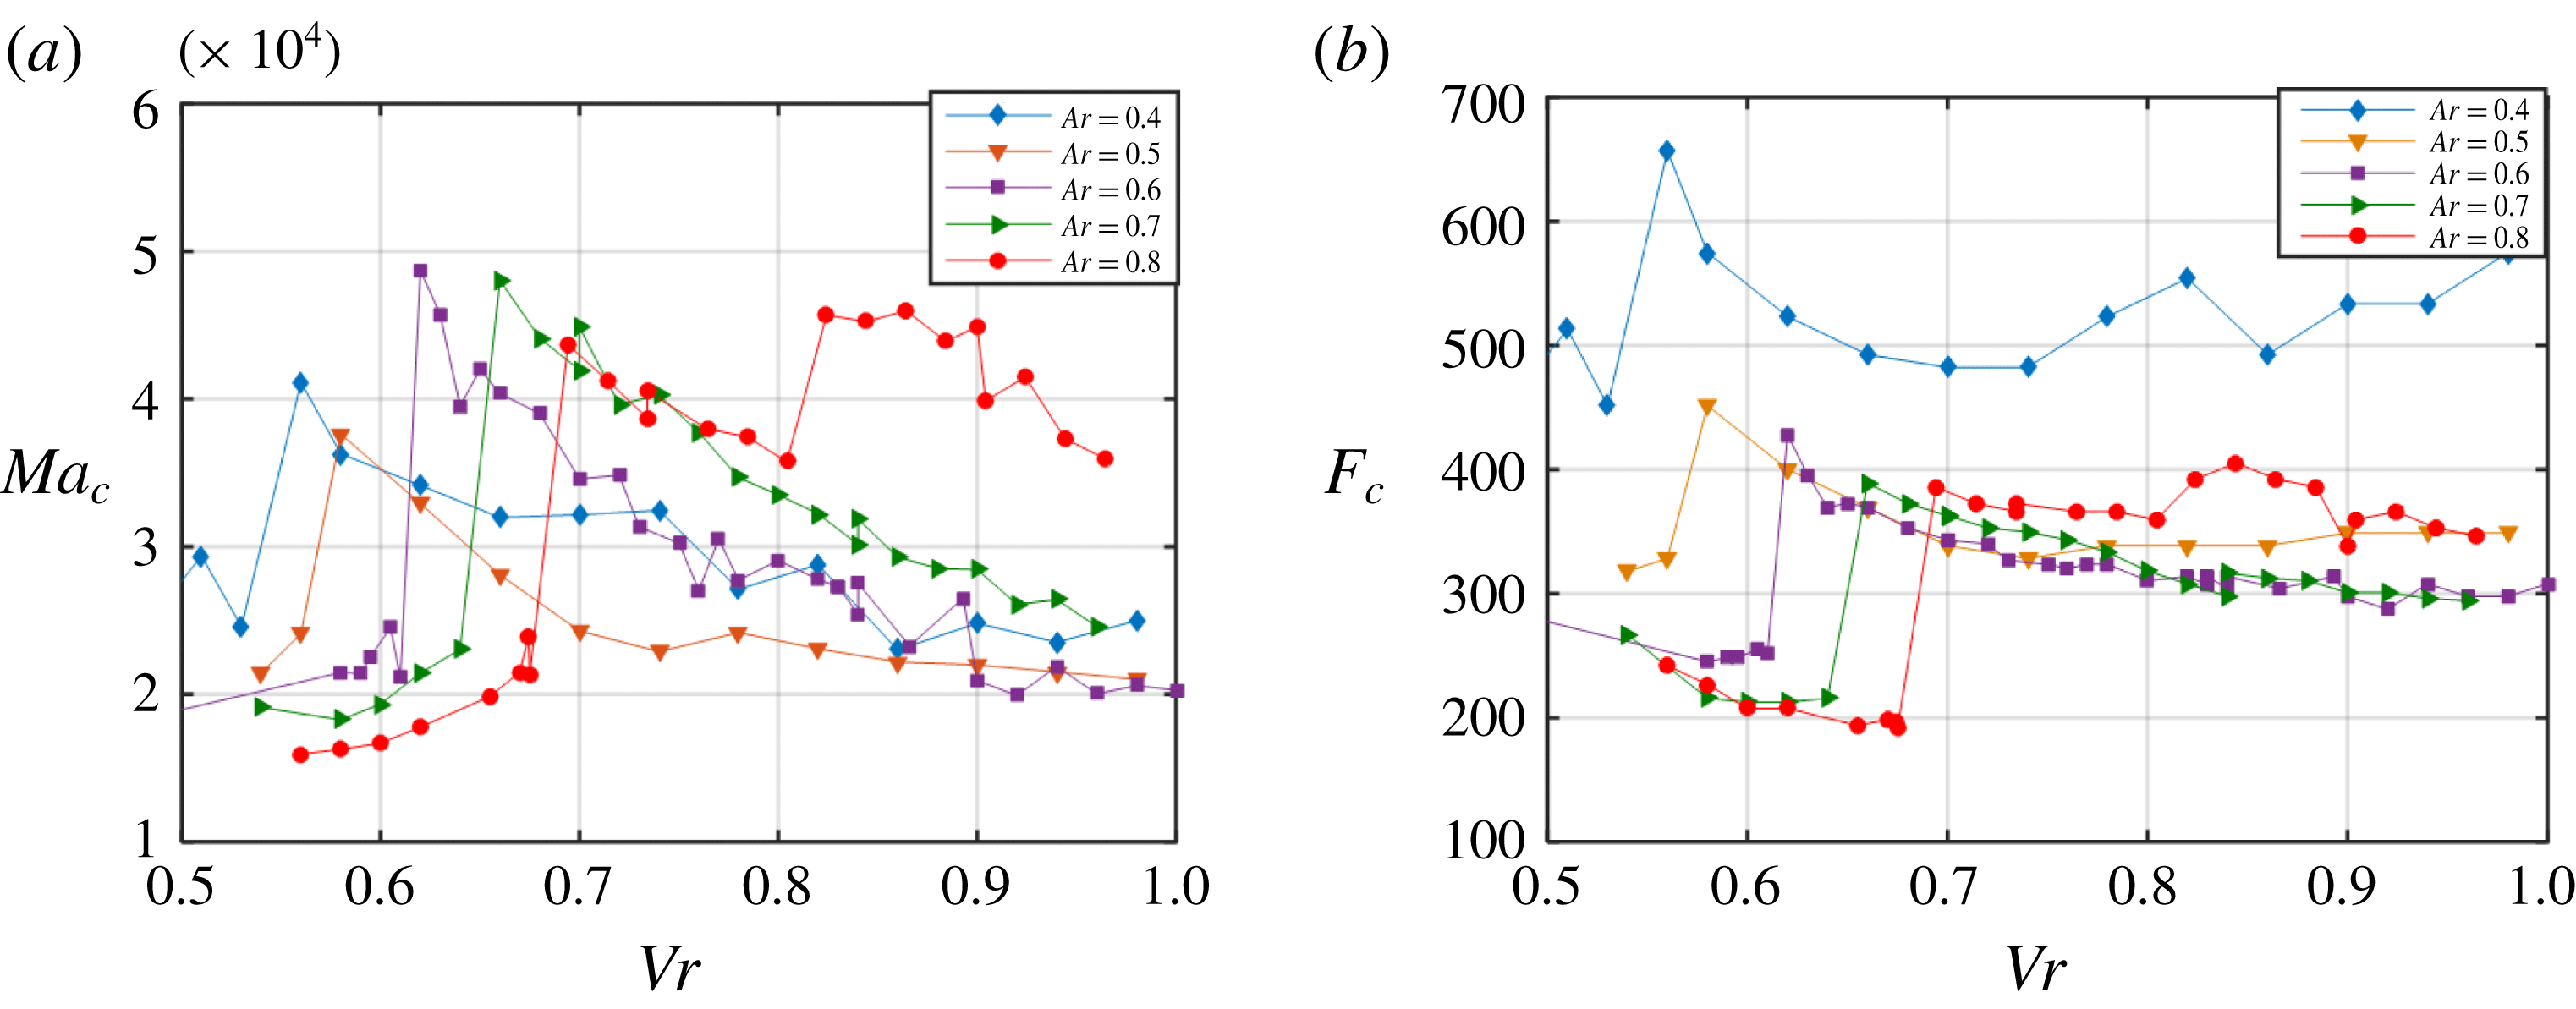
Figure 10 shows the critical Marangoni numbers (figure 10
a) and the critical dimensionless frequencies (figure 10
b) with the change of volume ratio at aspect ratios
 $Ar=0.5$
, 0.6, 0.7 and 0.8. The curve of the critical Marangoni number also is divided into two branches, and the demarcation volume ratio
 $Vr_{c}$
increases with the increase of the aspect ratio. For example, for the liquid bridge with an aspect ratio
 $Ar=0.5$
, the critical volume ratio is
 $Vr_{c}=0.58$
; for the liquid bridge with an aspect ratio
 $Ar=0.8$
, the critical volume ratio is
 $Vr_{c}=0.69$
.
Selecting the reciprocal of heat dissipation time scale as the characteristic oscillation frequency, we can get the dimensionless oscillation frequency
 $$\begin{eqnarray}F=\frac{D^{2}f}{\unicode[STIX]{x1D705}}.\end{eqnarray}$$
For the fat bridge, the critical oscillation frequency tends to converge when
 $Ar\geqslant 0.5$
, and shows a decreasing trend with the increase of volume ratio; for the slender bridge, the critical frequency decreases with the increase of aspect ratio. In addition, for liquid bridges with
 $Ar=0.80$
, it is found in experiments that the critical temperature difference and the oscillation frequency have a second jump change at approximately
 $Vr=0.82$
.
The volume ratio effect in liquid bridges with various heights.

3.3 The comprehensive effect of aspect ratio and volume ratio
With a fixed volume ratio and various aspect ratios of the liquid bridge, there are two separated critical curves of thermocapillary convection for the short bridge and the tall bridge, respectively; with a fixed aspect ratio and various volume ratios, there are also two separated critical curves for the slender bridge and the fat bridge, respectively. They are all bifurcation phenomena caused by the geometry of liquid bridge. Therefore, it is reasonable to study the geometric effect of the liquid bridge in the two-dimensional parametric space of aspect ratio and volume ratio, Ar–Vr.
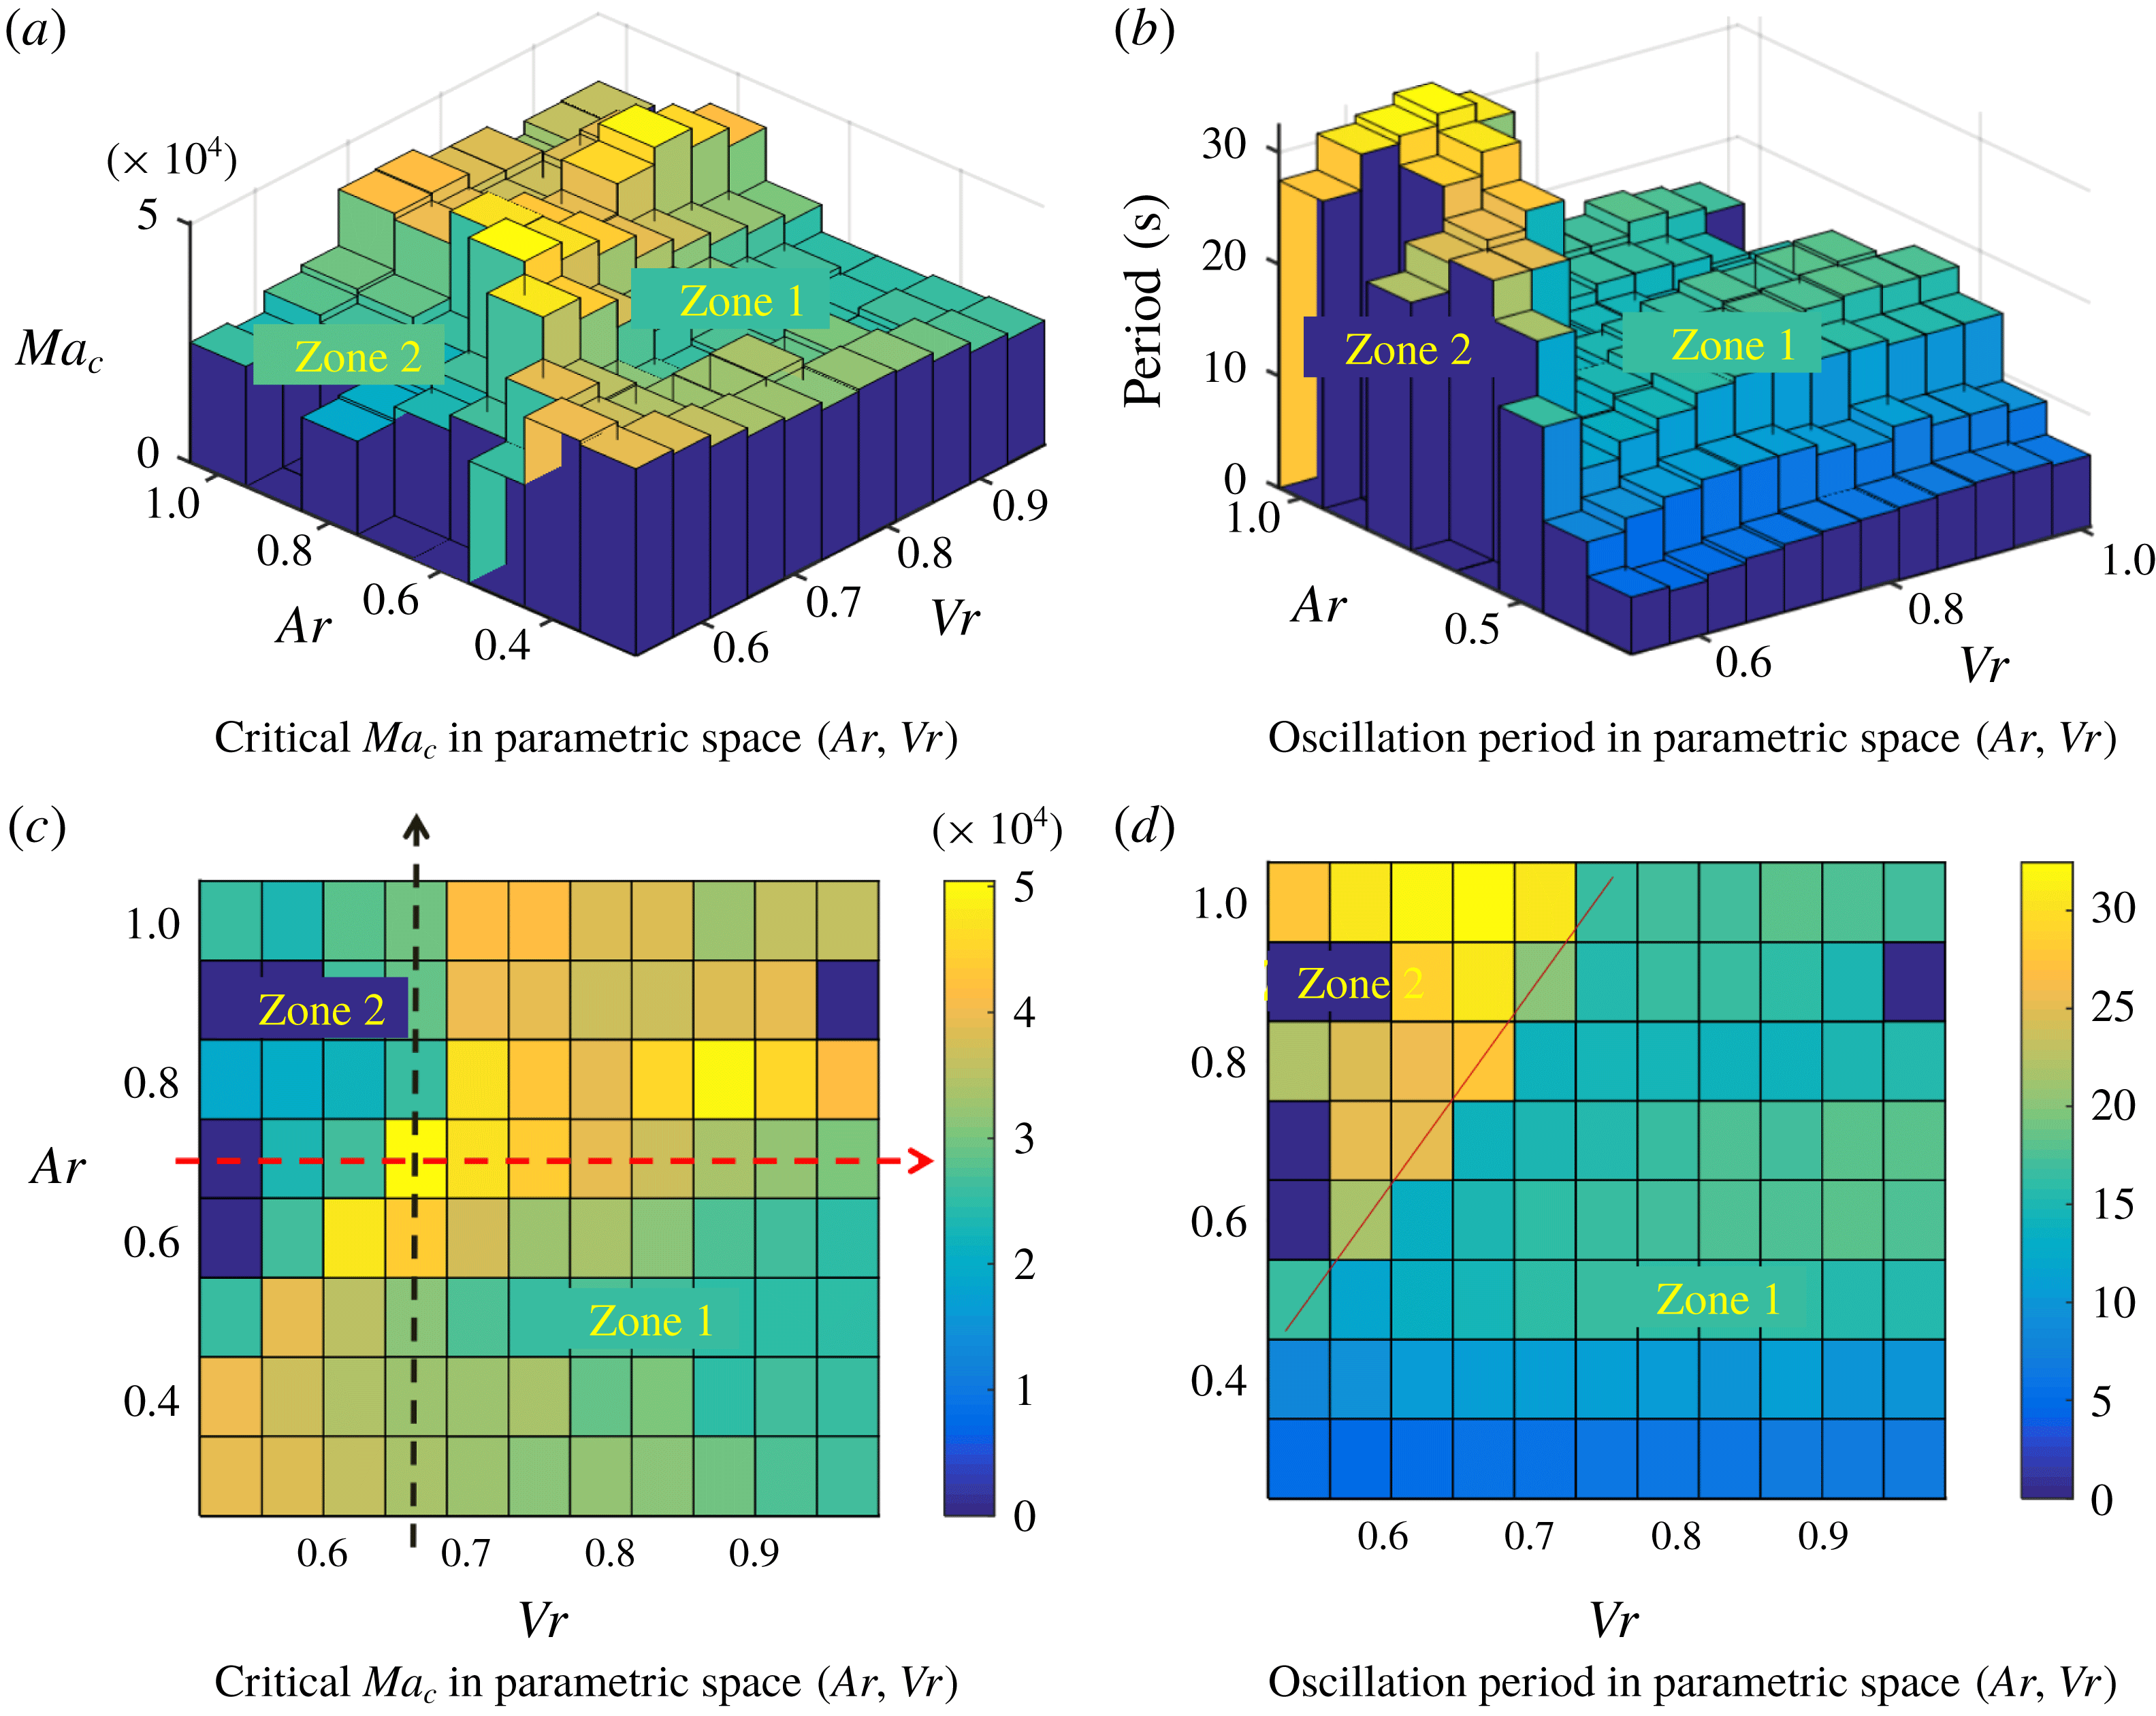
Figure 11 gives the critical
 $Ma_{c}$
and oscillation period in the whole Ar–Vr parametric space. It indicates that the Ar–Vr geometric parameter space is divided into two regions, zone 1 and zone 2, and the values of critical Marangoni number and oscillation period are different between these two zones. In zone 1, the oscillation has characteristics of large critical Marangoni number and short oscillation period; in zone 2, the oscillation has characteristics of small critical Marangoni number and long oscillation period. When the volume ratio effect at the aspect ratio
 $Ar=0.7$
is considered, the geometric parameter (the red arrow in figure 11
c) crosses two zones, so the critical curves are separated into two branches; the branch of the slender bridge is low-frequency oscillation, and the branch of the fat bridge is high-frequency oscillation. When the aspect ratio effect at the volume ratio
 $Vr=0.65$
is considered, the geometric parameter (the black arrow in figure 11
c) also crosses two zones, and the critical curves are separated into two branches, too; the branch of the tall bridge is low-frequency oscillation mode, and the branch of the short bridge is high-frequency oscillation mode, both of them having different oscillation characteristics from each other. From figure 11, the critical curves of volume ratio effect, as well as aspect ratio effect, should be represented with two branches of critical curves, and they have the same mechanism.
Distributions of oscillation starting condition and period in Vr–Ar parametric space.

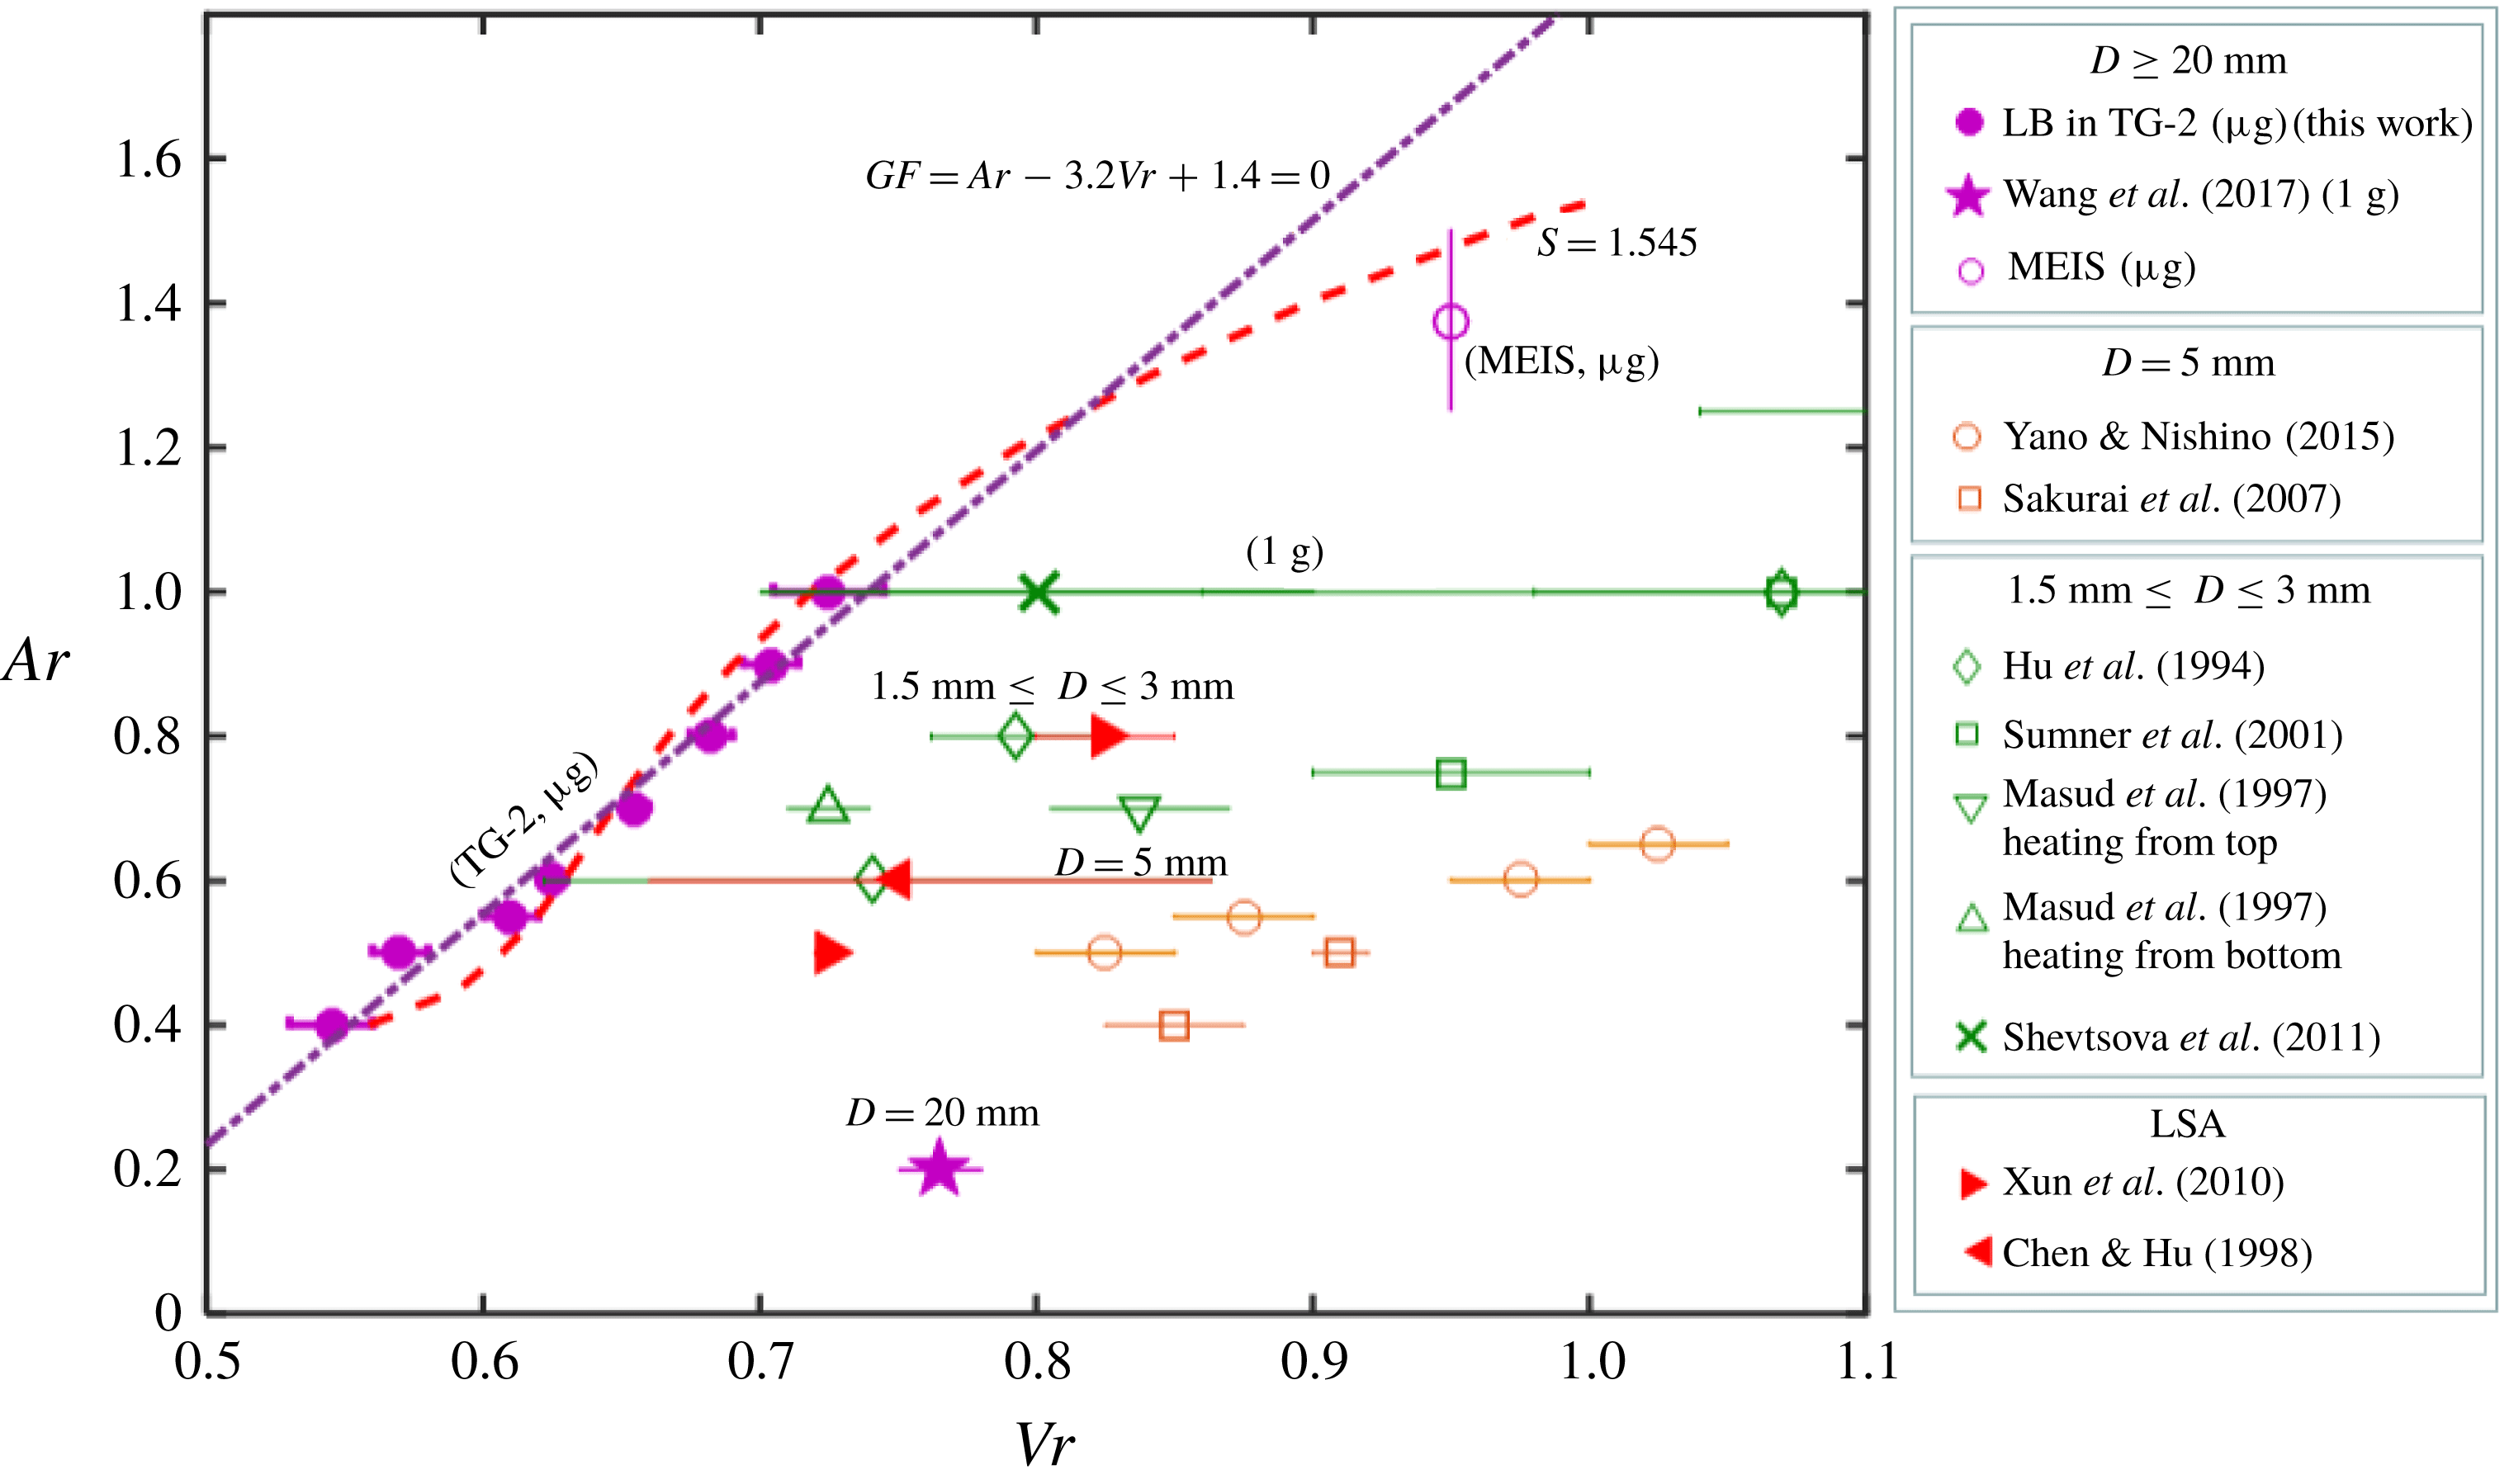
The demarcation line between zone 1 and zone 2 is approximately a straight line,
 $Ar-3.2Vr+1.4=0$
through fitting. According to this linear fitting result, we define a geometric factor as follows:
 $$\begin{eqnarray}GF=Ar-3.2Vr+1.4.\end{eqnarray}$$
When
 $GF<0$
, the oscillation of thermocapillary convection belongs to the low-frequency oscillation (zone 1); when
 $GF>0$
, it belongs to the high-frequency oscillation (zone 2). Our experiments cover the range of
 $0.2\leqslant Ar\leqslant 1.0$
, and the low-frequency oscillation (zone 1) is not found in the range of
 $0.2\leqslant Ar\leqslant 0.4$
. This geometric factor is effective when
 $0.5\leqslant Ar\leqslant 1.0$
. When
 $Vr=0.65$
, the geometric factor gives the demarcation point
 $Ar=0.68$
, which is consistent with the experimental result at
 $Ar=0.70$
(figure 6). The space experiments of MEIS in Japan obtained the critical conditions at the volume ratio
 $Vr=0.95$
. They found a jump of the critical Marangoni number and dimensionless frequency at
 $Ar=1.25{-}1.50$
. We use the geometric factor to predict that the demarcation point is at
 $Ar=1.64$
, which is essentially in agreement with the results of the space experiments of MEIS.
3.4 The mechanism of thermocapillary convection
There are two different wave forms in thermocapillary convection: azimuthal waves and axial waves. Azimuthal waves are traveling waves or standing waves rotating on the horizontal cross-section of the flow field. Kang carried out the matching liquid bridge experiments of TG-2 on the ground, studying liquid bridges with diameter
 $D=20$
mm and height
 $H=3{-}4$
mm (
 $0.15\leqslant Ar\leqslant 0.2$
), and observed azimuthal waves (Wang et al.
Reference Wang, Wu, Duan and Kang2017). The propagation direction of axial waves is in the axial direction of the liquid bridge or at a certain angle with it. Schwabe (Reference Schwabe2005) found hydrothermal waves in their space experiments in the liquid bridge with
 $Ar=2.5$
. The propagation direction of hydrothermal waves is opposite to the direction of temperature gradient (axial) and at a certain angle with it, which is very close to the theoretical result of hydrothermal waves by Xu & Davis (Reference Xu and Davis1984). For cylindrical liquid bridges, axial waves mostly appear in liquid bridges with high aspect ratios, also, azimuthal waves appear more easily in short bridges due to the limit of the boundary of liquid bridge. However, if the volume ratio decreases, the necking diameter of the meniscus decreases too, which is equivalent to the increase of aspect ratio. Therefore, in short bridges with small volume ratios, it is also possible that axial waves appear.
As shown in figure 11, zone 1 corresponds to ‘short and fat’ liquid bridges, and the high-frequency oscillation mode in zone 1 is inferred to the azimuthal wave; zone 2 corresponds to ‘tall and slender’ liquid bridges, and the low-frequency oscillation mode in zone 2 is inferred to the axial wave. The smaller the aspect ratio, the more slender the liquid bridge needs to be to have axial waves appearing and enter low-frequency oscillation mode. In order to decide whether the liquid bridge is ‘tall and slender’ or ‘short and fat’, we define a parameter
 $S$
to indicate the degree of slenderness of the liquid bridge,
 $$\begin{eqnarray}S=H/d_{min}-H/(2R_{c}),\end{eqnarray}$$
where
 $d_{min}$
is the free surface necking diameter of the liquid bridge and
 $R_{c}$
is the radius of curvature of the meniscus in the longitudinal surface. The minus sign in the equation means that the radius of a concave meniscus
 $R_{c}$
in the longitudinal surface is defined to be negative. Here
 $d_{min}$
and
 $R_{c}$
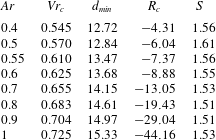
are given by numerical calculations according to the aspect ratio Ar and the volume ratio Vr, respectively. Under various aspect ratios, the demarcation gives a consistent slenderness factor S, as shown in table 6. The average S at the demarcation point is 1.545. When the volume ratio
 $Vr=1$
, then
 $\unicode[STIX]{x0394}T_{c1}^{\ast }$
, and
 $S=Ar$
. That is, for the cylindrical liquid bridge (
 $Vr=1$
), when the aspect ratio
 $Ar>1.545$
, thermocapillary convection is in the second oscillation mode.
The space experimental results and ground experimental results at the demarcation point.

The slenderness factor S at the demarcation point.

The experimental results in space and other related experimental results on the ground at the geometric demarcation point of the two oscillation modes are shown in figure 12. The geometric factor fits the experimental data well. The demarcation curve given by the slenderness S is nonlinear, and the extrapolated data are consistent with the space experimental results of MEIS in Japan. However, in most ground experiments, the demarcation points appear in a less slender liquid bridge than in the microgravity environment. In other words, the low-frequency oscillation mode can also be found in the ‘short and fat’ liquid bridge in ground experiments.
The diameter of a liquid bridge affects the demarcation point. In ground experiments, the data distributions from different research groups are discrete because the diameters of liquid bridges used in different research groups are different. For example, Hu et al. (Reference Hu, Shu, Zhou and Tang1994), Chen & Hu (Reference Chen and Hu1998), Sumner et al. (Reference Sumner, Neitzel, Fontaine and Dell’Aversana2001), Masud et al. (Reference Masud, Kamotani and Ostrach1997) and Shevtsova et al. (Reference Shevtsova, Mialdun, Kawamura, Ueno, Nishino and Lappa2011) used liquid bridges with a diameter of 1.5–3.0 mm, and Yano & Nishino (Reference Yano and Nishino2015) and Sakurai et al. (Reference Sakurai, Ohishi and Hirata2004, Reference Sakurai, Ohishi and Hirata2007a
,Reference Sakurai, Ohishi and Hirata
b
) used liquid bridges with a diameter of 5.0 mm. It can be seen from figure 12 that the larger the diameter of liquid bridge, the smaller the demarcation slenderness S is. It implies that the low-frequency oscillation mode is preferred by the gravity effect. The reason is that the Bond number of the liquid bridge increases with the increase of the diameter of liquid bridge, and the gravity effect makes low-frequency oscillation mode easier to appear. Shevtsova also found in ground experiments with liquid bridges of different sizes that, the gap region moves in the direction of larger volume ratios with the increase of Bond number. When
 $D=1.5$
mm and
 $Bo_{d}=1.02$
, the gap region is at
 $0.7<Vr<0.9$
, which is very close to our experimental result (
 $0.71<Vr<0.75$
) in space. In the space experiments carried out by Japanese scientists (Kawamura et al.
Reference Kawamura, Nishino, Matsumoto and Ueno2012; Nishino et al.
Reference Nishino, Yano, Kawamura, Matsumoto, Ueno and Ermakov2015), liquid bridges with diameters of 30–60 mm were used, and the Bond number generated by residual acceleration was approximately 2.25–9 times bigger than that in our experiments. Probably because of the bigger
 $Bo_{d}$
number, the jump change points of critical values observed in MEIS correspond to smaller aspect ratios than our predicted values.
4 Oscillation transitions
Oscillation transition refers to the change of oscillation mode when the temperature difference exceeds the threshold. It reflects the nonlinear competition between instability modes. The transition process is affected by the geometry of the liquid bridge and the variation mode of temperature difference.
4.1 Multiple transitions of low-frequency mode
In the heating process, there exists the transition from low-frequency oscillation mode to high-frequency oscillation mode. Taking liquid bridges with the aspect ratio
 $Ar=0.7$
as an example, figures 13(a) and 13(b) show temperature oscillations in liquid bridges with the volume ratio
 $Vr=0.64$
and 0.66, respectively. In the liquid bridge with
 $Ar=0.7$
and
 $Vr=0.64$
(figure 13
a), the critical temperature difference is
 $10.2\,^{\circ }\text{C}$
, and the fundamental frequency is 0.0396 Hz. When the temperature difference is increased to
 $22.9\,^{\circ }\text{C}$
, the oscillation transition appears with the sudden increase of oscillation amplitude and the jump change of frequency to 0.0793 Hz. After the transition, the oscillation is in the high-frequency oscillation mode, and it is consistent with the high-frequency oscillation mode in the liquid bridge with
 $Ar=0.7$
and
 $Vr=0.66$
(
 $\unicode[STIX]{x0394}T_{c}=19.4\,^{\circ }\text{C}$
and
 $f=0.0726$
Hz). Both of them have similar critical conditions and oscillation frequencies. Therefore, as the temperature difference increases, the low-frequency oscillation mode transits to high-frequency oscillation mode in the small volume ratio liquid bridge.
Temperature oscillations of thermocapillary convection in the process of linear temperature increase; (a)
 $Ar=0.7$
,
 $Vr=0.64$
, (b)
 $Ar=0.7$
,
 $Vr=0.66$
.

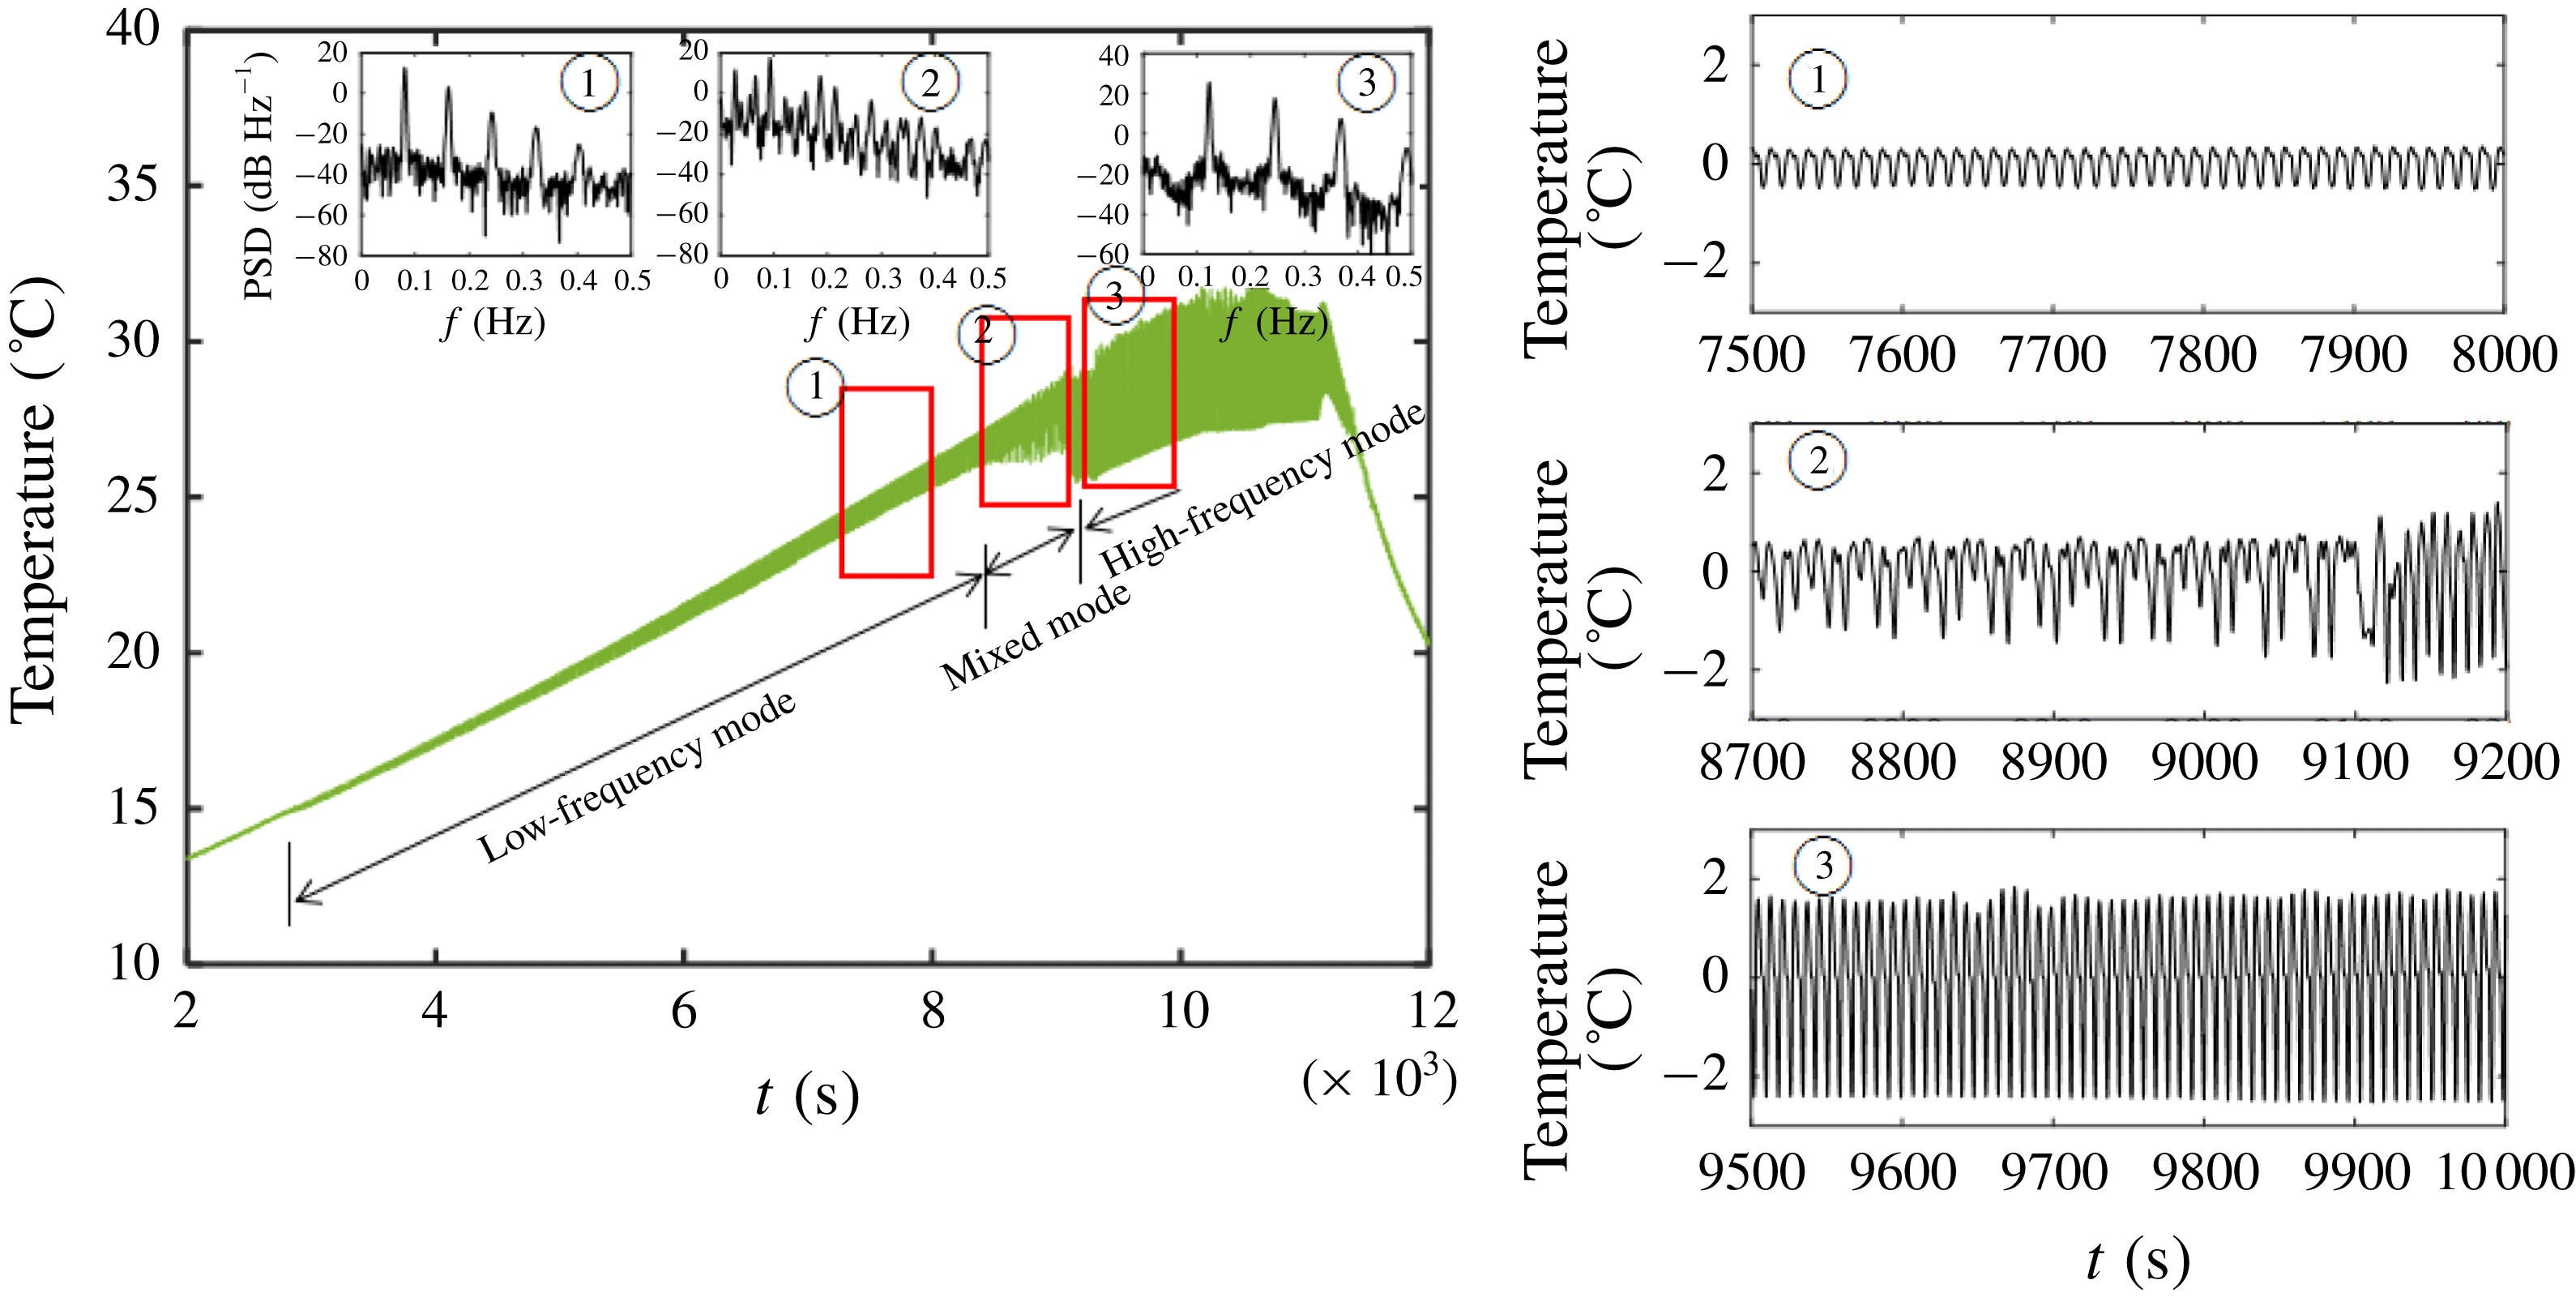
In the transition process from low-frequency mode to high-frequency mode, generally, there is an oscillating stage when low-frequency mode and high-frequency mode are mixed together. As shown in figure 13, in the transition process from low-frequency mode to high-frequency mode at volume ratio
 $Vr=0.58$
, there is an obvious oscillating region mixed with low-frequency and high-frequency modes. However, in the transition process at volume ratio
 $Vr=0.64$
shown in figure 13(a), low-frequency mode transits directly to high-frequency mode, and there is no mixed oscillating region. Therefore, the mixed oscillating region exists in thermocapillary convection in liquid bridges with smaller volume ratios. The smaller the volume ratio, the longer the mixed oscillating stage.
Figure 14 shows the original signals and spectra of data windows
 $\unicode[STIX]{x2460}$
,
 $\unicode[STIX]{x2461}$
and
 $\unicode[STIX]{x2462}$
. At data window
 $\unicode[STIX]{x2460}$
, the oscillation signal has a fundamental frequency and multiple harmonics, and the fundamental frequency is 0.0829 Hz. At data window
 $\unicode[STIX]{x2461}$
, the oscillation signal is in the mixed oscillation mode and is irregular; there exist two fundamental frequencies in the spectrum,
 $f_{1}=0.0927$
Hz and
 $f_{2}=0.0280$
Hz, as well as frequencies of linear combinations of these two fundamental frequencies, such as
 $f_{1}+f_{2}=0.1207$
Hz and
 $f_{1}$
–
 $f_{2}=0.0647$
Hz. Also, at data window
 $\unicode[STIX]{x2462}$
, the oscillation signal is in the high-frequency mode, and the fundamental frequency is 0.1220 Hz, which evolves from the frequency of mixed oscillation mode
 $f_{1}+f_{2}$
. The mixed oscillation mode is the superposition of low-frequency mode and high-frequency mode simultaneously.
The transition process starting from low-frequency oscillation mode (
 $H=14$
mm and
 $Vr=0.58$
).

The critical temperature differences for transitions into low-frequency mode, mixed oscillation mode and high-frequency mode are defined in turn as the first critical temperature difference
 $\unicode[STIX]{x0394}T_{c1}$
, the second critical temperature difference
 $\unicode[STIX]{x0394}T_{c2}$
and the third critical temperature difference
 $\unicode[STIX]{x0394}T_{c3}$
, respectively. The three critical temperature differences in figure 14 are
 $8.26\,^{\circ }\text{C}$
,
 $35.47\,^{\circ }\text{C}$
and
 $40.38\,^{\circ }\text{C}$
, respectively.
Figure 15 shows the critical values of transitions at various volume ratios in liquid bridges with
 $Ar=0.7$
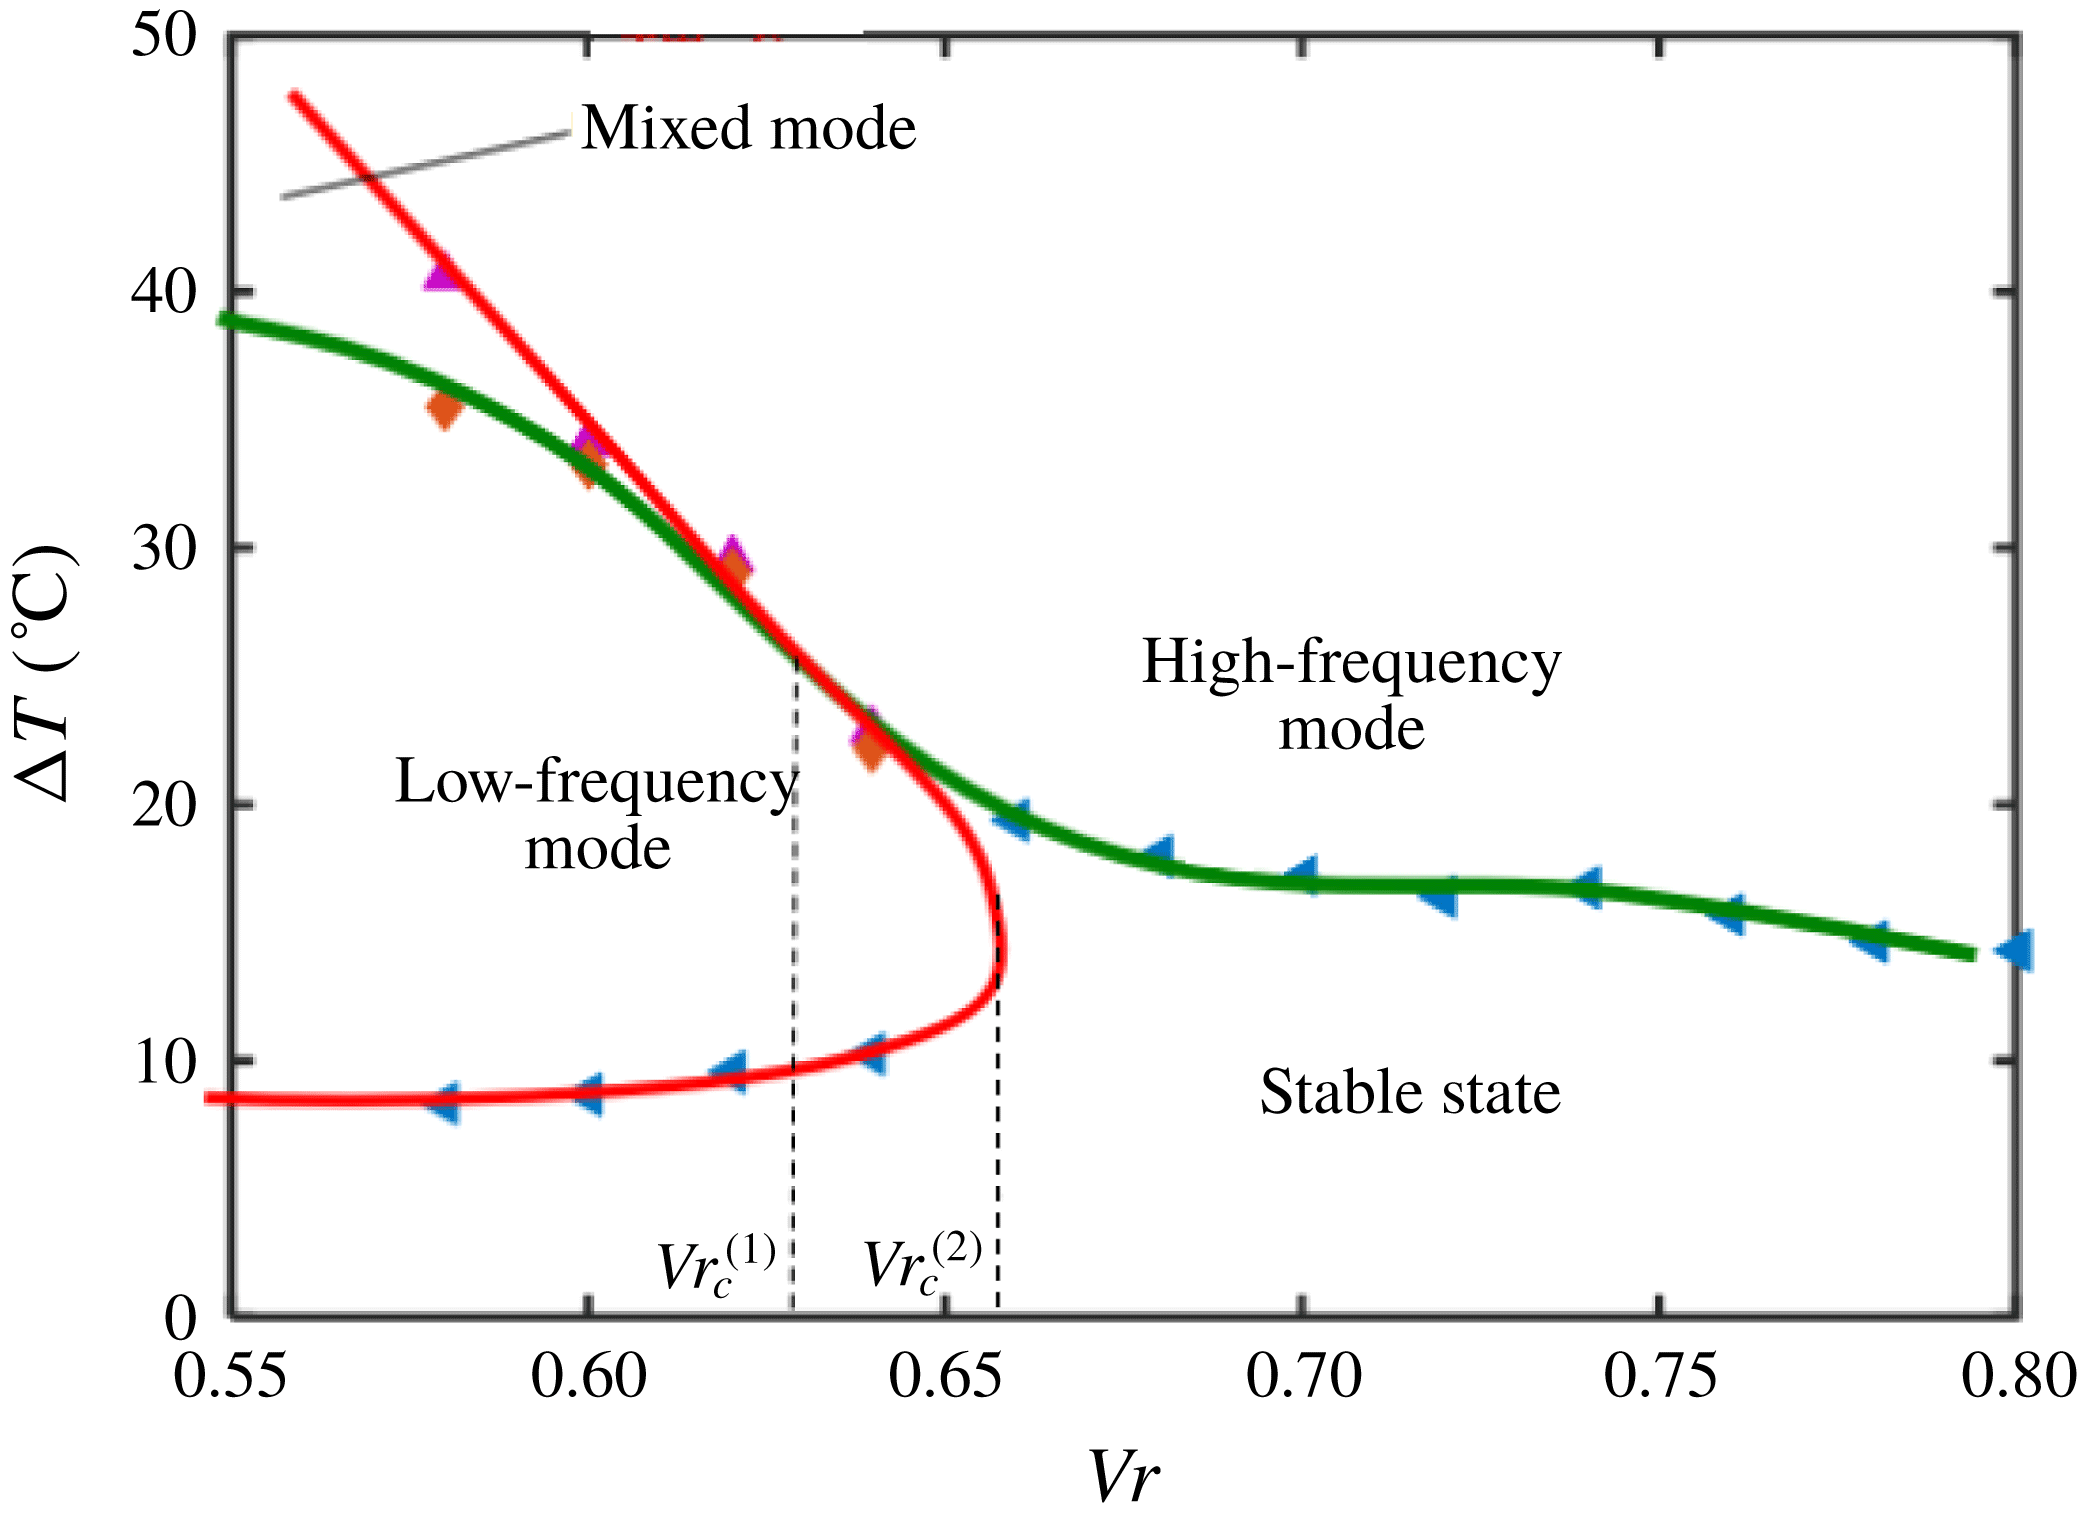
. From the point of view of stability analysis, both of the first critical value and the third critical value are critical points of neutral stability of low-frequency mode. Therefore, by connecting these points, we can get the curve of neutral stability of low-frequency mode (the ‘red curve’). This curve shows a ‘

The curves of neutral stability of low-frequency mode and high-frequency mode.

There is an intersection between the neutral stability curves of low-frequency mode and high-frequency mode, and the corresponding volume ratio is noted as
 $Vr_{c}^{(1)}$
. In figure 15,
 $Vr_{c}^{(1)}\approx 0.63$
. When the volume ratio is close to
 $Vr_{c}^{(1)}$
(
 $0.60\leqslant Vr\leqslant 0.64$
), the second transition point and the third transition point are very close, and there is no obvious mixed oscillation. The largest volume ratio at which low-frequency mode appears is noted as
 $Vr_{c}^{(2)}$
, and it is approximately 0.66–0.68. The demarcation volume ratio observed in experiments is noted as
 $Vr_{c}$
. Because of the heating rate effect,
 $Vr_{c}$
is slightly less than
 $Vr_{c}^{(2)}$
(see 4.2). The characteristics of neutral stability curves can explain the jump change of the first critical temperature difference at volume ratio
 $Vr_{c}$
well. Even though the volume ratio is changed gradually, the phenomenon of jump change in critical conditions and oscillation frequency is still inevitable, when
 $Vr_{c}=Vr_{c}^{(1)}$
.
From figure 15, we can see that thermocapillary convection in liquid bridges with different volume ratios have different transition processes. It is roughly divided into three cases: (1) when
 $Vr<Vr_{c}^{(1)}$
, there is a sequence of three transitions: steady state
 $\rightarrow$
low-frequency oscillation mode
 $\rightarrow$
mixed oscillation mode
 $\rightarrow$
high-frequency oscillation mode; (2) when
 $Vr\approx Vr_{c}^{(1)}$
, low-frequency oscillation mode transits directly to high-frequency oscillation mode, so there is a sequence of only two transitions: steady state
 $\rightarrow$
low-frequency oscillation mode
 $\rightarrow$
high-frequency oscillation mode; (3) when
 $Vr_{c}^{(1)}<Vr<Vr_{c}^{(2)}$
, there is an oscillation suspension area in theory, and there is a sequence of three transitions: steady state
 $\rightarrow$
low-frequency oscillation mode
 $\rightarrow$
oscillation suspension
 $\rightarrow$
high-frequency oscillation mode. The situations (1) and (2) have been well reflected in the experiments, corresponding to the transition processes in figures 13 and 14, respectively. For the phenomenon of oscillation suspension predicted in (3), though it has not been found in the heating process, its existence has been verified in the linear cooling process (see § 4.3).
In the experimental study on the volume ratio effect on the ground, there are two points of view about stability characteristics of the demarcation point between the two branches of critical curve. In the opinion of Hu et al. (Reference Hu, Shu, Zhou and Tang1994), there is no intersection between these two branches, instead there is a stable gap. But, there is also a view that oscillation of thermocapillary convection will occur at the interval if the temperature difference is high enough. If we only consider the critical value of the onset mode, it is hard to explain the phenomenon of jump change at the demarcation point. By completely drawing the curves of neutral stability of low-frequency mode and high-frequency mode, we find that the two curves have an intersection, so there is not a gap. When the volume ratio of the liquid bridge is at
 $Vr_{c}^{(2)}$
, the jump changes in the critical temperature difference and oscillation frequency must occur.
4.2 The influence of heating rate on critical conditions
It is usually considered that the heating rate only influences the relaxation time of heat balance. Hysteresis in the onset of oscillatory thermocapillary convection may occur under the condition of rapid temperature variation. Because the characteristic time scale of dissipation is
 $H^{2}/\unicode[STIX]{x1D705}$
, the taller the liquid bridge, the more significant the heating rate effect. We find that the heating rate of
 $0.3\,^{\circ }\text{C}~\text{min}^{-1}$
has relatively high influence in the liquid bridge with
 $H\geqslant 16~\text{mm}$
.
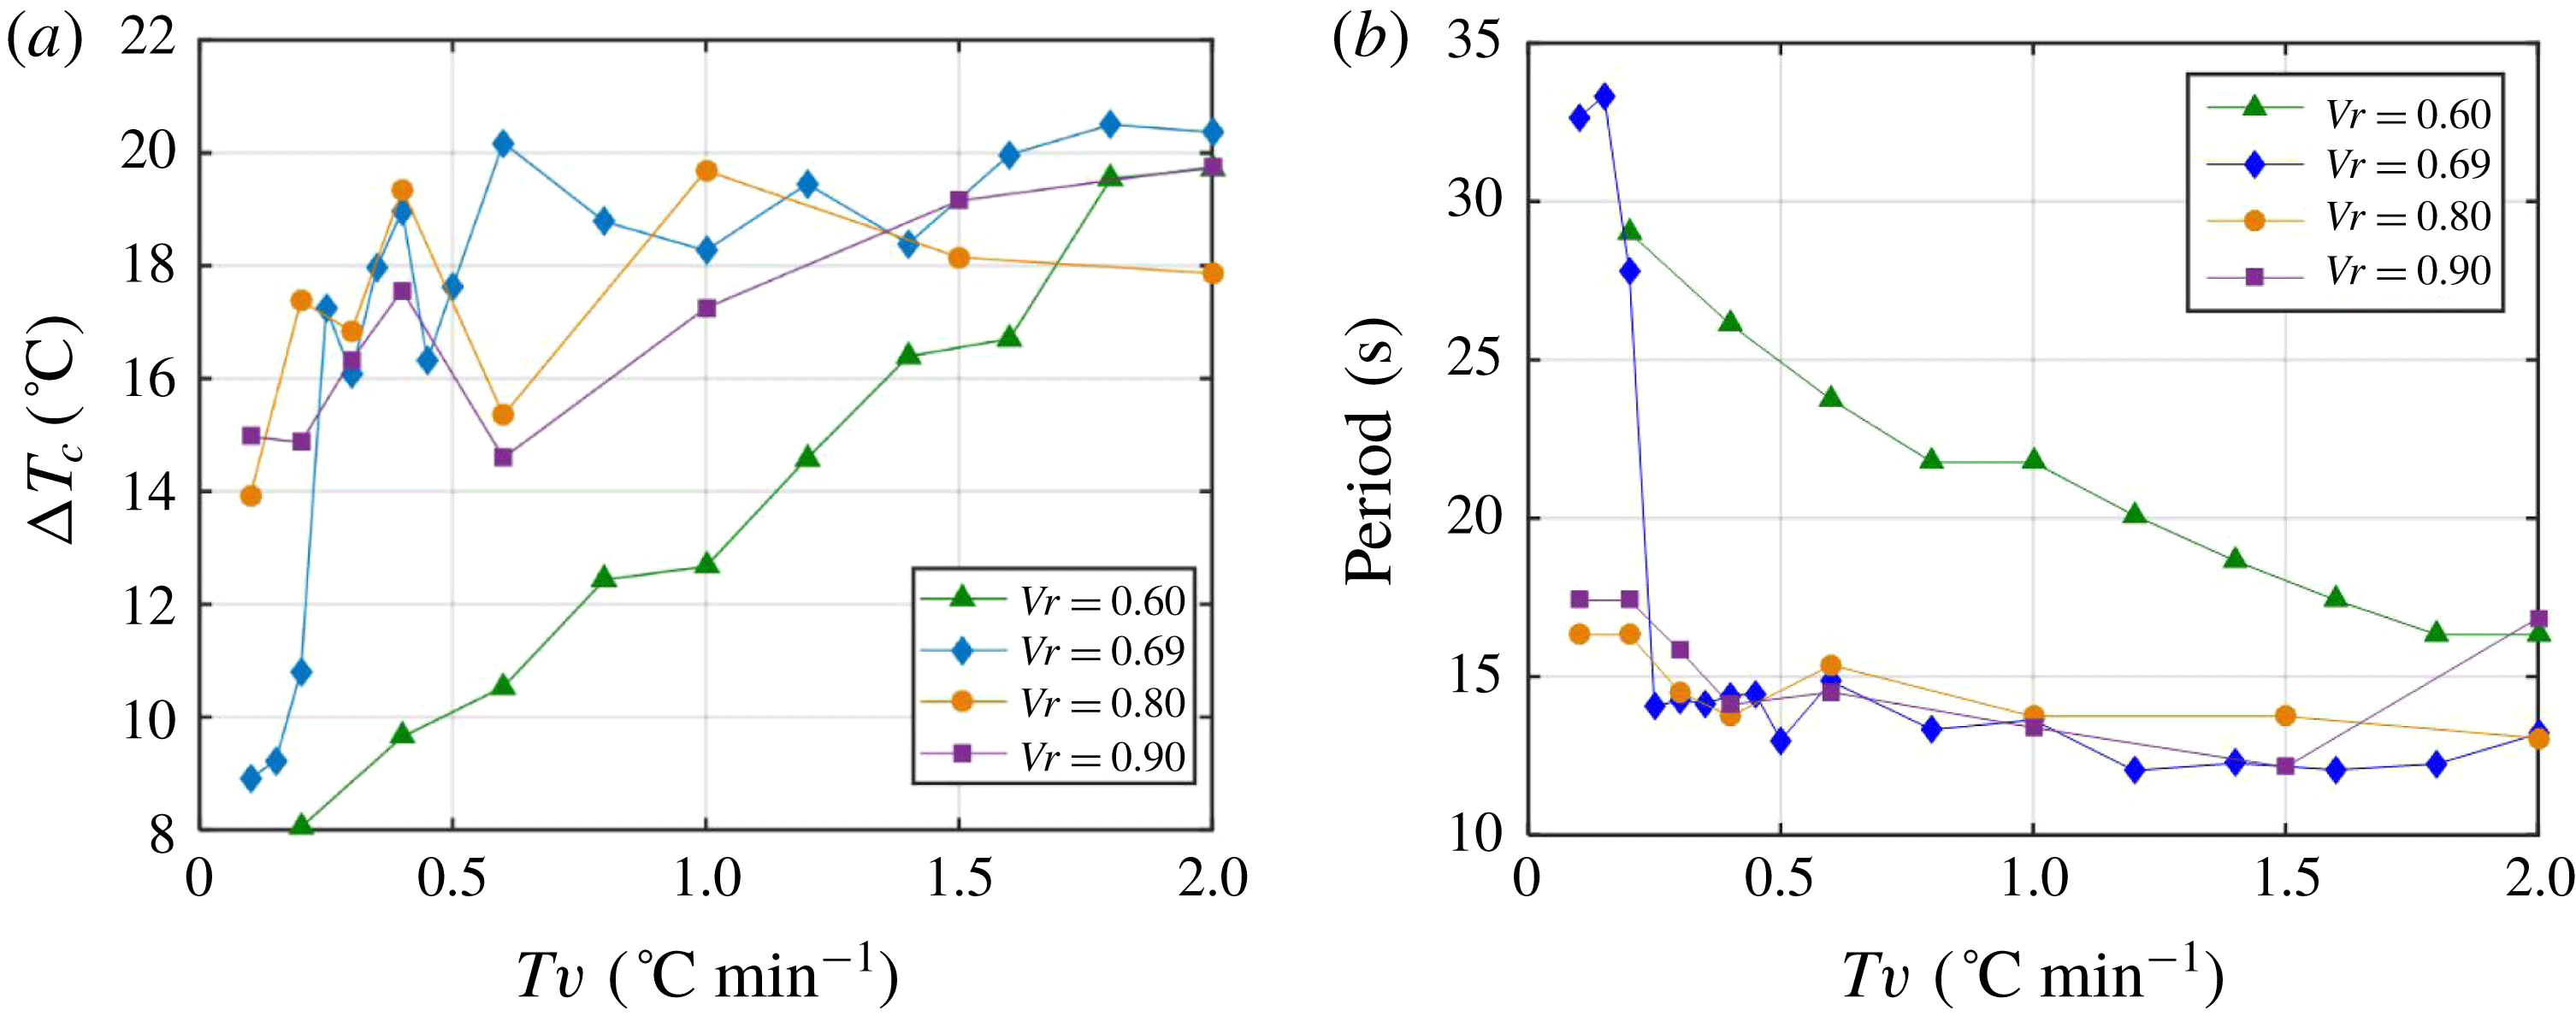
The influence of heating rate on critical conditions of different branches is different. Figure 16 shows the critical temperature differences in liquid bridges with
 $Ar=0.8$
when volume ratio
 $Vr=0.6$
, 0.69, 0.80 and 0.90, and with the heating rate changing from
 $0.1$
to
 $2.0\,^{\circ }\text{C}~\text{min}^{-1}$
. For the liquid bridge with
 $Ar=0.8$
, the volume ratio at the demarcation point is approximately 0.70–0.72. As a result, the volume ratios
 $Vr=0.60$
and 0.69 belong to the branch of smaller volume ratios, also, the volume ratios
 $Vr=0.8$
and 0.9 belong to the branch of larger volume ratios (figure 16). Therefore, we need to consider which branch the critical curve belongs to and then carry out a classified discussion about the influence of heating rate on critical conditions.
The influence of heating rate. (a) The critical temperature difference versus the heating rate; (b) the oscillation period versus the heating rate.

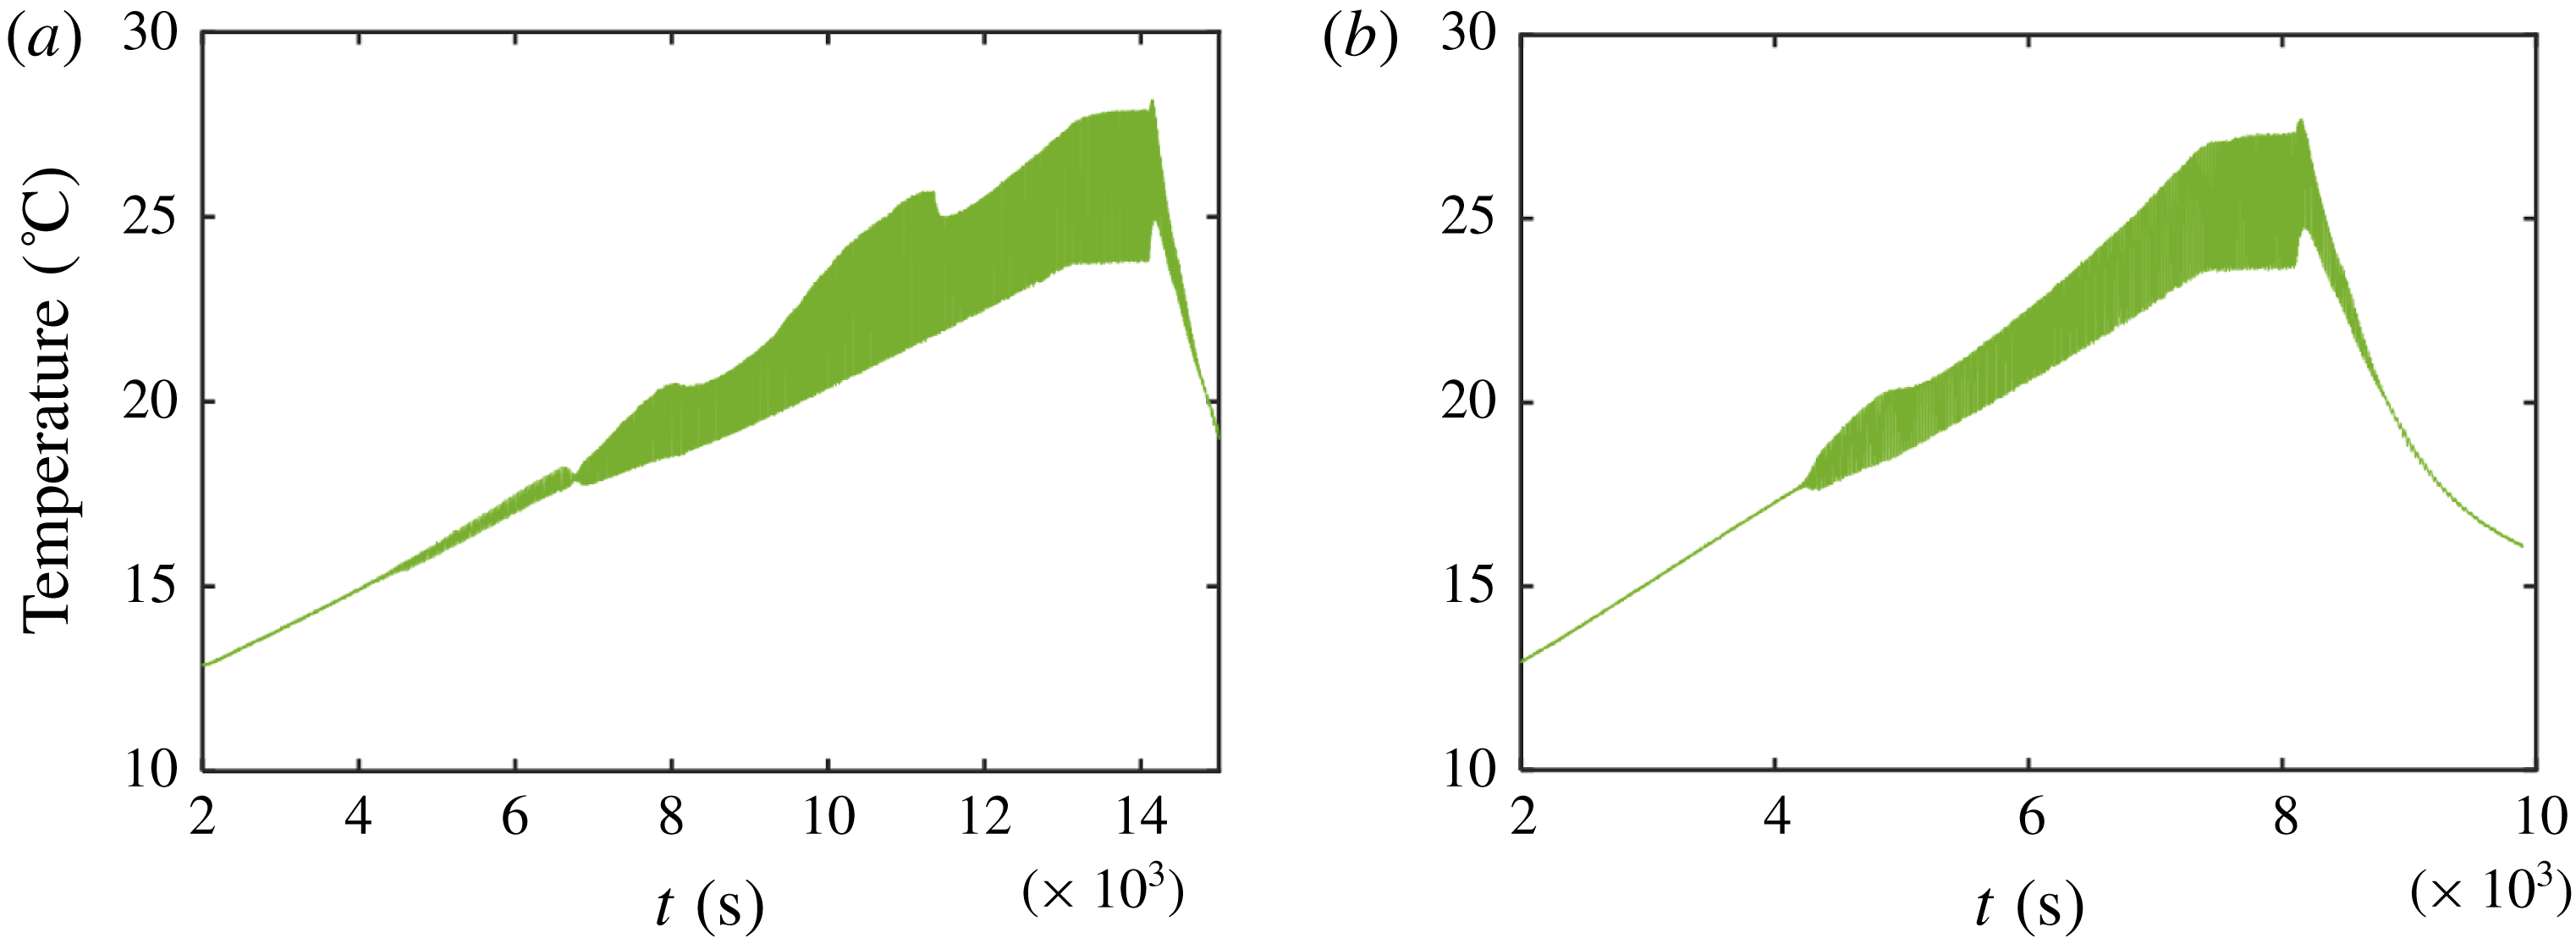
For the liquid bridge with a volume ratio close to the demarcation point, the critical temperature difference and oscillation mode are very sensitive to the heating rate. For example, the liquid bridge with
 $Ar=0.8$
and
 $Vr=0.69$
, when the heating rate increases from
 $0.2$
to
 $0.4\,^{\circ }\text{C}~\text{min}^{-1}$
, the critical temperature difference jumps from
 $9$
to
 $19\,^{\circ }\text{C}$
suddenly, and the oscillation period jumps from 28 to 14 s. Temperature signals at the heating rates of
 $0.2$
and
 $0.4\,^{\circ }\text{C}~\text{min}^{-1}$
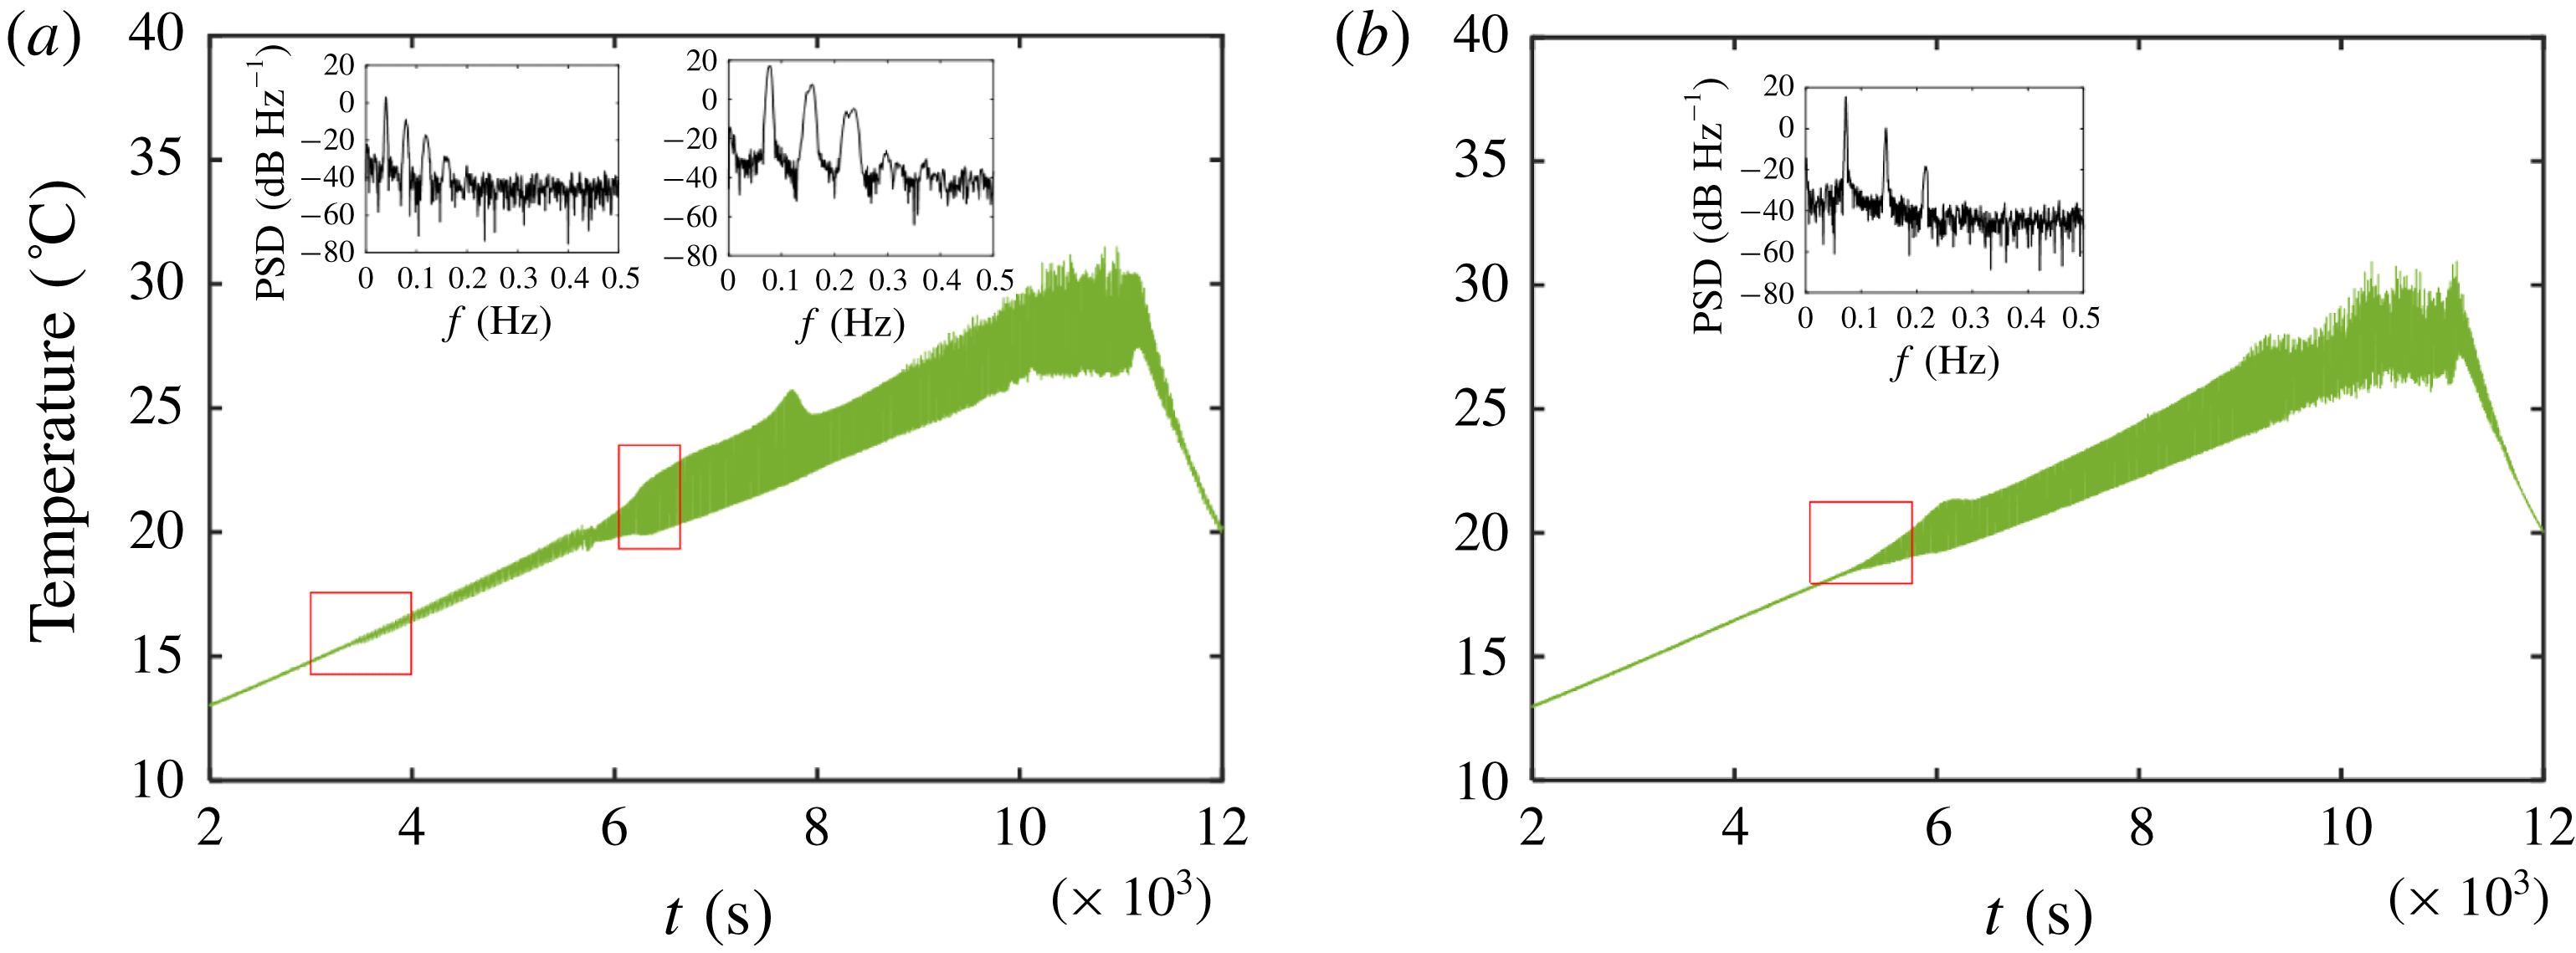
are shown in figures 17(a) and 17(b), respectively. It is observed clearly that, when the heating rate is
 $0.2\,^{\circ }\text{C}~\text{min}^{-1}$
, low-frequency oscillation mode appears first, then transits into high-frequency oscillation mode; when the heating rate is
 $0.4\,^{\circ }\text{C}~\text{min}^{-1}$
, the oscillation is in high-frequency mode directly. Thus, around the demarcation point where
 $Vr\approx Vr_{c}$
, low-frequency oscillation mode appears first and then enters into high-frequency oscillation mode when the heating rate is slow; also, the oscillation is in high-frequency oscillation mode directly when the heating rate is increased. It is inferred that the demarcation volume ratio
 $Vr_{c}$
obtained from the experiments with limited heating rates is less than
 $Vr_{c}^{(2)}$
(
 $Vr_{c}<Vr_{c}^{(2)}$
).
The change in oscillation mode caused by the heating rate (
 $H=16$
mm and
 $Vr=0.69$
). (a) The heating rate is
 $0.2\,^{\circ }\text{C}~\text{min}^{-1}$
and (b) heating rate is
 $0.4\,^{\circ }\text{C}~\text{min}^{-1}$
.

As shown in figure 16, in the case
 $Vr<Vr_{c}$
, for example,
 $Vr=0.6$
, the critical temperature difference increases linearly with the increase of heating rate. This indicates that the fast heating rate has an inhibitory effect on the low-frequency mode. When the heating rate is increased, the critical temperature difference increases too, and the low-frequency oscillation becomes short, until it disappears completely. In the case
 $Vr>Vr_{c}$
, for example,
 $Vr=0.80$
and 0.90, the critical temperature difference shows an increasing trend within the range
 $0.1<Tv<0.4$
(
 $^{\circ }\text{C}~\text{min}^{-1}$
), and its slope is close to that of the case
 $Vr=0.60$
. However, the influence of a fast heating rate on the critical temperature difference is non-monotonic, there is a minimum value of the critical temperature difference at the heating rate of
 $0.6\,^{\circ }\text{C}~\text{min}^{-1}$
.
Figure 18 shows the curves of neutral stability at aspect ratio
 $Ar=0.8$
. The critical temperature difference is the most sensitive to the heating rate when the volume ratio is close to the demarcation volume ratio. So, the heating rate is set to
 $0.1\,^{\circ }\text{C}~\text{min}^{-1}$
when
 $0.65<Vr<0.75$
, and
 $0.3\,^{\circ }\text{C}~\text{min}^{-1}$
for other volume ratios. The volume ratio at the intersection of the two branches
 $Vr_{c}^{(1)}$
is approximately 0.690–0.705. In this range of volume ratio, low-frequency mode transits to high-frequency mode directly, so there is no mixed oscillation process. However, in experiments with volume ratio
 $Vr=0.65$
and 0.67, there exists a band of mixed oscillation, and the pattern of neutral stability curves is consistent with that of the liquid bridge with
 $Ar=0.7$
.
To study the heating rate effect, the critical temperature differences at slow heating rate (
 $0.1\,^{\circ }\text{C}~\text{min}^{-1}$
) and fast heating rate (
 $2\,^{\circ }\text{C}~\text{min}^{-1}$
) are obtained. The arrows in figure 18 indicate the influence of heating rate on critical conditions when it is increased from
 $0.1$
to
 $2\,^{\circ }\text{C}~\text{min}^{-1}$
. Red arrows indicate the changes of the left branch, that the low-frequency oscillation mode jumps to high-frequency oscillation mode when
 $Vr<Vr_{c}$
, which is because the fast heating rate leads to the transition of thermocapillary convection into high-frequency oscillation mode directly. Blue arrows indicate the changes of the right branch, that the fast heating rate leads to changes in the critical temperature difference of high-frequency mode when
 $Vr>Vr_{c}$
. The experiments show that, when volume ratio
 $Vr=0.75$
, 0.80 and 0.90, the fast heating rate does not lead to a significant change in the critical temperature difference. In brief, for
 $Vr<Vr_{c}$
, if the heating rate is slow, thermocapillary convection goes through multiple transitions from low-frequency oscillation to high-frequency oscillation; and if the heating rate is fast, it directly enters into high-frequency oscillation mode. Also, for
 $Vr>Vr_{c}$
, the increase of heating rate only leads to a slight increase of the critical value without the change of oscillation mode.
The heating rate effect on the critical curves in liquid bridges with
 $Ar=0.8$
.

4.3 The influence of heating and cooling on critical conditions
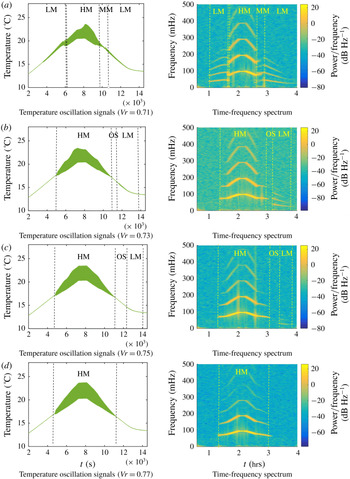
When the maximum temperature difference has been reached in the liquid bridge, the temperature difference starts to decrease linearly, and thermocapillary convection transits from oscillatory flow to steady flow. Figure 19 shows temperature oscillation signals and time-frequency spectra during the heating and cooling processes in liquid bridges with
 $Ar=0.8$
for various volume ratios,
 $Vr=0.71$
, 0.73, 0.75 and 0.77. Both the heating rate and the cooling rate are
 $0.3\,^{\circ }\text{C}~\text{min}^{-1}$
. These volume ratios are distributed near the critical volume ratio.
Oscillation signals and time-frequency spectra of thermocapillary convection in heating and cooling processes (LM, low-frequency mode, HM, high-frequency mode, MM, mixed mode, OS, oscillation suspension).

When volume ratio
 $Vr=0.71$
 $(Vr<Vr_{c}^{(1)})$
, during the heating process, thermocapillary convection experiences the transition sequence: steady state
 $\rightarrow$
low-frequency oscillation mode
 $\rightarrow$
mixed oscillation mode
 $\rightarrow$
high-frequency oscillation mode; oscillation transitions during the cooling process are the reverse process in most cases, and the three critical points are significantly lower than in the heating process. However, when volume ratio
 $Vr=0.73$
, the transition process under cooling is not exactly the reverse process of heating. During the heating process, thermocapillary convection enters into high-frequency oscillation mode directly; while, during the cooling process, there is a short oscillation suspension during the transition from high-frequency oscillation mode to low-frequency mode. Experimental results of the case
 $Vr=0.75$
are similar to that of the case
 $Vr=0.73$
, but oscillation signals in low-frequency mode become very weak, furthermore, the interval of oscillation suspension becomes longer. In § 4.1, we predict there is an oscillation suspension region according to the neutral stability curves, and the oscillation suspension region that appears in the cooling process is exactly the same as our prediction. When
 $Vr=0.77$
, low-frequency oscillation mode disappears, and thermocapillary convection only has oscillations in high-frequency mode. Therefore, by analysing the oscillation of thermocapillary convection during the cooling process, we can get a more accurate value of critical volume ratio
 $Vr_{c}^{(2)}$
, which is approximately 0.75–0.77.
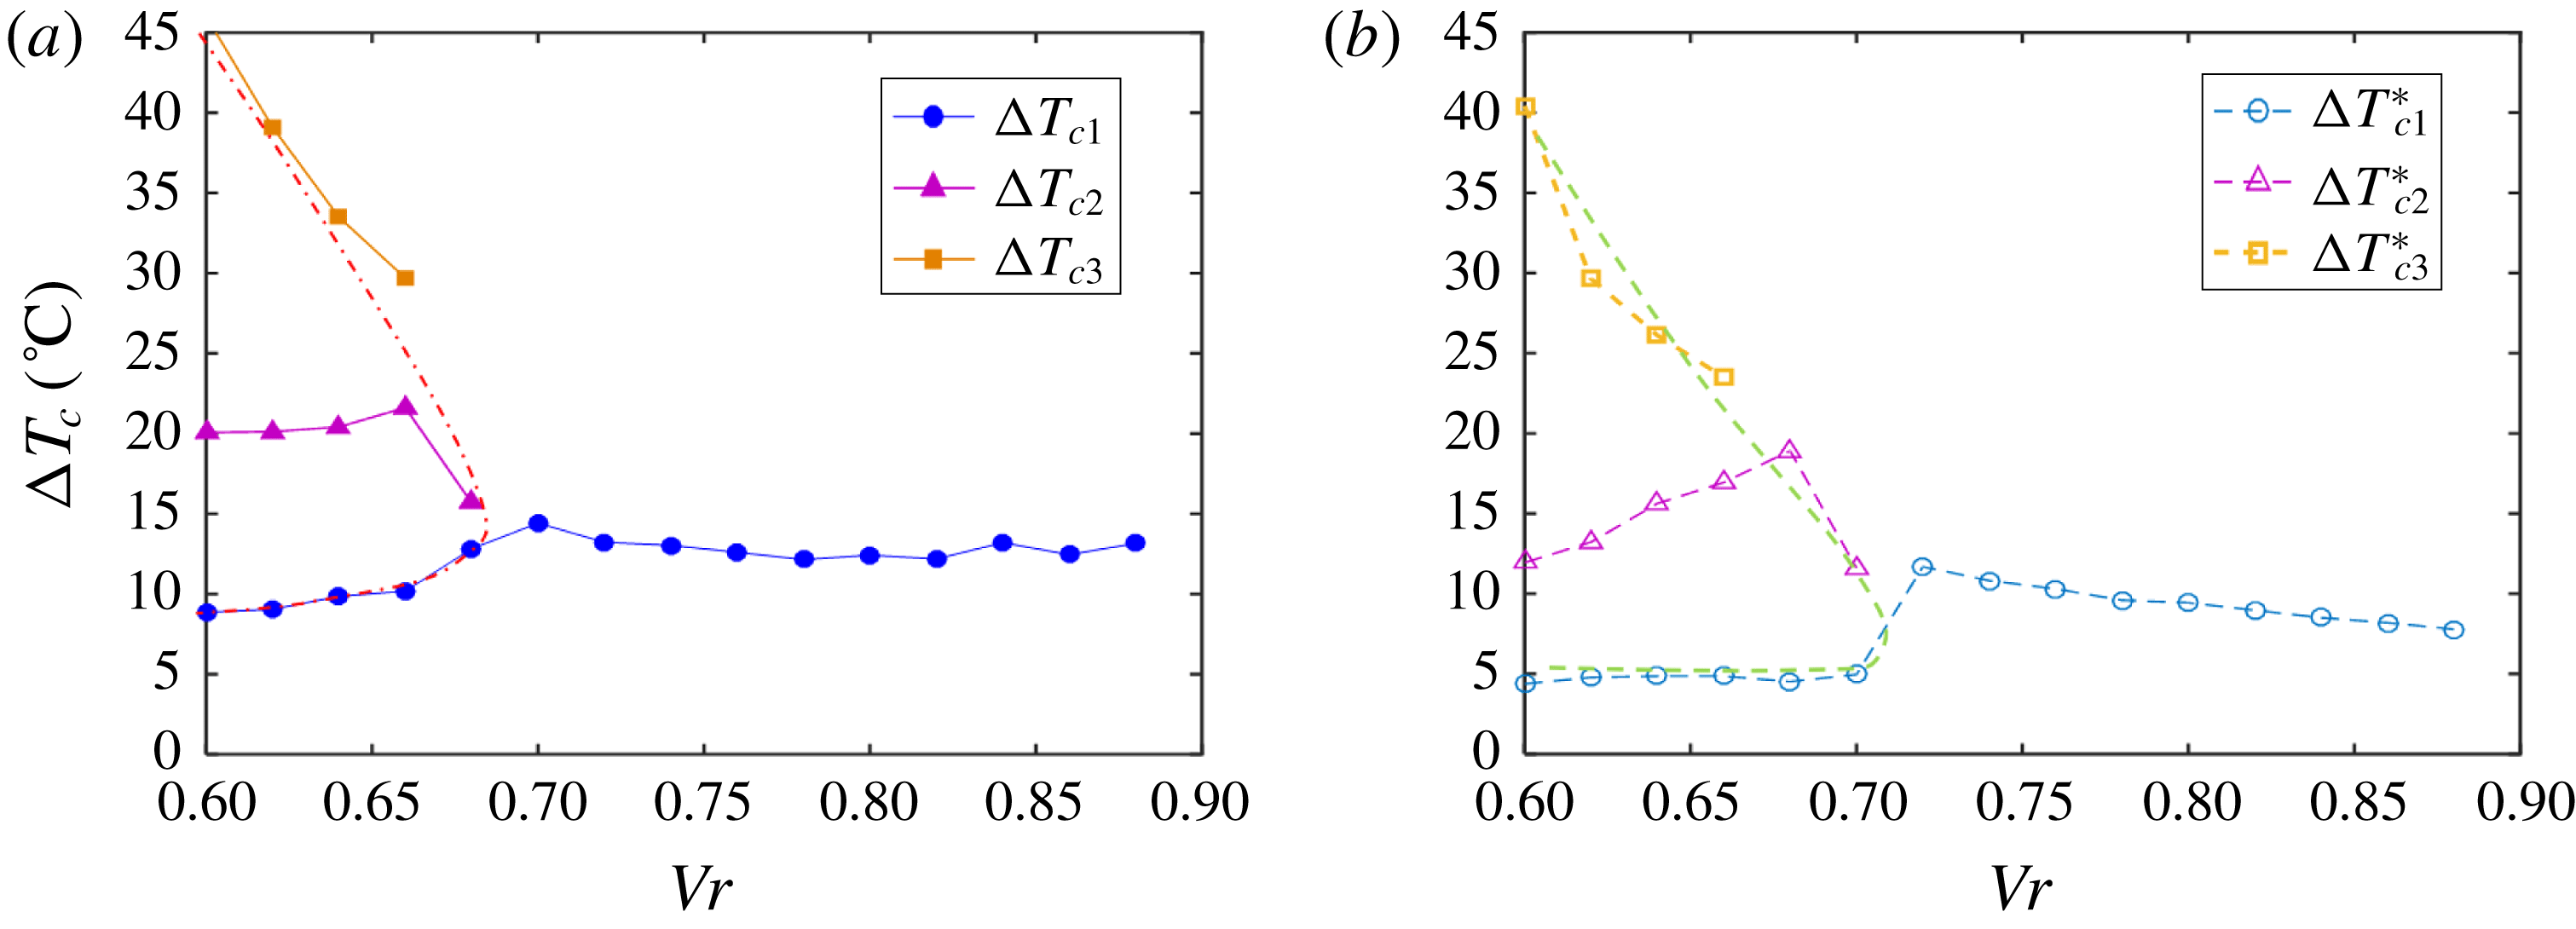
Because the heating rate effect has an inhibitory effect on the oscillation process of thermocapillary convection, studying critical conditions of thermocapillary convection in the cooling process is closer to the condition in theory. The heating experiments and cooling experiments are carried out simultaneously in liquid bridges with
 $Ar=0.9$
, with the heating or cooling rate being
 $0.3\,^{\circ }\text{C}~\text{min}^{-1}$
. Three transition points have been obtained, as shown in figure 20. The configuration of neutral stability curves of the heating process and that of the cooling process are by and large the same. The critical temperature differences in the cooling process are generally lower than in the heating process (approximately
 $5\,^{\circ }\text{C}$
).
During the heating process, the critical temperature difference of low-frequency mode (
 $\unicode[STIX]{x0394}T_{c1}$
) increases significantly near the critical volume ratio
 $Vr_{c}$
under the influence of heating rate, and as a result, the jump change at the demarcation point of the two branches is not obvious. However, during the cooling process, the critical temperature difference of low-frequency mode (
 $\unicode[STIX]{x0394}T_{c1}^{\ast }$
) hardly increases with the increase of volume ratio, and as a result, there is an obvious jump change at the demarcation point. The critical volume ratios obtained in the heating process are 0.68 and 0.72, and the critical volume ratios obtained in the cooling process are 0.70 and 0.72. The cooling process is closer to the condition of unlimited slow heating rate. In addition, the variation trend of the second critical point in the heating process and that in the cooling process are significantly different.
Critical curves in the heating and cooling processes. (a) Critical curves in the heating process; (b) critical curves in the cooling process.

5 Conclusions
The oscillation mode of thermocapillary convection in the liquid bridge is influenced by the aspect ratio effect, volume ratio effect and heating rate effect.
(i) In the Vr–Ar parametric space, there exist the low-frequency oscillation region and high-frequency oscillation region. The boundary of these two regions is approximately a straight line, which is given by
 $GF=Ar-3.2Vr+1.4=0$
. By introducing the factor of slenderness, we can describe these critical points comprehensively. Therefore, for both aspect ratio effect and volume ratio effect, their critical curves have two branches, and obvious jump changes exist.
(ii) By analysing three transition points in the supercritical case, we can give the complete curves of neutral stability. The two neutral stability curves have an intersection at
$Vr_{c}^{(1)}$
, and the curve of low-frequency mode is a ‘’ type curve, and its maximum value of volume ratio is$Vr_{c}^{(2)}$
. Thus, not only the jump change of the critical temperature difference, but also the multiple transitions from low-frequency mode to high-frequency mode can be explained by the configuration of neural stability curves. (1) When
$Vr<Vr_{c}^{(1)}$
, the transition sequence is: steady state
$\rightarrow$
low-frequency oscillation mode
$\rightarrow$
mixed oscillation mode
$\rightarrow$
high-frequency oscillation mode. (2) When
$Vr\approx Vr_{c}^{(1)}$
, the transition sequence is: steady state
$\rightarrow$
low-frequency oscillation mode
$\rightarrow$
high-frequency oscillation mode. (3) When
$Vr_{c}^{(1)}<Vr<Vr_{c}^{(2)}$
, the transition sequence is: steady state
$\rightarrow$
low-frequency oscillation mode
$\rightarrow$
oscillation suspension
$\rightarrow$
high-frequency oscillation mode.(iii) Low-frequency oscillation mode is sensitive to the heating rate. When the heating rate is fast, low-frequency mode does not exist, and thermocapillary convection in the liquid bridge enters into high-frequency oscillation mode directly. Therefore, the fast heating rate leads to a significant increase of the critical temperature difference and the change in oscillation mode. In the cooling process, the inhibitory effect of heating rate on the oscillation mode can be eliminated, thus, a more complete oscillation transition process can be obtained.



To avoid the breakage of the liquid bridge, our space experiment strategy is to finish experiments on ‘safe’ liquid bridges first, so the volume ratios of present experiments are limited to
 $0.54<Vr<1$
. The experiments on ‘fat’ liquid bridges (
 $Vr>1$
) may be carried out at the end of this mission. We expect to find new interesting phenomena with
 $Vr>1$
. In addition, the wave modes, mode transitions and chaotic characteristics need to be further studied.
The original interest in thermocapillary oscillation is provoked by crystal growth, but now we consider it as a physical model for studying thermocapillary flow instability, waves and nonlinearity problems, etc. However, in the perspective of crystal growth, our study gives the implication that the geometry of liquid bridges and the heating rate should be carefully controlled, because they can influence threshold values of oscillations and the oscillatory mode. To avoid striations, the conditions should be controlled below the threshold values of oscillation. A slender liquid bridge, but with
 $Vr>Vr_{c}$
, may be beneficial to the crystal growth, because the critical temperature difference is higher. In addition, if the oscillation occurs, the transition between high and low frequencies may lead to a change in the striation spacing.
Acknowledgements
Q.K. and D.W. are co-first authors. This work is funded by the space experimental project of the China Manned Space Engineering programme, TG-2. There are many participants who have contributed to the work presented in this paper. Besides the authors listed above, J. Zhang, X. Li, etc. many staff members in the Technology and Engineering Center for Space Utilization, CAS, participated in developing the electronic equipment of the space experimental payload, and also took part in the management, organization and technical support of the space experiments: B. Zhou participated the design of the mechanical structure of the payload and L. Li participated the design of the liquid bridge model; Y. Su, S. Zhang, Z. Han, W. Cao, L. Duan, S. Chen and Y. Chen, in our team, participated in the space experiments. Here we would like to express our great appreciation for all the work that has been accomplished by all participants.
Appendix A
On the ground, the heat transfer is mainly in the form of natural convection. However, in the microgravity environment, the heat transfer includes two parts: one is heat diffusion, and the other is heat radiation. The experiment box is simplified as an axisymmetric body, then the temperature distribution in the air around the liquid bridge is as follows:
 $$\begin{eqnarray}\displaystyle T(r)=\frac{T_{s}-T_{0}}{\ln (d/L_{0})}\ln (r/L_{0})+T_{e}, & & \displaystyle\end{eqnarray}$$
where
 $T_{s}$
is the temperature of liquid surface.
So, the heat flux density of the heat transfer at the free surface is calculated as follows:
 $$\begin{eqnarray}\displaystyle Q=-k_{gas}\frac{\text{d}T}{\text{d}r}=-\frac{2k_{gas}}{D\ln (D/L_{0})}(T_{s}-T_{0}), & & \displaystyle\end{eqnarray}$$
where
 $k_{gas}$
is thermal conductivity of air,
 $0.026~\text{W}~\text{m}^{-1}~\text{K}^{-1}$
.
The radiating rate of blackbody radiation is as follows:
 $$\begin{eqnarray}\displaystyle Q=\unicode[STIX]{x1D6FF}(T_{s}^{4}-T_{0}^{4}), & & \displaystyle\end{eqnarray}$$
where
 $\unicode[STIX]{x1D6FF}$
is Stefan–Boltzmann constant of the blackbody radiation, and its value is
 $5.67\times 10^{-8}~\text{W}~\text{m}^{-2}~\text{K}^{-4}$
.
The coefficient of heat transfer of the free surface is
 $$\begin{eqnarray}\displaystyle h=\frac{2k_{g\text{a}s}}{D\ln (D/L_{0})}+\unicode[STIX]{x1D6FF}(T_{s}^{2}+T_{0}^{2})(T_{s}+T_{0})=7.40~\text{W}~\text{m}^{-2}~\text{K}^{-1}. & & \displaystyle\end{eqnarray}$$
So, the Biot number of the free surface is estimated to be 1.2.