INTRODUCTION
The concept of “cognitive reserve” (CR) has been advanced as a potential explanation for individual variability in the relationship between brain pathology and symptomatology (Stern, Reference Stern2002), and is often used as an explanatory framework for protection from dementia and cognitive decline. Threshold models of CR, such as brain reserve capacity (BRC), assert that those with larger brain sizes have more synapses to lose before they reach a critical threshold for disease expression. However, they fail to fully account for a number of factors, including normal age-associated declines in cognition (Salthouse et al., Reference Salthouse, Berish and Siedlecki2004), individual differences in how cognitive or functional tasks are processed by brains affected by neurodegeneration (Stern, Reference Stern2009), and processing efficiency in healthy brains. Conversely, active models view CR as the use of differential brain networks or alternative cognitive strategies to maximize performance (Stern, Reference Stern2002), suggesting that CR is evident in both healthy individuals and those with varying degrees of brain damage. Thus, an active model of CR may be better placed to account for individual differences in healthy age-related cognitive decline. In particular, Stern’s (Reference Stern2009) “neural reserve” subtype of active CR emphasizes the role of individual differences in efficiency, capacity, and flexibility of cognitive networks in protection against the impact of brain changes. The “neural compensation” subtype refers to instances where brain pathology interferes with standard cognitive networks and requires the recruitment of alternative compensatory networks. In this sense, CR can be viewed as the brain’s capacity to actively compensate for advancing brain pathology and minimize symptom expression in both healthy ageing and dementia.
CR is a latent construct, meaning that it can only be measured indirectly (Whalley et al., Reference Whalley, Deary, Appleton and Starr2004). It is traditionally measured using environmental enrichment factors as proxies (e.g., educational attainment, occupational attainment, premorbid intelligence quotient [IQ], or social and mental engagement) and has been associated with a lower dementia risk (Valenzuela & Sachdev, Reference Valenzuela and Sachdev2006). Possible mechanisms by which increased levels of knowledge can offer protection include superior schematic organizational structuring of information, enhanced problem-solving skills, and more efficient and reliable algorithms to reduce processing requirements (Salthouse, Reference Salthouse, Staudinger and Lindenberger2003). For example, studies on expertise have demonstrated how domain-specific knowledge is organized into hierarchical schemas that can operate automatically with practice over time (Kotovsky et al., Reference Kotovsky, Hayes and Simon1985). Similarly, higher levels of education may increase connectivity between frontal, temporal, and parietal lobes in healthy older adults (Arenaza-Urquijo et al., Reference Arenaza-Urquijo, Landeau, La Joie, Mevel, Mézenge, Perrotin and Chételat2013), while mental exercise through a stimulating occupation or pastime may form new connections between neurons, leading to more efficient and flexible cognitive networks (Salthouse, Reference Salthouse2006). However, the assertion that these proxy measures are protective in cognitive decline and dementia is questionable as these observations may have resulted from differences in cognitive functioning that existed since earlier adulthood and childhood (Deary et al., Reference Deary, Whiteman, Starr, Whalley and Fox2004; Tucker-Drob et al., Reference Tucker-Drob, Johnson and Jones2009).
Active CR offers a promising paradigmatic approach to understanding and measuring CR, although its construct validity has been questioned due to the myriad CR indicators used across studies and lack of clear organizational structure in which to group them (Jones et al., Reference Jones, Manly, Glymour, Rentz, Jefferson and Stern2011; Satz et al., Reference Satz, Cole, Hardy and Rassovsky2011). Jones et al. (Reference Jones, Manly, Glymour, Rentz, Jefferson and Stern2011) warn that there is ambiguity surrounding the use of single indicators as proxies for CR as any individual measure may predict cognitive ageing for reasons other than protection from the expression of neuropathology. Instead, the authors recommend a multiple indicator method, where shared variance between several candidate CR measures is used to infer a latent CR variable. Broadening the scope of CR beyond simple demographic proxies to include cognitive functions could assist in developing a comprehensive model of CR that is empirically testable to determine construct validity (Siedlecki et al., Reference Siedlecki, Stern, Reuben, Sacco, Elkind and Wright2009).
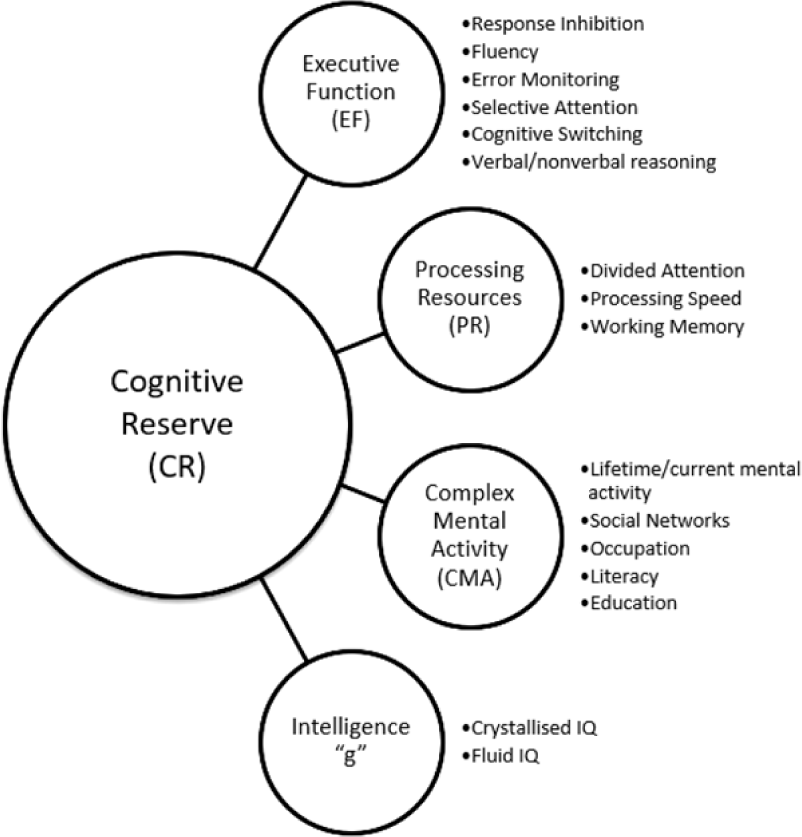
Stern’s neural reserve theory posits that more efficient cognitive networks can protect against the impact of brain changes due to ageing or pathology. This foregrounds the potential role of higher-order executive processes in CR, as neural reserve operates by allowing greater flexibility in network selection – an ability believed to be captured by executive function (EF) tasks (Tucker & Stern, Reference Tucker and Stern2011). Along with traditional lifestyle-based proxy indicators of CR, Satz et al. (Reference Satz, Cole, Hardy and Rassovsky2011) have proposed three cognitive domains that represent proxies of CR capacity: EF, processing resources (PR), and intelligence (IQ) (Figure 1). The authors present evidence for an overlap between these constructs and argue that they must be included in empirically testable models of CR to establish construct validity. There is evidence of overlap between traditional CR proxies, such as education, and cognitive constructs, such as EF, PR, and IQ (Bennett et al., Reference Bennett, Schneider, Wilson, Bienias and Arnold2005, Reference Bennett, Schneider, Tang, Arnold and Wilson2006; Siedlecki et al., Reference Siedlecki, Stern, Reuben, Sacco, Elkind and Wright2009), as well as overlap between these cognitive constructs themselves (Boyle et al., Reference Boyle, Wilson, Schneider, Bienias and Bennett2008; Bryan & Luszcz, Reference Bryan and Luszcz2000; Salthouse & Davis, Reference Salthouse and Davis2006). Recent research addressed this by examining the factor structure of traditional proxy CR indicators in relation to cognitive functions in order to validate a model of cognitive domains and CR (Mitchell et al., Reference Mitchell, Shaughnessy, Shirk, Yang and Atri2012). A priori, CR was considered distinct from other cognitive domains in the model. The model was tested using confirmatory factor analysis (CFA) in healthy older adults and older individuals with memory impairment. Results supported the construct validity of a CR factor as distinct from a processing speed/EF factor. Notably, there was a moderate positive correlation between the two factors in both healthy adults (r = .431) and those with memory impairment (r = .433), indicating shared variability. This highlights the need for empirical investigation into the precise nature of these relationships.
A hypothesized four-factor model of CR capacity. This model comprises subfactors of the CR construct, as proposed by Satz et al. (Reference Satz, Cole, Hardy and Rassovsky2011).
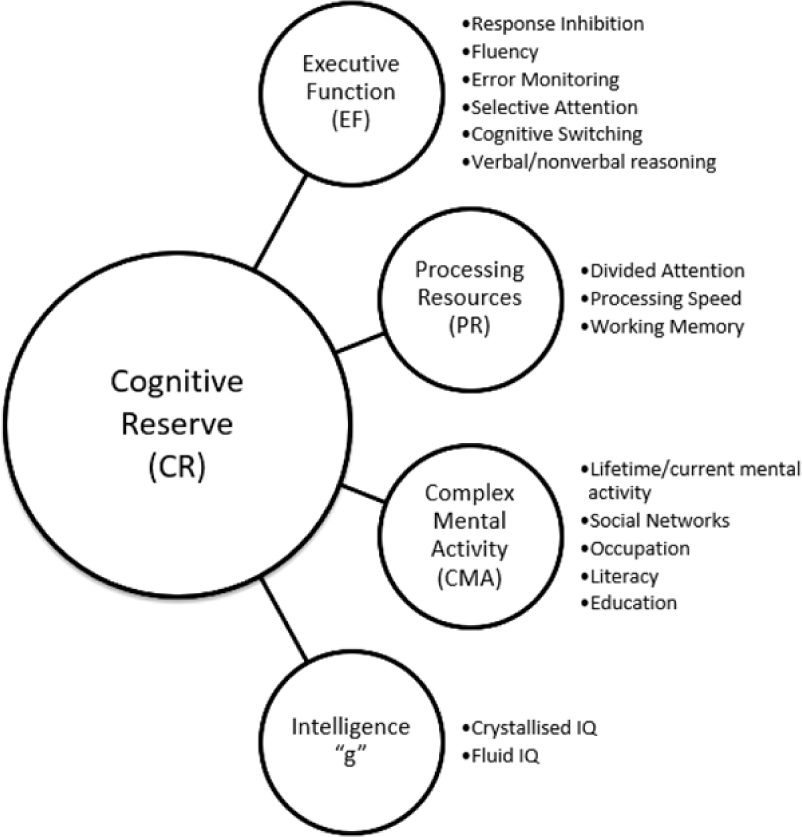
The Satz et al. (Reference Satz, Cole, Hardy and Rassovsky2011) model is proposed for testing without any a priori hypotheses regarding discriminant validity, and as such, the data-driven approach of exploratory factor analysis (EFA) to determine groupings of indicators is recommended, followed by hypothesis testing using the theory-driven approach of CFA. The aim of this study was to investigate the construct validity of a four-factor CR capacity model proposed by Satz et al. (Reference Satz, Cole, Hardy and Rassovsky2011) using this approach. As the authors do not explicitly define what they meant by “CR capacity,” for the purposes of this research, it will be interpreted similarly to Baltes (Reference Baltes1987) as the overall learning potential or plasticity of an individual’s cognitive system. Building on this interpretation, while also considering Stern’s (Reference Stern2009) definition of neural reserve, CR capacity can be viewed as the maximum cognitive processing potential of neural systems that support adaptive cognitive performance in the face of age-related decline. The hypothetical CR capacity subcomponents include (1) EF – response inhibition, fluency, error monitoring, selective attention, cognitive switching, and reasoning; (2) processing resources (PR) – divided attention, processing speed, and working memory; (3) complex mental activity (CMA) – engagement in cognitively stimulating activities, social networks, education, literacy, and occupation; and (4) intelligence (IQ) – fluid and crystallized IQ. Empirically testing this model could help to further clarify the status of these hypothesized constructs in terms of convergent and discriminant validity.
METHOD
Participants
To test the initial models, a sample was selected from the baseline wave of the Maastricht Ageing Study (MAAS), a longitudinal study on the determinants of cognitive ageing (Jolles et al., Reference Jolles, Houx, Van Boxtel and Ponds1995). To validate the models, a sample was selected from the baseline wave of the Irish Longitudinal Study on Ageing (TILDA) (Kearney et al., Reference Kearney, Cronin, O’Regan, Kamiya, Savva, Whelan and Kenny2011), a population-representative prospective study of community-dwelling adults in Ireland.
MAAS data were accessed through collaboration with the In-MINDD study (www.inmindd.eu). The sample consisted of 1823 participants, stratified by age (range 24–82 years), sex, and general ability level, drawn from the Registration Network of Family Practices in the Netherlands (Jolles et al., Reference Jolles, Houx, Van Boxtel and Ponds1995; RNH; Metsemakers et al., Reference Metsemakers, Höppener, Knottnerus, Kocken and Limonard1992). Exclusion criteria included medical problems that may interfere with cognitive functioning, such as a history of dementia, Parkinson’s disease, and use of psychotropic medication. Individuals whose education/occupation was unknown, or who never held a formal occupation, were excluded (n = 236). A further nine participants who converted to dementia during the course of the 12-year study were excluded. Those aged <50 were excluded from analyses as the focus was on an ageing population. The final sample comprised 777 individuals (457 male; 320 female).
TILDA data were accessed through the Irish Social Science Data Archive (www.ucd.ie/issda). The TILDA sampling methodology has been described in detail elsewhere (Kearney et al., Reference Kearney, Cronin, O’Regan, Kamiya, Savva, Whelan and Kenny2011). The sample consisted of 8504 participants. Those aged <50 years were excluded (n = 341). Those aged ≥80 years were also excluded as these participants had been group coded as “80+,” and precise age was unclear. A further 3293 participants whose level of education and/or occupational attainment were unknown, or who never held a formal occupation, were excluded. An additional 1257 participants with a score <24 on the Mini-Mental State Examination (MMSE), or an unknown MMSE score, were also removed. The final sample involved 3351 individuals (1703 male; 1648 female).
The MAAS study was approved by the medical ethics committee of the Maastricht University Medical Center; and the TILDA study by the Faculty of Health Sciences Research Ethics Committee of Trinity College, Dublin. All participants provided written informed consent. Secondary analyses of datasets were approved by Dublin City University Research Ethics Committee.
Measures of CR Capacity
Several indicators were identified in MAAS that were potentially reflective of the four cognitive domains specified by Satz et al. (Reference Satz, Cole, Hardy and Rassovsky2011). Measures were selected from TILDA that were similar to the indicators used in the MAAS data analyses (see Table 1; see Supplementary material for a detailed description of measures).
CR capacity model indicators in MAAS and TILDA

SART = Sustained Attention to Response Task; CTT = Colour Trails Tasks 1 and 2; LDMT = Letter-Digit Modalities Task; CRT = Choice Reaction Time Test; WLT = Word Learning Test; WLLT = Word List Learning Test; GIT = Groningen Intelligence Test ; TILDA = Irish Longitudinal Study on Ageing; EF = executive function; PR = processing resources; CMA = complex mental activity; IQ = intelligence.
a For the TILDA CFA validation, measures were selected based on the factor structure that emerged from the iterative processes of EFA in MAAS data, and as a result, not all measures in the hypothetical four-factor model tested using MAAS data were selected for the TILDA CFA.
MAAS Measures
EF measures
To measure selective attention (STR3), response inhibition (STR-RI), and error monitoring (STR3-SC; based on the number of spontaneous corrections made if the participant noticed an error), the Stroop Colour-Word Test (Stroop, Reference Stroop1935; van der Elst et al., Reference van der Elst, van Boxtel, van Breukelen and Jolles2006c) was used. For semantic fluency, the Fluency test (animals) (Lezak et al., Reference Lezak, Loring and Howieson2004; van der Elst et al., Reference van der Elst, van Boxtel, van Breukelen and Jolles2006a) was used; and for cognitive switching, the Concept Shifting Test (CST) (van der Elst et al., Reference van der Elst, van Boxtel, van Breukelen and Jolles2006b; Vink & Jolles, Reference Vink and Jolles1985) was used.
Processing resource measures
To measure processing speed, the Letter-Digit Modalities Test (LDMT), an adapted version of the Digit-Symbol Substitution Test (Smith, Reference Smith and Hellmuth1968), was used. The 15-Word Learning Test (WLT) (Brand & Jolles, Reference Brand and Jolles1985; van der Elst et al., Reference van der Elst, van Boxtel, van Breukelen and Jolles2005), a test of immediate recall, tapped into short-term memory. According to Kane and Engle (Reference Kane and Engle2002), the representational components of short-term memory plus a general executive attention component are involved in working memory capacity. Traditionally, “span” tasks have been used as measures of working memory. As this immediate recall task was the closest to a measure of working memory available, it was used as a measure of immediate working memory. This is in line with previous research using MAAS data, where 15-WLT was used as a measure of passive working memory (van Gerven et al., Reference van Gerven, van Boxtel, Meijer, Willems and Jolles2007).
Measures of CMA were Level of Education on an eight-point scale, and Occupational Attainment (Directoraat-Generaal voor de arbeidsvoorziening, 1989) on a seven-point scale. Measures of intelligence were two subtests of the Groningen Intelligence Test (GIT) (Luteijn & Van der Ploeg, Reference Luteijn and Van der Ploeg1983). The vocabulary subtest measured crystallized IQ (GIT2), and the mental rotation subtest measured fluid IQ (GIT3).
It was not possible to include measures for five of the CR capacity indicators specified in Satz et al.’s (Reference Satz, Cole, Hardy and Rassovsky2011) model. Three of the CMA indicators (lifetime/current mental activity, social networks, and literacy) were either unavailable at baseline or were only administered to a small group. Measures for divided attention (a PR indicator) and reasoning (an EF indicator) were administered to a small proportion of the participant pool and were not suitable for analysis.
TILDA Measures
As TILDA data were used for model validation, measures were selected based on the factor structure that emerged from the iterative process of EFA using MAAS data. Consequently, not all measures in the hypothetical four-factor model were selected. EF measures were the Sustained Attention to Response Task (SART) (Robertson et al., Reference Robertson, Manly, Andrade, Baddeley and Yiend1997) as a measure of response inhibition, the Fluency test (animals) (Barrett et al., Reference Barrett, Burke, Cronin, Hickey, Kamiya, Kenny and Whelan2011) for verbal fluency, and the Colour Trails Tasks 1 and 2 (CTT1 and CTT2) (D’Elia, Reference D’Elia1996), which were used to derive a measure of cognitive switching (CTT). Measures of PR were Choice Reaction Time (CRT) (Cronin et al., Reference Cronin, O’Regan, Finucane, Kearney and Kenny2013; Schneider et al., Reference Schneider, Eschman and Zuccolotto2002) for processing speed, and the Word List Learning Test (WLLT) as a measure of immediate working memory. CMA measures were Level of Education on a seven-point scale, and Occupational Attainment on a six-point scale. A measure of crystallized IQ was unavailable in TILDA.
Statistical Analysis
Using MAAS data, EFA and CFA were conducted to investigate the construct validity of a four-factor CR capacity model. Both sample size (≥10 participants per variable) and independence of measures were considered when evaluating the appropriateness of the data (Tinsley & Tinsley, Reference Tinsley and Tinsley1987). Dependency can occur when component scores and their composite scores are included in the same analysis. As the measure for response inhibition (STR-RI) was derived from an equation using the measure of selective attention (STR3), STR3 was removed prior to analysis. Kolmogorov–Smirnov (K–S) tests of normality were conducted on all measures. As most measures deviated from the normal distribution (p’s < .001), an estimator robust to the effects of non-normality, Robust Weighted Least Square (WLSMV), was used, followed by oblique rotation (promax with Kaiser normalization) to achieve simple structure. Ten CR model indicators were subjected to WLSMV extraction to assess the dimensionality of the data. Factor retention was determined based on factor eigenvalues (>1) and examination of a scree plot. Items with high loadings (≥.4) on more than one factor (cross-loadings) and items with small loadings (<.4) on all factors were eliminated from the analysis (Matsunaga, Reference Matsunaga2010). CFA (WLSMV estimation) was conducted using MAAS data to tentatively confirm the factor structure from EFA. Model acceptability was evaluated by overall goodness of fit and the interpretability and statistical significance of the resulting parameter estimates (Brown, Reference Brown2006). Fit indices and their recommended cut-off values were as follows: χ2 index of absolute model fit (insignificant at a threshold of .05; Barrett, Reference Barrett2007), weighted root mean square residual (WRMR) (<1.0; Hancock & Mueller, Reference Hancock and Mueller2013), root mean square error of approximation (RMSEA) and its 90% confidence interval (90% CI) (between .05 and .08; Browne & Cudeck, Reference Browne, Cudeck, Bollen and Long1993), comparative fit index (CFI), and Tucker–Lewis index (TLI) (both >.90; Bentler & Bonett, Reference Bentler and Bonett1980). To validate the MAAS CFA, a secondary CFA was conducted using TILDA data. K–S tests of normality revealed that most measures deviated from the normal distribution (p’s < .001); therefore, WLSMV estimator was used. Model acceptability was evaluated as in the MAAS CFA. All analyses were conducted using Mplus version 7.3 (Muthén & Muthén, Reference Muthén and Muthén2011).
RESULTS
Descriptive Statistics
Tables 2 and 3 contain MAAS and TILDA descriptive statistics for the samples on demographic and neuropsychological measures. For ease of interpretation, the five variables measured in time scale (Stroop Colour Word Test, CST, SART, Colour Trails Task, and Choice Reaction Time task) were reverse-scored so that a high score represented better performance. Table 4 compares MAAS and TILDA participants on demographic variables and neuropsychological measures. As most neuropsychological measures had different units of measurement, a direct statistical comparison was only conducted for fluency (name as many animals as possible in 1 min). There were significant differences (p’s < .001) between the groups in age (MAAS: 64.14 years; TILDA: 62.60 years), MMSE score (MAAS: 27.99; TILDA: 28.73), and fluency (MAAS: 22.45; TILDA: 21.54), with MAAS participants being slightly older with marginally lower MMSE scores and marginally higher fluency scores. Education was at the secondary level for both groups.
MAAS descriptive statistics of CR capacity measures

LDMT = Letter-Digit Modalities Task; CST = Concept Shifting Test; WLT = Word Learning Test; CMA, Complex Mental Activity.
Scores for STR-RI and CST were reversed so that high scores represent better performance.
TILDA descriptive statistics of CR capacity measures

SART = Sustained Attention to Response Task; CTT = Colour Trails Tasks 1 and 2; CRT = Choice Reaction Time Test; WLLT = Word List Learning Test.
Scores for SART, CTT, and CRT were reversed so that high scores represent better performance.
Comparison of MAAS and TILDA participants on demographic and neuropsychological variables

MAAS = Maastricht Ageing Study; TILDA = Irish Longitudinal Study on Ageing; MMSE = Mini-Mental State Examination.
a Median was reported for categorical variables: level of education, occupational attainment.
b Significant difference between groups (p < .001).
c Leaving certificate equates to higher secondary education.
Exploratory Factor Analysis
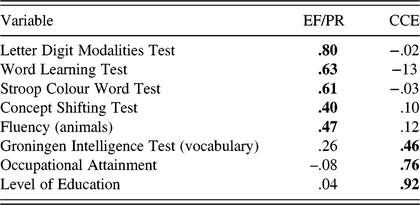
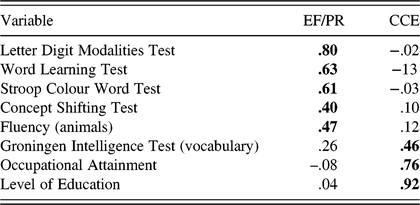
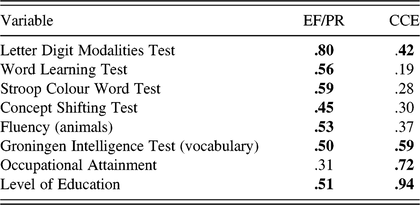
Initial analysis revealed that there were two variables with small loadings on all factors, Stroop Spontaneous Corrections (STR3SC) and GIT–Mental Rotation (GIT3). The GIT3 cross-loaded on both factors, with factor loading values <.4. These variables were removed and analysis was re-run for a more refined solution (Pett et al., Reference Pett, Lackey and Sullivan2003). In keeping with convention and simplicity, the pattern matrix, which represents unique relationships uncontaminated by the correlation between factors, was interpreted with reference to the correlations between variables and factors found in the structure matrix (Tabachnick & Fidell, Reference Tabachnick and Fidell2006) (see Appendix A). Two factors were extracted: factor 1 included five measures – the Letter Digit Modalities Test, WLT, Stroop Colour Word Test, CST, and Fluency (animals); factor 2 included three measures – the GIT (vocabulary), Level of Education, and Occupational Attainment. As the EF and PR indicators loaded together on factor 1, this suggests they together represent an EF/processing resources (PR) factor. The CMA indicators (Level of Education and Occupational Attainment) and IQ indicator (crystallized IQ) loaded together on factor 2, and can be viewed as experiential resources that enrich cognition throughout the lifespan, therefore representative of a cumulative cognitive enrichment (CCE) factor.
CFA in MAAS
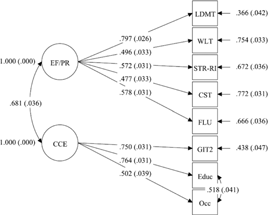
A two-factor model was specified in which processing speed (LDMT), working memory (WLT), response inhibition (STR-RI), cognitive switching (CST), and fluency (FLU) loaded onto the latent variable of EF/PR. Crystallized IQ (GIT2), Level of Education (Educ), and Occupational Attainment (Occ) loaded onto the latent variable CCE. All measurement errors were presumed to be uncorrelated, with the exception of level of education and occupational attainment to account for the relatively high correlation between these variables (r = .652, p < .001). Theoretically, allowing their measurement error to correlate is prudent as they were both measured on a similar Likert scale and may therefore display common method variance (Brown, Reference Brown2006).
The χ2 index of absolute model fit indicated that the model did not fit the data well (χ2(18) = 71.116; p < .001). However, all other goodness-of-fit indices examined suggest that the two-factor model fit the data reasonably well: RMSEA = .062; 90% CI = .047, .077; TLI = .956; CFI =.972; WRMR = .807. Inspection of modification indices indicated several points of ill-fit. However, as parameters should not be freed with the sole intention of improving model fit (Brown, Reference Brown2006), no re-specifications were made. Additionally, the CFA was re-run separately for male and female participants to ensure the factor structure held for both, and it was found that model fit, with the exception of χ2, was good for both males and females. When broken out into age groups (50–65 and 65–82 years), again with the exception of χ2, fit remained good for both; therefore, the dual-factor structure was retained.
The completely standardized parameter estimates from the solution on the full sample are presented in Figure 2 and Table 5. All freely estimated unstandardized parameters were significant (p’s < .001), and estimates from the two-factor solution indicated a strong relationship between EF/PR and CCE (r = 681). Convergent validity was assessed by examining the significance and magnitude of factor loading of each indicator on its purported latent factor (Anderson & Gerbing, Reference Anderson and Gerbing1988). Factor loading estimates revealed that the indicators were moderately to strongly related to their latent factors (range of R 2 = .228–.635). This indicated convergent validity of the model. Discriminant validity was investigated by testing to see if the CI (±2 standard errors) for the standardized correlation estimate between the two factors included the value of 1.0 (Anderson & Gerbing, Reference Anderson and Gerbing1988). This analysis supported the discriminant validity of the factors as the CI for this correlation did not contain the value of 1.0 (.622, .740).
MAAS two-factor model of CR capacity including standardized parameter estimates. The MAAS CR capacity model results: results of CFA on EF/PR and CCE factors in a group of healthy older adults (n = 777). χ2 = 71.116, df = 18, RMSEA = .062, TLI = .956, CFI = .972, WRMR = .807. Variables in boxes represent observed measures; variables in circles represent latent variables; numbers along straight arrows represent completely standardized parameter estimates; standard errors of the estimates for the completely standardized solution are reported in parentheses; numbers along curved arrows represent correlation between latent variables and correlations between indicator variables. EF/PR = executive function/processing resources; CCE = cumulative cognitive enrichment; LDMT = Letter-Digit Modalities Task (processing speed); WLT = Word Learning Test (immediate working memory); STR-RI = Stroop Colour Word Test (response inhibition); CST = Concept Shifting Test (cognitive switching); FLU = Fluency (verbal fluency); GIT2 = Groningen Intelligence Test (crystallized IQ); Educ = Level of Education; Occ = Occupational Attainment.

MAAS parameter estimates from the two-factor CFA model of EF/PR and CCE

CFA = confirmatory factor analysis; EF = executive function; PR = processing resources; CCE = cumulative cognitive enrichment; Educ = level of education; Occ = occupational attainment; estimates = unstandardized parameter estimates; S.E. = standard error; Est./S.E. = test statistic (z-value); Std = standardized parameter estimate; StdYX = completely standardized parameter estimate; R 2 = square of the completely standardized parameter estimate.
CFA: Validation in TILDA
To validate the model of CR capacity tentatively established using MAAS data, a secondary CFA was conducted using TILDA data. A two-factor model was specified in which processing speed (CRT), immediate working memory (WLLT), response inhibition (SART), cognitive switching (CTT), and fluency (FLU) loaded onto the latent variable of EF/PR. Level of Education (Educ) and Occupational Attainment (Occ) loaded onto the latent variable of CCE. In the MAAS model, the error terms for level of education and occupational attainment were allowed to correlate due to the relatively strong relationship between these variables. In TILDA there was also evidence for a strong relationship between these variables (r = .559, p < .001); however, as education and occupation were the only two indicators for the CCE latent variable, allowing their error terms to correlate was problematic for model identification. For identification, at least two indicators are required per latent variable, and those indicators’ errors must be uncorrelated. Therefore, all measurement errors were presumed to be uncorrelated for the TILDA CFA (Kenny, Reference Kenny2011).
As in MAAS, the χ2 index of absolute model fit indicated that the model did not fit the data well (χ2(13) = 100.526, p < .001). The WRMR value of 1.159 supported this finding. However, all other goodness-of-fit indices suggest that the two-factor model fit the data very well: RMSEA = .045; 90% CI = .037, .053; TLI = .973; CFI = .983. The completely standardized parameter estimates from this solution are presented in Figure 3 and Table 6. All freely estimated unstandardized parameters were significant (p’s < .001), and estimates indicated a strong relationship between EF/PR and CCE (r = .592). Convergent and discriminant validity were assessed as per the procedure with MAAS. Factor loading estimates revealed that the indicators were moderately to strongly related to their latent factors (range of R 2 =.172–.899), indicating convergent validity. Discriminant validity of the factors was supported as the CI surrounding their correlation did not contain the value of 1.0 (.559, .624).
TILDA two-factor model of CR capacity including standardized parameter estimates. The TILDA CR capacity model validation results: results of CFA on EF/PR and CCE factors in a group of healthy older adults (n = 3351). χ2 = 100.526, df = 13, RMSEA = .045, TLI = .973, CFI = .983, WRMR = 1.159. Variables in boxes represent observed measures; variables in circles represent latent variables; numbers along straight arrows represent completely standardized parameter estimates; standard errors of the estimates for the completely standardized solution are reported in parentheses; numbers along curved arrows represent correlation between latent variables and correlations between indicator variables. EF/PR = executive function/processing resources; CCE = cumulative cognitive enrichment; CRT = Choice Reaction Time (processing speed); SART = Sustained Attention to Response Task (response inhibition); CTT = Colour Trails Test (cognitive switching); FLU = Fluency (verbal fluency); WLLT = Word List Learning Test (immediate recall); Educ = Level of Education; Occ = Occupational Attainment.

TILDA parameter estimates from the two-factor CFA model of EF/PR and CCE

Estimates = unstandardized parameter estimates; S.E. = standard error; Est./S.E. = test statistic (z-value); Std = standardized parameter estimate; StdYX = completely standardized parameter estimate; R 2 = square of the completely standardized parameter estimate; Educ = level of education; Occ = occupational attainment; EF = executive function; PR = processing resources; CCE = cumulative cognitive enrichment.
DISCUSSION
This study investigated the construct validity of CR through an exploration and confirmation of the organizational structure of indicators hypothesized to contribute to CR capacity using data from two ageing studies, MAAS and TILDA. EFA allowed for the exploration and refinement of the factor structure of Satz et al.’s (Reference Satz, Cole, Hardy and Rassovsky2011) proposed four-factor model, and a two-factor underlying structure was established on both theoretical and empirical grounds. The first factor’s loading items suggest it represents a latent construct of EF/PR and reflects an amalgamation of the proposed indicators for Satz et al.’s hypothesized factors of EF and PR. These results are in keeping with the hypothesis that there would be some degree of overlap between these constructs (Boyle et al., Reference Boyle, Wilson, Schneider, Bienias and Bennett2008; Mitchell et al., Reference Mitchell, Shaughnessy, Shirk, Yang and Atri2012; Salthouse & Davis, Reference Salthouse and Davis2006). The second factor suggested a latent construct of CCE. There is a well-established relationship between demographic variables, such as education and occupation, and crystallized abilities (Crawford et al., Reference Crawford, Stewart, Cochrane, Foulds, Besson and Parker1989; Potter et al., Reference Potter, Helms and Plassman2008), and so it is unsurprising that the crystallized IQ measure loaded on a factor with measures such as these. These categorizations represent a distinction between two types of cognition, and are analogous to categories put forward by Baltes (Reference Baltes1993) and Salthouse (Reference Salthouse2006). Baltes proposed two categories of cognitive function that correspond with the EF/PR and CCE factors, respectively: cognitive mechanics, comparable to fluid abilities, and determined by neurophysiology; and cognitive pragmatics, comparable to crystallized abilities, and reflective of culture. Similarly, Salthouse presents a distinction between process measures that reflect the efficiency of information processing and cognitive function at the time of assessment (similar to EF/PR), and product measures that reflect the cumulative products of processing over the lifespan (similar to CCE).
The initial CFA was conducted using MAAS data, with a secondary CFA using TILDA data, to evaluate the prespecified factor solution. For both CFAs, overall goodness-of-fit statistics suggested that the model fit the data well. However, the χ2 index of absolute model fit was poor. χ2 is rarely used in applied research as a sole index of fit (Brown, Reference Brown2006), and it has been suggested that its value is often poor in sample sizes >400 (Kenny, Reference Kenny2015). As such, a range of fit indices were taken into account when evaluating model fit.
Interpretation of the parameter estimates in both CFAs revealed that, as expected, estimates were positively related to the latent factor on which they loaded, consistent with the position that the CR capacity indicators are reliable. Examination of the proportion of variance of each indicator explained by its respective factor indicated a strong influence from their underlying latent variables, thus supporting convergent validity. However, the magnitude of factor loadings for each indicator differed slightly between the MAAS and TILDA models. While processing speed was the strongest EF/PR indicator in MAAS, it was the weakest in TILDA. This may be due to differences in the measurement of processing speed (Letter Digit Task vs. Choice Reaction Time). Although both these tasks reflect choice reaction time (Salthouse, Reference Salthouse2000), their administration differed (pen and pencil vs. computerized, respectively). Regardless of some differences in indicator magnitude, both MAAS and TILDA CFAs support the convergent validity of the EF/PR and CCE factors.
Regarding discriminant validity, estimates from the two-factor solutions for both MAAS and TILDA CFAs indicate strong intercorrelations of .681 and .592 between EF/PR and CCE, respectively. Although highly related, these constructs are distinct, as the CIs surrounding these correlations do not contain the value of 1.0 (Anderson & Gerbing, Reference Anderson and Gerbing1988). This can be considered as evidence that the discriminant validity of factors is good, thus supporting the assertion that the latent factors of EF/PR and CCE, although highly related, represent distinct constructs and can theoretically be viewed as each contributing uniquely to CR capacity. These findings support previous research on the construct validity of CR, which concluded that although CR constructs comprising traditional CR measures are highly related to other cognitive constructs, they are distinct. Mitchell et al. (Reference Mitchell, Shaughnessy, Shirk, Yang and Atri2012), when testing a four-factor model of CR and cognitive domains, also found moderate correlations between a “processing speed/EF” factor and a traditional “CR” factor. These are somewhat reflective of the EF/PR and CCE dimensions. Results are also in keeping with the findings of Siedlecki et al. (Reference Siedlecki, Stern, Reuben, Sacco, Elkind and Wright2009) who concluded that a latent, traditional “CR” construct was distinct from cognitive functions. These findings are also supported by Stern’s (Reference Stern2009) theory of neural reserve. As neural reserve operates by facilitating greater flexibility in network selection, an ability believed to be captured by executive processing tasks, a strong relationship between these abilities and traditional CR proxy measures was expected.
This study hypothesized that the distinct, but highly related, EF/PR and CCE factors are both indicators of CR capacity. A theory put forward by Craik and Bialystok (Reference Craik and Bialystok2006) addressing the mechanisms of cognitive change across the lifespan could potentially lend an explanatory framework to the CR capacity model. Under this framework, control processes can be viewed as a set of fluid operations that facilitate intentional processing and adaptive cognitive performance, and are comparative to EF/PR. Representational processes can be viewed as crystallized schemas reflecting knowledge of the world, and are comparative to CCE. Core to this framework is the proposition that these two systems are interactive in the sense that representations of the world are selected based on needs and desires, and in turn, these representations demonstrate control through their influence on further selection of schema-relevant information. The strong correlation between these factors in MAAS and TILDA supports the theory that these processes may have a reciprocal relationship, whereby control processes influence the construction of representations, and in turn, these crystallized representations influence further controlled processing. This framework could potentially be applied to the two-factor CR capacity model, whereby EF/PR can be viewed as a driver of CCE, which in turn feeds back into EF/PR. However, further research using a longitudinal approach is necessary to investigate whether their evolution across the lifespan influences cognitive ability.
The ultimate aim of deriving and validating a theoretical model of CR that includes cognitive functioning is, firstly, to clarify the role of control processes in CR given the lack of consensus regarding its operational definition and, secondly, to inform potential interventions aimed at boosting CR capacity. There are significant differences in the ways CR has been defined by researchers, highlighting the need for clarification of the reserve concept, its measurement, and underlying neural mechanisms if effective interventions are to be developed. The neural mechanisms underpinning CR are often viewed in terms of disease modification and compensation (the ability of the brain to adapt to, or compensate for, age-related changes or pathology), with CR being measured using cognitive activity/lifestyle proxies such as level of education, occupational attainment, social and mental activity, and crystallized IQ (Jones et al., Reference Jones, Manly, Glymour, Rentz, Jefferson and Stern2011; Scarmeas et al., Reference Scarmeas, Zarahn, Anderson, Hilton, Flynn, Van Heertum and Stern2003; Singh-Manoux et al., Reference Singh-Manoux, Marmot, Glymour, Sabia, Kivimäki and Dugravot2011; Solé-Padullés et al., Reference Solé-Padullés, Bartrés-Faz, Junqué, Vendrell, Rami, Clemente and Molinuevo2009; Reed et al., Reference Reed, Dowling, Farias, Sonnen, Strauss, Schneider and Mungas2011; Zahodne et al., Reference Zahodne, Manly, Brickman, Siedlecki, Decarli and Stern2013). Other theoretical approaches view CR mechanisms in terms of individual differences in the efficiency of cognitive networks in healthy ageing and/or disease, with CR being measured using cognitive tasks that reflect the efficiency of functioning (Stern, Reference Stern2009; Tucker-Drob et al., Reference Tucker-Drob, Johnson and Jones2009, Zihl et al., Reference Zihl, Fink, Pargent, Ziegler and Bühner2014). The CR capacity model put forth in this study combines both theoretical approaches in one model, emphasizing that both control and representational process should be taken into account in future CR studies.
In the context of intervention, CR should not be viewed as a fixed trait that is determined early in life, but as a dynamic concept that may be actively enhanced by an individual’s lifestyle (Sattler et al., Reference Sattler, Toro, Schönknecht and Schröder2012). In the proposed dual-model framework of CR capacity, CCE represents the cumulative products of processing over the lifespan (crystallized abilities), and EF/PR reflects cognitive processing at the time of assessment. As such, an intervention based on EF training may, in turn, impact CR capacity in terms of a positive change in current CR status. Cognitive training in healthy elders (aged 50–94 years) and mild cognitive impairment, defined as generally intact everyday function in the face of objective evidence of cognitive decline, (aged 67–81 years) has been shown to have beneficial effects on a broad range of cognitive functions, including memory performance, EF, processing speed, attention, and fluid intelligence (Hill et al., Reference Hill, Mowszowski, Naismith, Chadwick, Valenzuela and Lampit2016; Kelly et al., Reference Kelly, Loughrey, Lawlor, Robertson, Walsh and Brennan2014; Reijnders et al., Reference Reijnders, Van Heugten and Van Boxtel2013), with maximal benefit achieved if training programmes target higher-order cognitive control abilities such as EF and working memory (Buitenweg et al., Reference Buitenweg, Murre and Ridderinkhof2012). There is little evidence for the efficacy of cognitive control training in individuals with dementia (Hill et al., Reference Hill, Mowszowski, Naismith, Chadwick, Valenzuela and Lampit2016), suggesting that targeting this fluid component of CR capacity may be more beneficial with regard to primary and secondary prevention of dementia. However, further research is needed on the efficacy of cognitive control training within this dual-model framework.
This study has several strengths. It assesses a theoretically driven, latent-variable CR capacity model previously untested for construct validity, while also supporting a novel operational definition of CR capacity that includes cognitive function in the measurement model. This is the first time that CR capacity has been modeled in terms of cognitive functions (control processes) and experiential resources (representational processes), and there is a strong explanatory framework within the literature on cognitive function and ageing to suggest that the relationship between these systems can be viewed as reciprocal, whereby control processes determine the construction of representations, and in turn, these representations play a role in further controlled processing (Craik & Bialystok, Reference Craik and Bialystok2006). Large sample sizes and known neuropsychological measures lend support to the reproducibility of the study. The test battery and sample characteristics differed somewhat between MAAS and TILDA; however, the CFA confirmed the same factor structure, supporting the strength of the model in that the underlying theory is not measure- and/or sample-specific. Furthermore, CFA is a flexible modeling approach that allows for the estimation of relationships between variables following adjustment for measurement error, unlike standard correlational and regression approaches where estimates are weakened to an uncertain degree by measurement error in the variables (Brown, Reference Brown2006).
This study was limited in that some of the CR capacity indicators proposed by Satz et al. (Reference Satz, Cole, Hardy and Rassovsky2011) (5 out of 16 indicators) could not be included, as the appropriate measures were unavailable (lifetime/current mental activity; social networks; literacy) or were administered to a very small group (divided attention; reasoning). A further three indicators were removed from analysis during the iterative processes of EFA (selective attention due to dependency; error monitoring and fluid IQ due to small loadings). As a result, it was not possible to test the full model put forward by Satz et al. (Reference Satz, Cole, Hardy and Rassovsky2011). It is likely, however, that measures of social networks, mental activity, and literacy would load on the CCE factor as they can be considered representational processes that contribute to crystallized abilities, and are frequently used traditional CR proxies (Lojo-Seoane et al., Reference Lojo-Seoane, Facal, Guàrdia-Olmos and Juncos-Rabadán2014; Mitchell et al., Reference Mitchell, Shaughnessy, Shirk, Yang and Atri2012; Siedlecki et al., Reference Siedlecki, Stern, Reuben, Sacco, Elkind and Wright2009). Based on previous research, it is likely that indicators such as divided/selective attention, reasoning, and error monitoring would load on the EF/PR factor given the previously demonstrated relationships between these indicators and control processes (Kyllonen & Christal, Reference Kyllonen and Christal1990; Salthouse & Davis, Reference Salthouse and Davis2006; Süß et al., Reference Süß, Oberauer, Wittmann, Wilhelm and Schulze2002). Fluid IQ has also been found to be related to both control processes and representational processes, such as executive abilities, crystallized IQ, education, and occupational attainment (Schooler et al., Reference Schooler, Mulatu and Oates1999; Sternberg et al., Reference Sternberg, Grigorenko and Bundy2001), so it is likely that this indicator would cross-load on both constructs. In fact, the MAAS measure of fluid IQ (GIT3) was found to cross-load on both the EF/PR and CCE factors; however, as the factor loadings were small (<.4), it was removed from the final EFA. Future research, however, should aim to include these measures in a more comprehensive model of CR capacity to clarify these relationships.
The TILDA CFA was limited by the lack of a measure of crystallized IQ in the TILDA dataset. Consequently, only two indicators loaded on the CCE factor. From a theoretical point of view, level of education may be a good proxy of crystallized IQ (Kaufman, Kaufman, Liu, & Johnson, Reference Kaufman, Kaufman, Liu and Johnson2009; Kaufman & Lichtenberger, Reference Kaufman and Lichtenberger2006), and therefore its absence may not change the representational process interpretation of the CCE factor. From a statistical point of view, according to Mitchell et al. (Reference Mitchell, Shaughnessy, Shirk, Yang and Atri2012), having only two factor indicators can place a burden on the data model covariance fit structure. However, in this case, the fit of the model was very good. Also, the error terms for level of education and occupational attainment could not be correlated in the TILDA model due to identification issues (Kenny, Reference Kenny2011). Nevertheless, model fit was good. Finally, the removal of participants with unknown occupational attainment led to a gender imbalance in the final samples, with males being slightly overrepresented in both MAAS and TILDA. This potential source of confounding occurred as the majority of missing data regarding occupation was due to being a spouse who never held a formal occupation.
Future Directions
Future research should aim to include all of Satz et al.’s (Reference Satz, Cole, Hardy and Rassovsky2011) measures in a comprehensive model to help elucidate their influence on the factor structure of the two-factor CR capacity measurement model. Furthermore, the predictive validity of this two-factor measurement model in relation to cognitive outcomes remains unclear. Future research should use longitudinal modeling to investigate the prognostic value of the model regarding performance on global cognition and memory outcomes related to clinical decline. Additionally, a cognitively heterogeneous sample could be used to test the predictive ability of the CR capacity model in response to brain pathology. Finally, longitudinal modeling could also be used to investigate how the relationship between EF/PR and CCE changes and evolves across the lifespan.
CONCLUSIONS
This study demonstrated a novel approach to modeling CR capacity by including measures that represent both control and representational processes. Overall, findings elucidated the relationships between hypothesized indicators of CR capacity, revealed a two-factor structure that includes cognitive functions, and provided evidence for the novel claim that both control and representational processes are involved in CR capacity.
ACKNOWLEDGMENTS
This research was supported by the In-MINDD (Innovative Midlife Intervention for Dementia Deterrence) project. In-MINDD is funded by the European Union’s Framework Programme Seven (FP7) under contract number 304979.
CONFLICTS OF INTEREST
The authors have nothing to disclose.
SUPPLEMENTARY MATERIAL
To view supplementary material for this article, please visit https://doi.org/10.1017/S1355617719000250