


1. Introduction
The Baltic Sea is a unique water body with many specific features. The major factor shaping its coast is wave activity. Although the Baltic Sea does not host significant tides, extensive variations in the water level (e.g. up to 4.21 m over the long-term mean in St Petersburg and up to 2.75m in Pärnu) due to storm surges may occur in this water body (Reference Suursaar, Kullas, Ostsmann, Saaremäe, Kuik and MerilainSuursaar and others, 2006; Reference Schmager, Fröhle, Schrader, Weisse, Muller-Navarra, Feistel, Nausch and WasmundSchmager and others, 2008). Therefore, the particular impact region of waves and the intensity of coastal erosion may vary significantly during storm surges. Although the wave climate is relatively mild in this basin due to limited fetches, occasionally very strong wave storms may occur, with the offshore wave height reaching >9.5 m (Reference Tuomi, Kahma and PetterssonTuomi and others, 2011). The majority of the coast in the eastern part of the Baltic Sea exhibits overall sediment deficiency. This combination of occasional strong wave storms, high surges and sediment deficiency makes this area extremely vulnerable to any changes in hydrodynamics (Reference Eberhards and LapinskisEberhards and Lapinskis, 2008; Reference Kartau, Soomere and TõnissonKartau and others, 2011). In particular, the apparent increase in storminess during the second half of the 20th century (Reference Alexandersson, Schmith, Iden and TuomenvirtaAlexandersson and others, 1998) is believed to be one of the key factors enhancing coastal erosion in this area (Reference Orviku, Jaagus, Kont, Ratas and RivisOrviku and others, 2003).
Recent studies have revealed a clear relationship between ice conditions and coastal processes. The absence of sea and coastal ice in some years generally means an increase in wave action in these years, which in turn usually leads to enhanced erosion of coastal areas of seasonally ice-covered seas (Reference Overeem, Anderson, Wobus, Clow, Urban and MatellOvereem and others, 2011; Reference St-Hilaire-Gravel, Forbes and BellSt-Hilaire-Gravel and others, 2012). Changes in ice conditions also play a great role, comparable with that of changes in storminess, in the intensity of coastal processes in the Baltic Sea area (Reference Orviku, Jaagus, Kont, Ratas and RivisOrviku and others, 2003). The most drastic erosion events occur when late autumn and winter storms attack coastal sections that in more severe winters would be protected by ice cover (Reference Ryabchuk, Kolesov, Chubarenko, Spiridonov, Kurennoy and SoomereRyabchuk and others, 2011). A common opinion is that climate changes in this area will generally lead to a reduction in the duration of the ice period (BACC Author Team, 2008) and thus to an increase in the total amount of wave energy reaching the nearshore and the coast. In this context, it is likely that rapid erosion in the recent past at certain locations that experience no direct anthropogenic impact (e.g. from coastal engineering structures) is associated with a combination of changes in the wave climate and a decrease in the duration of the ice season (Reference Orviku, Jaagus, Kont, Ratas and RivisOrviku and others, 2003; Reference Ryabchuk, Kolesov, Chubarenko, Spiridonov, Kurennoy and SoomereRyabchuk and others, 2011).
The duration of the ice season varies substantially among different years and locations in the Baltic Sea (Reference Leppäranta and MyrbergLeppäranta and Myrberg, 2009). This variation, together with seasonal variation in the wind and wave properties, may in single years greatly enhance the amount of energy supplied by waves to the nearshore. Previous studies of the interrelations of the wave climate and ice phenomena have focused on comparison of the variations in the annual mean wave intensity at the Estonian coast with changes in the duration of the ice season. These quantities did not reveal any correlation (Reference Soomere, Zaitseva-Parnaste and RaämetSoomere and others, 2011). This result stems partially from a specific combination of seasonal variation in the wave heights and the ice period. The beginning of the ice season (late autumn) is characterized, on average, by the greatest annual wind speeds, whereas the end of the ice season (early spring) is one of the calmest periods of the year (Reference MietusMietus, 1998). To a large extent, the shortening of the ice season occurs due to both the later appearance of the ice during the period of high wave activity and to the earlier disappearance of the ice during a relatively calm period. As a result, the annual average wave height over the ice-free season may remain almost unchanged (although the annual bulk wave energy flux to the coast may increase considerably). The associated problem of the construction of adequate wave statistics for seasonally ice-covered seas is extremely complicated (Reference Kahma, Pettersson and TuomiKahma and others, 2003; Reference Tuomi, Kahma and PetterssonTuomi and others, 2011). Moreover, most of the rapid changes to the coast occur during a few severe wave storms (Reference Orviku, Jaagus, Kont, Ratas and RivisOrviku and others, 2003), the presence of which only weakly affects the annual mean wave height. This motivates us to search for a more appropriate but still simple measure that would be able to reflect, at least qualitatively, the potential impact of the change in the duration of the ice season.
A more adequate measure of wave-driven impact to the coast of seasonally ice-covered water bodies can be derived using the wave energy flux. This quantity is commonly recognized as an acceptable measure of the instantaneous intensity of wave-driven alongshore sediment drift (USACE, 2002) in terms of the total amount of sediments that may be brought into motion during a certain time interval. We attempt to evaluate the correlation between the duration of the ice season and the total amount of wave energy flux (wave power) reaching the coast per ice-free season for selected segments of the Estonian coast. Other measures that may have the potential to quantify the role of ice in the coastal processes are the mean energy and the mean wave height in the ice-free period. All these quantities are calculated for time periods from July of a selected year until June of the subsequent year. The analysis is based on: (1) wave properties derived from visual observations during 1954–2005 at three observation sites; (2) numerical simulations using the third-generation spectral wave model WAM (Reference Komen, Cavaleri, Donelan, Hasselmann, Hasselmann and JanssenKomen and others, 1994) for 1970–2005; and (3) data on the duration of the ice season for these sites. As a shorter ice season means a longer period during which the shoreline is exposed to waves, it is natural to expect that at least the total wave energy flux is strongly negatively correlated with the duration of the ice season, whereas the relationship between the average wave energy or the mean wave height and the duration of the ice season may be more complicated.
2. Methods and Data
2.1. Visually observed wave data
An approximation of the time series of wave properties is derived from historical observations at three observation sites along the Estonian coast (Fig. 1): Vilsandi on the western coast of Estonia (1954–2005), Pakri at the entrance to the Gulf of Finland (1954–1985), and Narva-Jõesuu on the southeastern coast of the Gulf of Finland (1954–2005). The total number of single observations (one to three observations a day) ranges from about 20000 at Pakri up to 40 000 at Vilsandi and Narva-Joesuu. The routine, technical devices and methods for the visual wave observations performed at these sites, the major shortages and uncertainties connected with the resulting data and the pre-processing routines (to exclude the doubtful data) have been thoroughly discussed elsewhere (Reference Gulev and HasseGulev and Hasse, 1998, Reference Gulev and Hasse1999; Reference Soomere and ZaitsevaSoomere and Zaitseva, 2007; Reference Soomere, Zaitseva-Parnaste and RaämetSoomere and others, 2011); therefore, here we present only a few key facts.
Locations of the long-term coastal observation sites.

The data from Vilsandi reflect well waves coming from westerly directions. As the site is open to both the predominant strong wind directions (southwesterly and north-northwesterly) (Reference Soomere and KeevallikSoomere and Keevallik, 2001), the dataset is thought to adequately represent long-term and decadal changes in the overall wave intensity in the northern Baltic Proper (Reference Soomere and RaämetSoomere and Räämet, 2011). Owing to relatively shallow water in the observation area (3–4 m), the filed wave heights in severe storms (with the significant wave height exceeding 3 m) do not properly represent the offshore wave heights. As the amount of such wave conditions is only ∼1% in the northern Baltic Proper (Reference Kahma, Pettersson and TuomiKahma and others, 2003; Reference Broman, Hammarklint, Rannat, Soomere and ValdmannBroman and others, 2006; Reference Soomere, Pelinovsky and KharifSoomere, 2008; Reference Tuomi, Kahma and PetterssonTuomi and others, 2011), the resulting distortions do not substantially alter the correlations under consideration.
Pakri is largely open to waves generated in the northern Baltic Proper but is sheltered from waves excited by the predominant southwesterly winds in this area. The observation site is located on the top of a high cliff, and the water depth in the measurement area is >10m. Unfortunately, observations at Pakri are available only until 1985. Although the measurement site has been relocated several times during 1954–85, the seasonal and interannual variations in wave properties (which are decisive in the estimates of correlations with the ice data) are still adequately represented. A comparison with modelled data (Reference Soomere, Zaitseva-Parnaste and RaämetSoomere and others, 2011) reveals that this site at best reproduces the properties of offshore wave fields.
The Narva-Joesuu observation site is located on the southeastern coast of the Gulf of Finland in the wide and open Narva Bay. This site is open to the waves approaching from the west to north and also satisfactorily represents waves approaching from the southwest and north-northeast. Although the water depth at the observation domain was relatively small (∼4–5 m), wave heights and periods were normally moderate and the depth-induced effects were reasonable. The wave observation procedure was identical at all three sites and did not change significantly throughout the years of observation (Reference Soomere, Zaitseva-Parnaste and RaämetSoomere and others, 2011).
2.2. Simulated data
We use hourly time series of wave properties, extracted for the three sites in question, from numerical simulations of the Baltic Sea wave fields for 1970–2007 (Raamet and Soomere, 2010). They used the WAM wave model with an extended frequency range up to ∼2 Hz (wave periods down to 0.5 s, 42 frequency bins) and a spatial resolution of ∼3 nautical miles in idealized ice-free conditions. The reliability of simulated changes in the wave properties crucially depends on the homogeneity of the wind information in time. Although contemporary high-resolution atmospheric models such as the High Resolution Limited Area Model (HIRLAM) represent well the wind details at particular locations, their continuous development often leads to substantial inhomogeneities of their output in time (e.g. Reference Tuomi, Kahma and PetterssonTuomi and others, 2011). Thus, the use of winds that have possibly lower spatial resolution but that are maximally homogeneous in time (such as geostrophic wind fields that are derived from patterns of atmospheric pressure) is preferable to identify the long-term changes in wave properties.
The WAM model was driven by geostrophic winds with a spatial resolution of 18 and temporal resolution of 3 or 6 hours obtained from the Swedish Meteorological and Hydrological Institute. The geostrophic wind speed was multiplied by 0.6 and the direction turned 158 anticlockwise to yield an estimate of the surface wind at the 10 m level (cf. Reference Bumke and HasseBumke and Hasse, 1989). This approximation of the vertical structure of wind properties is frequently used in the Baltic Sea region. Although it completely ignores the stability questions of the atmospheric stratification, it leads to an acceptable reproduction of circulation patterns (Reference MyrbergMyrberg and others, 2010). The simulated wave properties satisfactorily replicate the time series of measured wave data (Reference Räämet, Suursaar, Kullas and SoomereRäämet and others, 2009) and reproduce well the statistical properties of the wave fields at the observation sites in question (Reference Soomere, Zaitseva-Parnaste and RaämetSoomere and others, 2011). A thorough comparison of the modelled and observed wave data was performed by Reference Soomere and RaämetSoomere and Räämet (2011).
2.3. Ice data
During each winter the coastal areas of the northern Baltic Sea are covered by landfast ice, which reaches depths of 5–15 m depending on the severity of the winter. Further out drift-ice fields are found (Reference LeppärantaLeppäranta, 1981). Observations of ice properties in the nearshore zone of Estonia started in the 1800s at several lighthouses and have been performed systematically at several locations by the Estonian Meteorological and Hydrological Institute (EMHI) since the mid-20th century. The ice data include the dates of the first freezing, the formation of permanent ice cover, the end of permanent ice cover and the final disappearance of the ice and, optionally, the thickness of the ice cover (Reference Jevrejeva and LeppärantaJevrejeva and Leppäranta, 2002). The date of the first freezing (the first appearance of sea ice) is registered when ice of any type is first observed (Reference Sooäär and JaagusSooäär and Jaagus, 2007).
For the analysis we used ice data from the same three coastal observation sites run by the EMHI. The duration of the ice season was estimated for each site and winter as the number of days, from July to June of the subsequent year, between the day of the first appearance of the ice cover and that of the total disappearance of the ice. Similar to historical visual wave observations, ice observations have extensive gaps and uncertainties. Since the wave observations used in this paper were made for areas located at some distance from the shore and wave parameters were estimated even with the presence of drifting ice and limited amounts of ice features near the coast, the information about ice cover in the historical data does not exactly match the information about wind waves. On many occasions quite high waves have been recorded within the formal ice season as defined above. Such events are ignored in the calculations below.
As a first approximation we assume that: (1) the first appearance of the ice is associated with the freezing of onshore ground in potential areas of coastal erosion; and (2) these potentially erodible coastal sediments are frozen until the ice has completely disappeared. Assumption (1) is natural because the upper layer of the dry land loses heat much faster than the water column and supposedly freezes first. The soundness of assumption (2) is not crucial as the spring is usually very calm in the study area. These assumptions are equivalent to ignoring the wave impact during the entire ice season as described above. The ice datasets also have some gaps. For example, the relevant information is missing for Vilsandi in the periods 1992–94, 2000–02 and 2004–05 and for Pakri in the periods 1989–90, 1992–93, 1995, 2000–01. These years are excluded from the correlation analysis below.
The ice season in the study area usually lasts from November to May (Reference Jevrejeva and LeppärantaJevrejeva and Leppäranta, 2002; Reference Sooäär and JaagusSooäär and Jaagus, 2007). Figure 2 shows the day of the first appearance and day of the total disappearance of sea ice at Vilsandi, Narva-Jõesuu and Pakri. The duration of the ice season varies substantially at Vilsandi and Pakri. At Vilsandi the duration of the ice season (average 106 days and standard deviation (SD) 40 days) varies from 19 in 1975 to 180 in 1966 (Fig. 3) and at Pakri (average 85 days, SD 33 days) from 9 to 137 in 1988 and 1956, respectively. The variations are less at Narva-Jõesuu where the average duration of the ice season is 133 days (SD 26 days) and the duration varies from 55 days in 1992 to 178 days in 1966. The trend lines in Figure 2 suggest that an overall warming has occurred at the observation sites in question where the number of ice days has generally decreased during the last 50 years (1954–2005). While in the more sheltered Gulf of Riga (Reference Sooäär and JaagusSooäär and Jaagus, 2007) and at Vilsandi the duration of the ice season has decreased considerably over the last half century, the changes in some other coastal regions (Pakri and Narva-Jõesuu) are somewhat smaller. Several years with a very short ice season occurred around 1990 and at the beginning of the 2000s.
The date of the first appearance of sea ice and the disappearance of sea ice at Vilsandi, Narva-Jõesuu and Pakri.

Long-term variations in ice season duration (triangles) and the total energy flux during the ice-free season (diamonds and squares) at Vilsandi, Narva-Jõesuu and Pakri calculated over the time period from 1 July to 30 June of the subsequent year. Diamonds and squares indicate estimates of the energy flux derived from wave observations and simulated data, respectively.

2.4. Estimates of wave energy and power
The experience with the visual observations shows that an observer’s estimate of the wave height represents well the significant wave height (Reference Gulev and HasseGulev and Hasse, 1998, Reference Gulev and Hasse1999). For that reason we interpret the observed wave height as an estimate of the significant wave height (Reference Soomere and ZaitsevaSoomere and Zaitseva, 2007). As on many occasions wave observations were not performed in late autumn and winter, the missing data were replaced by their climatological mean values for each calendar day calculated over 52 years of observations (Reference Soomere, Zaitseva-Parnaste and RaämetSoomere and others, 2011).
We calculated correlations for three different parameters characterizing the wave intensity and potential impact over the time period from 1 July to 30 June of the subsequent year: (1) the total wave energy flux reaching the coast during the ice-free period (called bulk wave power) (Fig. 3); (2) the mean wave energy over the ice-free period (Fig. 4); and (3) the mean wave height over the ice-free period (Fig. 5). The first parameter in the list is usually thought to be decisive for coastal processes.
Long-term variations in ice season duration (triangles) and the mean wave energy during the ice-free season (diamonds and squares) at Vilsandi, Narva-Jõesuu and Pakri calculated over the time period from 1 July to 30 June of the subsequent year. Notations are the same as in Figure 3.

Long-term variations in ice season duration (triangles) and the mean wave height during the ice-free season (diamonds and squares) at Vilsandi, Narva-Jõesuu and Pakri calculated over the time period from 1 July to 30 June of the subsequent year. Notations are the same as in Figure 3.

The calculations of the wave energy and its flux were carried out using the same scheme for both observed and simulated wave properties. Since the water depth d at the observation sites and at the corresponding gridpoints of the wave model was quite small (4–7m), the instantaneous values for the wave energy flux (wave power)

were calculated using the long-wave approximation
 for the group speed and the classical notion for wave energy E

where H is the observed wave height for calculations based on the results of visual observations or for the modelled significant wave height for calculations using the WAM model output, g is the acceleration due to gravity and p is the density of sea water. The resulting values of wave energy and power were interpreted as representing the entire time interval between subsequent observations (or between instants for which the WAM model output was saved) and averaged (E) or summarized (P) over the ice-free season.
In calculations of the listed quantities we ignored all visually observed and numerically simulated wave properties that fell into the ice season (as specified above) for a particular year. Doing so properly accounts for the presence of sea ice in visually observed data but may to a certain extent underestimate the impact of waves just before the beginning of the ice season (e.g. in situations when a little ice is found in sheltered domains but the open sea is largely ice-free). As the wave modelling has been performed for ice-free sea, the wave properties for partially ice-covered situations are overestimated. The resulting errors in the estimates obviously affect the particular values of the mean wave energy and bulk wave power for single years, but do not substantially impact the level of correlations between the integral properties of wave fields and the duration of the ice season.
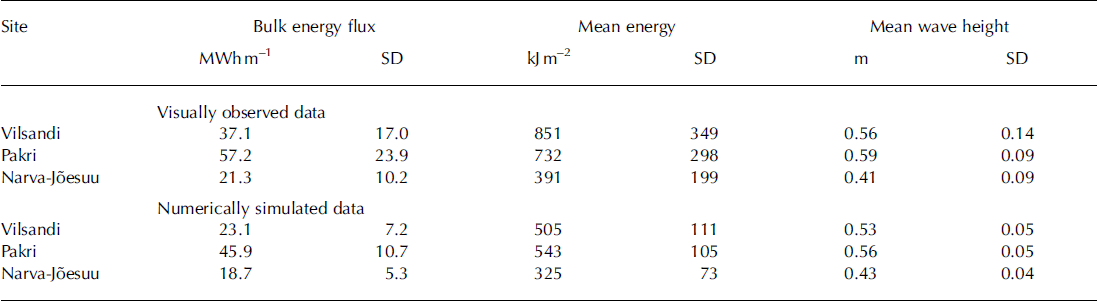
Similar to the duration of the ice season, all three parameters exhibit quite large variations in single years: the standard deviation of the annual values is typically 40–50% for the observed wave properties and 20–30% for the modelled data (Table 1).
Average values and standard deviations of the bulk energy flux, mean energy and mean wave height in the ice-free period
3. Results
Previous studies suggest that the annual mean observed wave height (even if amended using the climatological values) and the similar modelled wave height do not reveal a significant correlation with the duration of the ice season (Reference Soomere, Zaitseva-Parnaste and RaämetSoomere and others, 2011). A likely reason for this is the aforementioned combination of the ice season and the annual course of wave activity: high waves occur in autumn and winter just before the ice season starts and relatively calm seas dominate in spring (Reference Soomere, Zaitseva-Parnaste and RaämetSoomere and others, 2011).
Comparison of the measures of wave energy and its flux with the ice data first reveals that the short-term interannual variations in the bulk wave power are, as expected, mostly in counter-phase with the duration of the ice cover (Fig. 3). Given the definition of the bulk wave power, it is natural that long ice-free autumns correspond to large annual values of this measure while long ice seasons correspond to its relatively low values. The data from Vilsandi reveal statistically significant negative correlation at a >95% confidence level between the duration of the ice season and the bulk wave power, for both visually observed and numerically simulated wave time series (Table 2). A similar significant correlation exists between the length of the ice season and numerically simulated data for Pakri and Narva Jõesuu. Virtually no correlation exists between the length of the ice season and visually observed data. This discrepancy evidently reflects problems with insufficient temporal resolution of visual observations that are often only possible once a day during the windiest season just before ice formation.
Correlation coefficients (r) and the relevant p values between the number of days with observed ice phenomena and the bulk energy flux, mean energy and mean wave height derived from numerical simulations and historical visual observations at Vilsandi, Narva-Jõesuu and Pakri. Statistically significant correlations at the >95% confidence level are indicated in bold
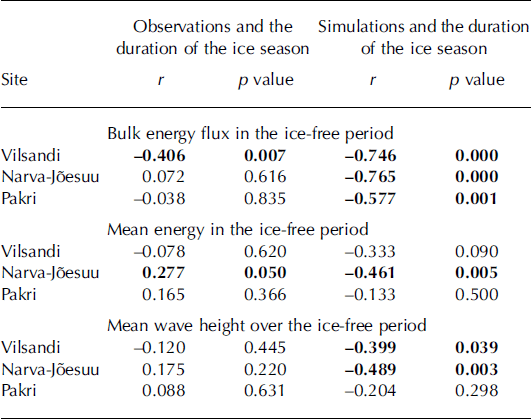
The absence of any statistically significant correlation between the mean wave energy and the length of the ice season for both datasets at Vilsandi and Pakri is not surprising because the mean energy only implicitly reflects the variations in the duration of ice cover. The presence of such a strong correlation at Narva-Jõesuu for both the visually observed and modelled wave datasets may reflect the differences in the degree of openness of the three sites to the predominant southwesterly and north-northwesterly winds in the northeastern Baltic Sea. The nearshore of Vilsandi is almost fully open to both southwesterly and north-northwesterly winds, and the ice regime at this site is strongly affected by storms. Pakri is open to north-northwesterly winds but is partially sheltered against waves excited by southwesterly winds. Narva-Jõesuu is mainly sheltered against waves excited by southwesterly winds, and north-northwesterly winds do not play any substantial role in the eastern Gulf of Finland (Reference Soomere and KeevallikSoomere and Keevallik, 2003). Therefore, ice formation in this area is governed much less by the direct impact of rough seas or by the indirect impact of waves through mixing of the upper layer.
Differing from the annual mean wave height (Reference Soomere, Zaitseva-Parnaste and RaämetSoomere and others, 2011), the modelled average wave height Ha over the ice-free season at Vilsandi and Narva-Jõesuu also shows a high negative correlation (statistically significant at the 95% confidence level) with the duration of the ice season (Table 2). This feature is apparently connected with the above-discussed asymmetry of the ice season with respect to the seasons with high and low wave intensity at these sites and once more signifies that the outcome of visual wave observations should be interpreted with great care. Similarly to the mean wave energy, also Ha reveals no correlation with the duration of the ice season at Pakri. As both ice and wave data cover only a part of the entire time interval in question at Pakri, the results for this site should be interpreted as indicative.
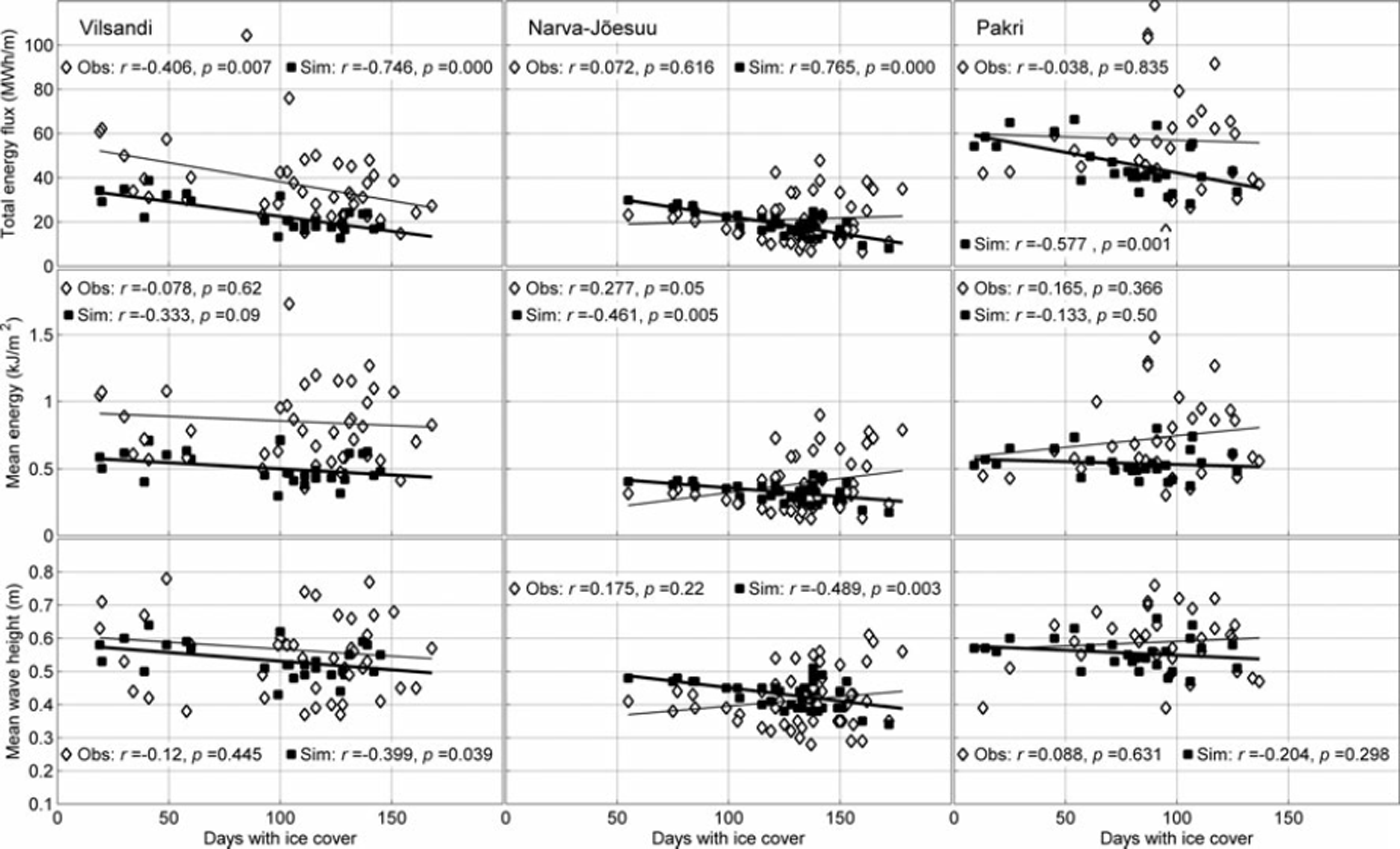
The features discussed are illustrated using scatter plots in Figure 6. In Figure 6 time series that show statistically significant correlation are aligned along certain (regression) lines, whereas the data form clouds of undefined shape if the correlation is weak. Note that the slope of the relevant regression lines for the observed and simulated data is almost the same for the measures and sites that reveal statistically significant correlation, whereas these slopes are very different (even in sign) for pairs of weakly correlated parameters.
Scatter diagram and regression lines for the bulk energy flux, mean energy and mean wave height during the ice-free period and the duration of the ice season (days). The quantities estimated from wave observations and simulations are indicated by diamonds and squares, respectively, and the relevant regression lines are regular and bold, respectively. Here r indicates the correlation coefficient and p shows statistical significance of the correlation (95% confidence level corresponds to p<0.05).
4. Concluding Remarks
As mentioned in Section 1, it would be natural to expect that mean wave energy and especially bulk wave power are strongly negatively correlated with duration of ice season. The key finding of our study is that this is not always the case at the coast of the northeastern Baltic Sea. The correlation between the key wave properties calculated over the ice-free season (the mean energy, bulk wave power and average wave height) and the duration of the ice season is highly dependent on the particular site. At Vilsandi, as expected, this correlation is negative and statistically significant at the 95% confidence level for all modelled wave properties in question but is only evident for the bulk wave energy flux in case of observed wave data. This site is completely open to both the predominant wind directions in the northeastern Baltic Proper. The data from Narva Jõesuu on the southeastern coast of the Gulf of Finland reveal statistically significant correlation between the duration of the ice season and the mean wave energy and also for the numerically simulated mean wave height. The correlation is practically absent at Pakri. The differences are most likely caused by the differences in the degree of openness of the three sites to the predominant winds.
Similarly to earlier studies, it is evident that the average wave height over the ice-free season usually does not have any statistically significant correlation with the duration of the ice season and thus should not be used as an appropriate measure to characterize the severity of the ice season and/or the impact of waves upon sedimentary coasts. The mean wave energy and especially the bulk energy flux seem to have a larger potential in this respect.
The established correlations should be interpreted with care because the total erosion rate in a particular coastal section is a complicated function of the wave properties and water level throughout the ice-free period. A decrease or increase in the ice season length would only diminish or enhance the erosion rate if the wave properties during the extension of the ice-free period are unfavourable. This is not necessarily the case in the northeastern Baltic Sea where major decadal changes in wave heights and approach directions have been observed since the 1950s (Reference Soomere and RaämetSoomere and Räämet, 2011).
A factor potentially affecting the level of the correlations is that the wave modelling has been performed for ice-free sea. The resulting bias in the estimates of wave properties for a partially ice-covered sea evidently affects the results to some extent. However, the strong correlations between the integral properties of wave fields and the duration of the ice season, especially at Vilsandi, are not substantially affected by this shortage. More detailed wave calculations with higher-resolution wind fields and using the offshore ice data are underway and will be reported elsewhere.
The demonstrated differences between the levels of correlations at different sites suggest that the duration of the ice season and the wave intensity may have complicated interrelations depending on the openness of a particular site to the waves excited by predominant winds. The established strong correlation at Vilsandi formally supports the intuitively obvious conjecture that higher levels of bulk wave power correspond to shorter ice seasons. The virtual absence of such correlations at other discussed observation sites indicates that in some situations ice formation and melting is virtually independent of wave activity. This feature should be carefully accounted for in the estimates of the impact of potential warming on the intensity of coastal processes. Namely, the obvious convenient measures for wave-driven impact on the coast, such as the total wave energy flux, may be completely uncorrelated with the changes in ice conditions.
This research focuses on the potential direct ice-driven limitations of the impact of waves on coastal processes and omits several indirect but still equally important effects of coastal ice. Firstly, we have ignored virtually all properties of ice and relied only on the duration of the ice period. In many instances, extensive ice-driven erosion and ice ride-up on the coast may mobilize sediments or destroy dune vegetation (Reference LeppärantaLeppäranta, 2013). Somewhat less visible processes are bottom scouring and transport of large boulders. These effects usually occur irregularly. Although they are definitely caused by specific wind conditions, there seems to be no way to relate them to wave activity (except for specific cases when thin coastal ice is destroyed and piled up on a coast by a strong late autumn storm). Also, the additional forces to the ice edge exerted by wave-driven mass and momentum transport are often decisive for ice formation and destruction but are negligible compared with the wind impact over the entire ice sheet in terms of ice drift.
Acknowledgements
We thank Jaak Jaagus for presenting cleaned ice data retrieved from the archives of the EMHI and for valuable comments, and Andrus Räämet for providing modelled wave data. This study was supported by the targeted financing of the Estonian Ministry of Education and Research (grant SF0140007s11), by the Estonian Science Foundation (grant No. 9125) and by the European Union through support of the European Regional Development Fund to the Centre of Excellence in Non-linear Studies (CENS), the Mobilitas project MTT63 and the project ‘Science-based forecast and quantification of risks to properly and timely react to hazards impacting Estonian mainland, air space, water bodies and coasts’ (TERIKVANT 2012–14).



