Introduction
Water plays an important role in most catalytic processes which involve oxide-based materials [Reference Henderson1]. This holds true not only for the area of electrocatalysis [Reference Kandalkar, Gunjakar and Lokhande2, Reference Wang, Hung, Chen, Chan, Chen and Liu3, Reference Liang, Li, Wang, Zhou, Wang, Regier and Dai4] but also for heterogeneous catalysis [Reference Xie, Li, Liu, Haruta and Shen5, Reference Kumar, Jothimurugesan, Stanley, Schwartz and Spivey6], where water is omnipresent either as a reactant, an inhibitor, or as a trace component in the feed [Reference Xie, Li, Liu, Haruta and Shen5, Reference Thormählen, Skoglundh, Fridell and Andersson7, Reference Cunningham, Kobayashi, Kamijo and Haruta8].
Still, the interaction of water with oxide interfaces is a poorly understood topic. One of the reasons is that water/oxide interfaces are highly dynamic and, therefore, are inherently difficult to characterize. In electrocatalysis, the most prominent example is water splitting, where abundant transition metal oxides such as cobalt oxides show high activity, for instance in the oxygen evolution reaction (OER) [Reference Liao, Zhang, Su, Zhao, Wang, Li, Lu, Wei, Feng, Yu, Cai, Zhao, Ren, Fang, Robles-Hernandez, Baldelli and Bao9, Reference Rosen, Hutchings and Jiao10, Reference Yamada, Yano, Hong and Fukuzumi11]. Such materials are of high technological interest as they may replace rare noble metal oxides containing Pt, Ir [Reference Willinger, Massué, Schlögl and Willinger12, Reference Cheng, Zhang, Chen and Zhang13], or Ru [Reference Cheng, Zhang, Chen and Zhang13]. Cobalt oxide shows a particularly complex behavior during the OER, where it transforms into layered (oxy)hydroxides, with the exact nature of the active site still being under debate [Reference Wang, Hung, Chen, Chan, Chen and Liu3, Reference Fester, Garcia-Melchor, Walton, Bajdich, Li, Lammich, Vojvodic and Lauritsen14, Reference Ullman, Brodsky, Li, Zheng and Nocera15, Reference Kanan, Yano, Surendranath, Dincă, Yachandra and Nocera16, Reference Du, Kokhan, Chapman, Chupas and Tiede17, Reference Ling, Yan, Jiao, Wang, Zheng, Zheng, Mao, Du, Hu, Jaroniec and Qiao18, Reference Song and Hu19, Reference Huang, Chen, Yao, He, Jiang, Sun, Liu, Cheng, Hu, Jiang, Pan and Wei20]. Due to the dynamic nature of the materials, a great challenge lies in the stabilization of the active sites under reaction conditions.
Toward a better understanding of the underlying elementary interactions, there has been increasing interest in studies of water on atomically defined oxide surfaces. Recent work has scrutinized, for example, water on TiO2 [Reference Ketteler, Yamamoto, Bluhm, Andersson, Starr, Ogletree, Ogasawara, Nilsson and Salmeron21, Reference Kimmel, Baer, Petrik, VandeVondele, Rousseau and Mundy22, Reference Balajka, Aschauer, Mertens, Selloni, Schmid and Diebold23, Reference Diebold24, Reference He, Tilocca, Dulub, Selloni and Diebold25], ZnO [Reference Noei, Qiu, Wang, Löffler, Wöll and Muhler26, Reference Meyer, Marx, Dulub, Diebold, Kunat, Langenberg and Wöll27], Fe3O4 [Reference Dementyev, Dostert, Ivars-Barceló, O’Brien, Mirabella, Schauermann, Li, Paier, Sauer and Freund28, Reference Mirabella, Zaki, Ivars-Barcelo, Li, Paier, Sauer, Shaikhutdinov and Freund29, Reference Li and Paier30, Reference Rim, Eom, Chan, Flytzani-Stephanopoulos, Flynn, Wen and Batista31, Reference Leist, Ranke and Al-Shamery32, Reference Meier, Hulva, Jakub, Pavelec, Setvin, Bliem, Schmid, Diebold, Franchini and Parkinson33], FeO [Reference Leist, Ranke and Al-Shamery32, Reference Wang, Zhang, Wang, Zhao, Wang and Hou34, Reference Daschbach, Dohnálek, Liu, Smith and Kay35, Reference Joseph, Kuhrs, Ranke, Ritter and Weiss36], CoO [Reference Fester, Garcia-Melchor, Walton, Bajdich, Li, Lammich, Vojvodic and Lauritsen14, Reference Schwarz, Faisal, Mohr, Hohner, Werner, Xu, Skála, Tsud, Prince, Matolín, Lykhach and Libuda37, Reference Schwarz, Mohr, Hohner, Werner, Xu and Libuda38], and Co3O4 [Reference Schwarz, Faisal, Mohr, Hohner, Werner, Xu, Skála, Tsud, Prince, Matolín, Lykhach and Libuda37, Reference Schwarz, Mohr, Hohner, Werner, Xu and Libuda38]. One of the general findings in these studies is that defect sites such as steps, kinks, or edges play an essential role in water dissociation. More generally, reaction centers with a low coordination number often show high reactivity toward adsorption and dissociation of water. Very recently, Schwarz et al. studied the dissociation of water on thick cobalt oxides, namely CoO(100) and Co3O4(111), and demonstrated that the behavior is completely different on the two surfaces [Reference Schwarz, Faisal, Mohr, Hohner, Werner, Xu, Skála, Tsud, Prince, Matolín, Lykhach and Libuda37]. Whereas water adsorbs molecularly on CoO(100), it dissociates readily on the Co3O4(111) surface and forms very stable hydroxyl species. These OH groups serve as anchoring sites for partially dissociated OH/H2O clusters [Reference Schwarz, Faisal, Mohr, Hohner, Werner, Xu, Skála, Tsud, Prince, Matolín, Lykhach and Libuda37]. On the oxygen terminated CoO(111) surface, very weak interaction with water was observed [Reference Schwarz, Mohr, Hohner, Werner, Xu and Libuda38]. A very similar behavior was observed on Fe3O4(111), where water was shown to adsorb dissociatively, whereas the oxygen-terminated FeO(111) surface is inactive toward dissociation [Reference Joseph, Kuhrs, Ranke, Ritter and Weiss36].
Many of the above-mentioned studies were performed either on oxide single crystal surfaces or on oxide films with a thickness that is large enough to ensure that the film resembles the properties of the bulk material. In this work, we follow a different approach, which enables us to specifically address the role of edge sites. We study the interaction of H2O with ultrathin CoO islands grown on a Pt(111) support. The structure and growth of the CoO islands on noble metal surfaces has been characterized in great detail previously [Reference Fester, Sun, Rodriguez-Fernandez, Walton and Lauritsen39, Reference Fester, Bajdich, Walton, Sun, Plessow, Vojvodic and Lauritsen40, Reference Fester, Walton, Li and Lauritsen41, Reference Walton, Fester, Bajdich, Arman, Osiecki, Knudsen, Vojvodic and Lauritsen42]. The CoO/Pt(111) model system is of particular interest, as the CoO islands resemble the structural features of the layered hydroxide structures which are active in OER [Reference Fester, Walton, Li and Lauritsen41]. A particularly interesting aspect is the reactivity of edge sites of the cobalt oxide islands which has been at the center of interest, recently [Reference Fester, Garcia-Melchor, Walton, Bajdich, Li, Lammich, Vojvodic and Lauritsen14].
Previously, Wang et al. studied water dissociation on nanometer-sized FeO islands, which are structurally very similar to the cobalt oxide islands using scanning tunneling microscopy (STM) [Reference Wang, Zhang, Wang, Zhao, Wang and Hou34]. Water dissociation was found to occur spontaneously at the FeO island step edges, where coordinatively unsaturated Fe atoms act as the reactive centers, while the hydroxyl species are formed on the terraces. Fester et al. studied H2O dissociation on CoO islands prepared on Au(111) [Reference Fester, Garcia-Melchor, Walton, Bajdich, Li, Lammich, Vojvodic and Lauritsen14]. Based on STM work and DFT calculations, the authors found a similar mechanism, in which the reactivity toward water was ascribed to the interaction of H2O with Co-terminated island edges [Reference Fester, Garcia-Melchor, Walton, Bajdich, Li, Lammich, Vojvodic and Lauritsen14].
So far, there is, however, only very little spectroscopic information available on the dissociation of water on layered CoO systems. Photoelectron spectroscopy showed the presence of OD groups, but the chemical resolution of the method is insufficient to differentiate between the different types of OH groups [Reference Fester, Garcia-Melchor, Walton, Bajdich, Li, Lammich, Vojvodic and Lauritsen14]. In this work, we present the results of the first study of water on ultrathin CoO films with well-characterized morphology using vibrational spectroscopy. Combining infrared reflection absorption spectroscopy (IRAS) with isotopic labelling, we demonstrate that the hydroxylation reaction is a complex process, which involves several different hydroxyl species formed on the CoO islands. We identify the nature of these species and their kinetics of formation. Based on the structural information that is available on the CoO/Pt(111) system, we thus derive detailed insights into the complex hydroxylation process.
Results and discussion
Structural characterization and growth
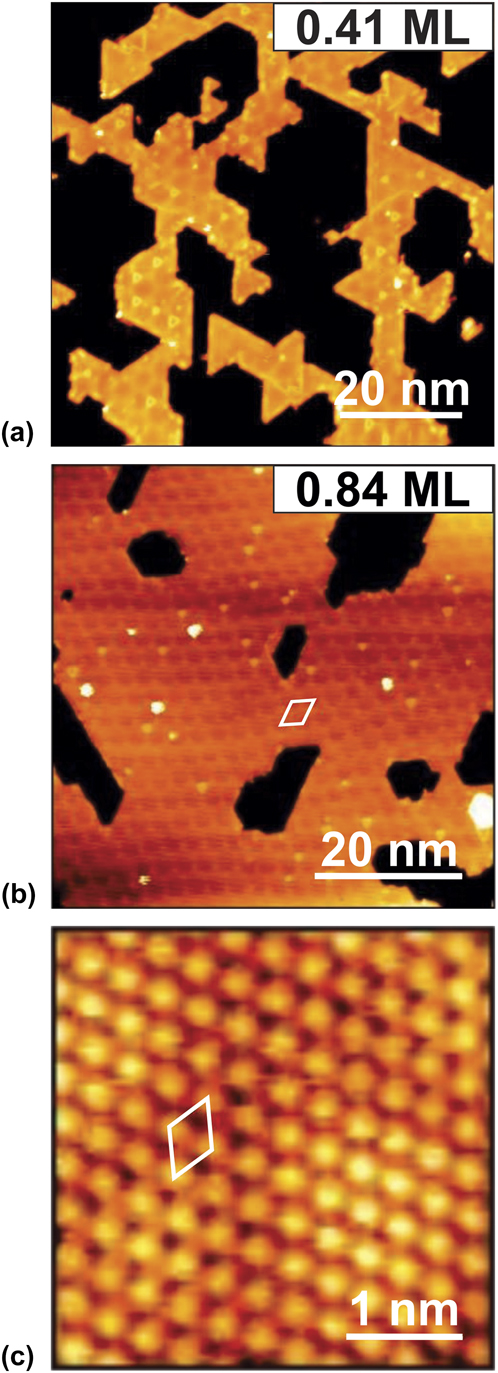
In this work, we investigate the temperature-dependent dissociation of water on atomically well-defined cobalt oxide nanoislands. The CoO bilayer structure was prepared under UHV conditions on a Pt(111) single crystal following the preparation method previously described by Fester et al. [Reference Fester, Sun, Rodriguez-Fernandez, Walton and Lauritsen39, Reference Fester, Bajdich, Walton, Sun, Plessow, Vojvodic and Lauritsen40]. Representative STM images of the CoO bilayer islands are displayed in Fig. 1. The CoO islands are well-ordered and show step edges which are parallel to the close-packed rows of the Pt(111) surface. The CoO coverage can be increased up to almost 1 ML (1 ML is defined as one CoO layer fully covering the Pt(111) surface as indicated by STM) without formation of second layer islands [Reference Fester, Bajdich, Walton, Sun, Plessow, Vojvodic and Lauritsen40]. For low coverages [see Fig. 1(a)], the single-layer CoO morphology is dominated by 10–30 nm wide islands with a well-defined hexagonal shape, reflecting their termination by low-index edges. The slightly truncated triangular morphology of the CoO bilayer islands prepared on Pt(111) reflects an edge structure terminated by approximately 90% Co-edges, as determined by STM previously [Reference Fester, Bajdich, Walton, Sun, Plessow, Vojvodic and Lauritsen40]. With increasing CoO coverage, a homogeneous thin film develops with only a few defects. The film is interrupted by hexagonally shaped pits. The apparent height in the STM image of this CoO bilayer film is about 1.7 Å, which is consistent with the CoO bilayer thickness.
Overview STM images of Co–O bilayer nanoislands on Pt(111) with (a) low coverage, 0.41 ML (V t = −1.25 V, I t = −0.35 nA) and (b) high coverage, 0.84 ML (V t = −1.25 V, I t = −0.20 nA). (c) Detailed atomically resolved STM image of the Co–O bilayer structure (V t = −0.06 V, I t = −0.55 nA). Unit cells of the moiré pattern and Co–O lattice are marked with a white rhomboid in (b) and (c), respectively.

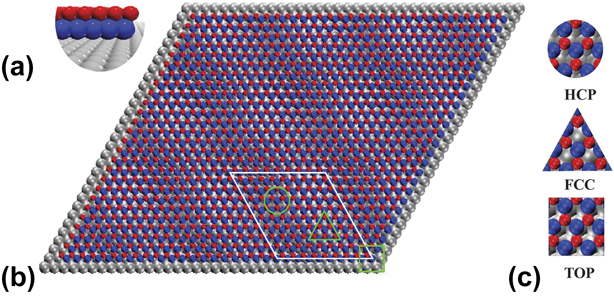
Figure 1(c) depicts an atomically resolved STM image of the basal plane of the CoO bilayer. It reveals the structure of the CoO(111) hexagonally closed packed plane, terminating the film [Reference Giovanardi, Hammer and Heinz45, Reference Gubo, Ebensperger, Meyer, Hammer and Heinz46, Reference Heinz and Hammer47]. Its atomic periodicity (3.1 ± 0.1 Å) is comparable to the interatomic spacing in the closed packed (111) plane of the rocksalt CoO(111) structure (3.02 Å) [Reference Giovanardi, Hammer and Heinz45, Reference Heinz and Hammer47, Reference Biedermann, Gubo, Hammer and Heinz48]. An atomistic ball model of the CoO bilayer on Pt(111) is displayed in Figs. 2(a) and 2(b). The structure of the CoO nanoislands is very similar to that of FeO/Pt(111) and consists of alternating Co- and O- hexagonal lattices [one unit cell of the Co–O lattice is indicated in Fig. 1(c)] [Reference Merte, Knudsen, Grabow, Vang, Lægsgaard, Mavrikakis and Besenbacher49]. Because of the large lattice mismatch of approximately 11.5% compared to the lattice constant of the Pt(111) surface (2.78 Å), a moiré superstructure develops, which is observable in the STM images [Figs. 1(a) and 1(b); periodical corrugation] and also for FeO(111) thin films [Reference Weng, Zhang, Pan, Martynova, Shaikhutdinov and Freund50]. The unit cell of the moiré pattern is also indicated in Fig. 1(b). The periodicity of the CoO/Pt(111) moiré superstructure is 27 Å, which is a characteristic for monolayer CoO on Pt(111) [Reference Fester, Bajdich, Walton, Sun, Plessow, Vojvodic and Lauritsen40]. Within the structural model, several domains can be identified, similar to the case of FeO/Pt(111) [Reference Wang, Zhang, Wang, Zhao, Wang and Hou34]. Based on different Pt–Co–O stacking sequences, three characteristic domain types, namely HCP, FCC, and TOP marked with green circles, triangles, and squares in Figs. 2(b) and 2(c) are found inside one unit cell [see Fig. 1(b)].
Tentative ball model of the Co–O bilayer film on Pt(111) with (a) side-view and (b) top-view. One unit cell is marked with white rhomboid and three distinct domain types are marked with green circle, triangle, and square in (b), respectively. (c) Zoom-in view of the atomic arrangements in different domain types.

Isothermal adsorption of D2O and D2O/H2O exchange at 400 K
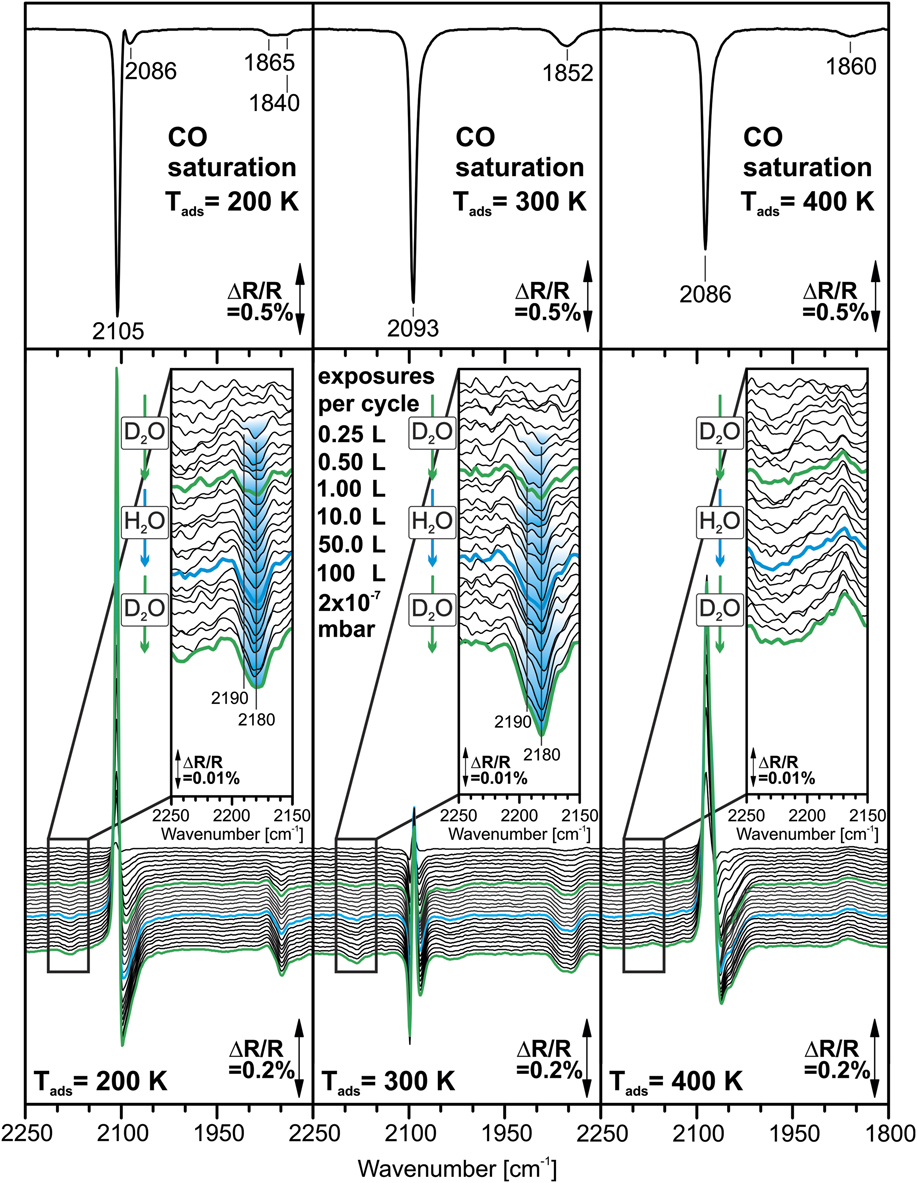
Based on the above information on the structure and growth, we study the interaction of the single-layer CoO islands at low coverages [Fig. 1(a)] with H2O by IRAS. We present IR data at three different surface temperatures, i.e., 200, 300, and 400 K. The IR spectra acquired during isothermal adsorption are displayed in Fig. 3, while results from isotopic exchange experiments with D2O and H2O are shown in Fig. 4. Before exposure to D2O, the surface was saturated with CO at the sample temperature of the adsorption experiment. At the temperatures used in this study, CO adsorbs on the Pt substrate but not on the CoO islands (see section “Temperature-programmed IRAS and interaction of D2O with co-adsorbed CO”). Water, on the other hand, desorbs from Pt(111) already at 160–180 K [Reference Daschbach, Peden, Smith and Kay51, Reference Picolin, Busse, Redinger, Morgenstern and Michely52, Reference Fisher and Gland53, Reference Petrik and Kimmel54]. As a result, all features appearing in the water region can be directly correlated with the interaction of water with the CoO islands. In addition, we can use the CO on Pt(111) as a spectroscopic probe to identify possible interactions with the OD groups formed.
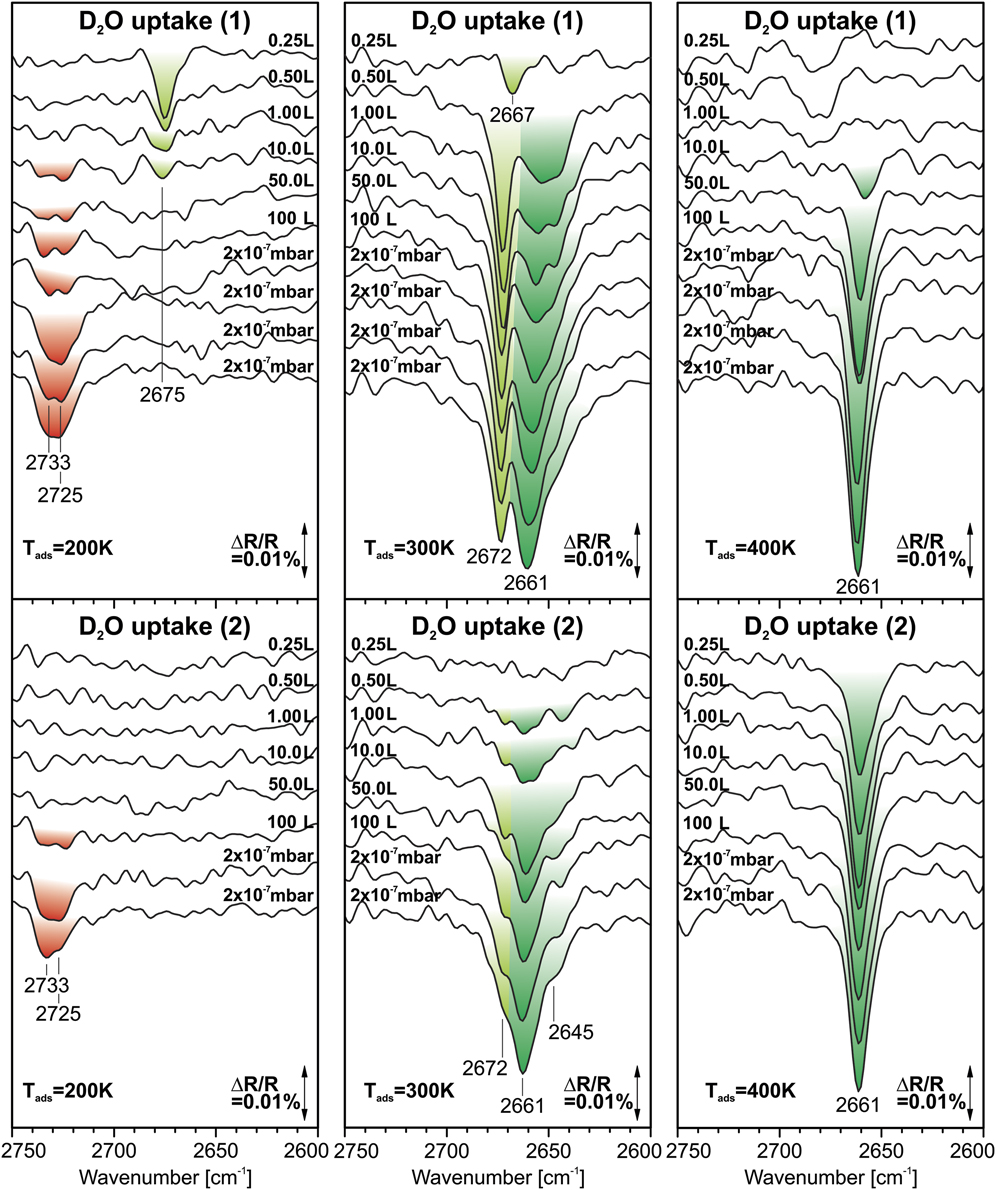
Surface IR spectra recorded after exposure of CoO nanoislands on Pt(111) to D2O at 200, 300, and 400 K. The samples were exposed to increasing doses of D2O between 0.25 and 100 L and, in addition, to D2O at a pressure of 2 × 10⁻⁷ mbar. Top panel: initial exposure to D2O; bottom panel: second exposure to D2O after exposure to H2O. (Reference spectrum: CO/H2O-saturated sample; Color code: red: (D2O)n(OD)m; light green: Co-OtD; dark green: Co-OeD/Co-OcD).

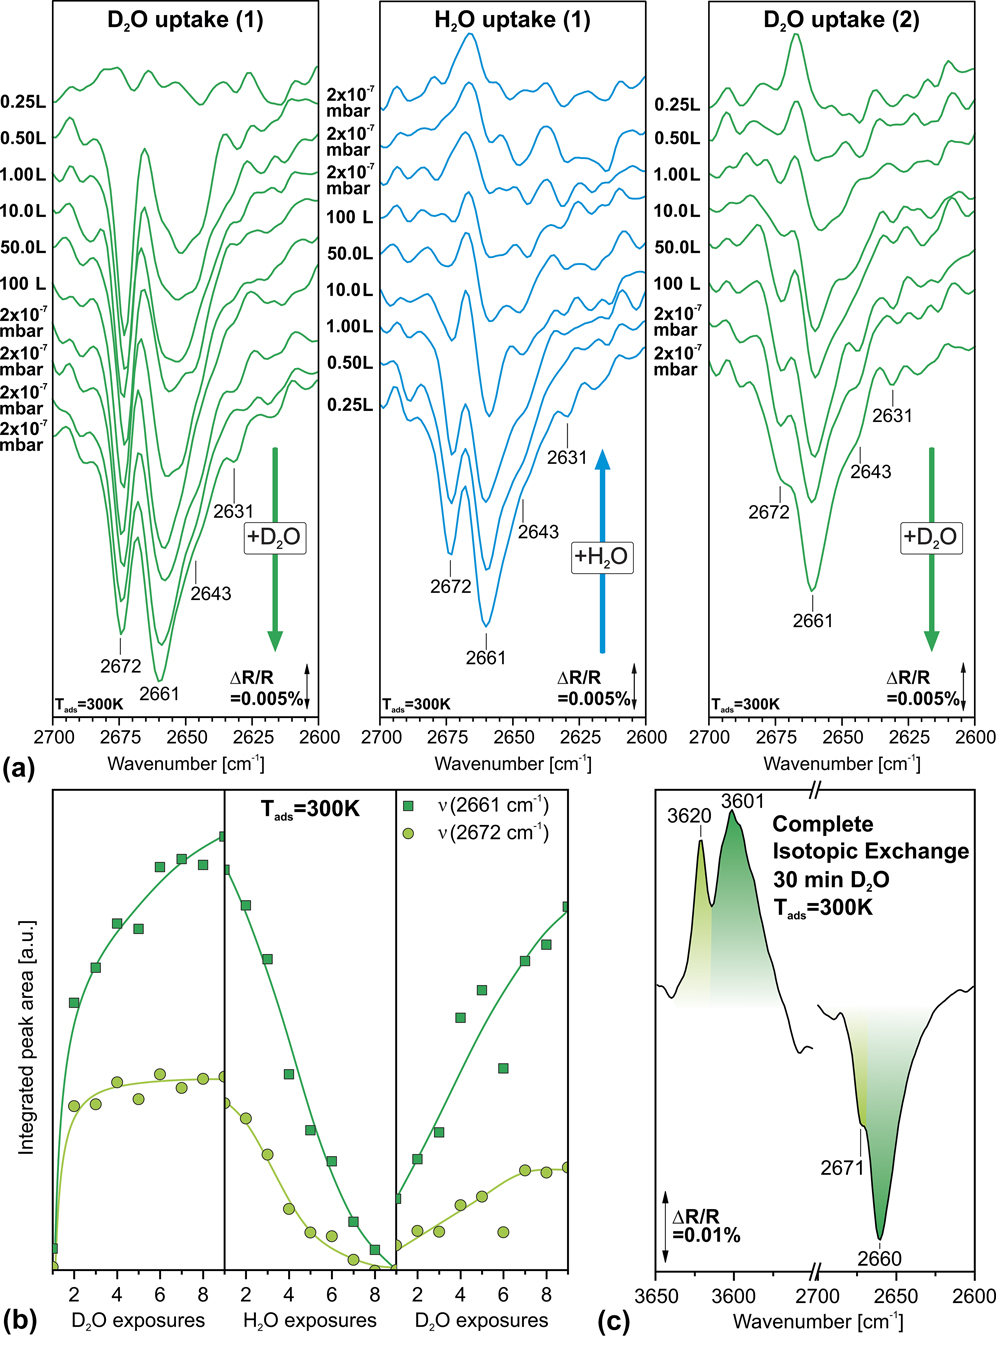
(a) IR spectra recorded during the isotopic exchange experiment with D2O and H2O on CoO nanoislands on Pt(111) at 300 K (Reference spectrum: CO-saturated sample); (b) Integrated peak areas during the isotopic exchange; (c) Comparison of the OD and OH regions after switching from H2O to D2O and extended exposure to D2O. (Reference spectrum: CO/H2O-saturated sample; Color code: light green: Co-OtD; dark green: Co-OeD/Co-OcD).

We start our discussion by considering isothermal adsorption of D2O at 400 K (see Fig. 3, right panel). The corresponding CO spectra will be discussed in section “Temperature- Programmed IRAS and interaction of D2O with co-adsorbed CO”. As a reference spectrum, we used the spectrum taken after full back-exchange with H2O. In this way, we ensure that no traces of D2O are present in the reference spectrum, which could affect the appearance of the D2O bands.
The IR spectra taken during the first D2O uptake (Fig. 3, top right panel) show the growth of a single sharp band. It appears at 2657 cm−1 for small D2O exposures (0.5–1.0 L; 1 Langmuir = 1 L = 10−6 torr s−1) and, with increasing dose, shifts to 2661 cm−1.
The appearance of only one sharp OD band and the absence of any additional bands in the spectral region of hydrogen-bonded OD (below 2600 cm−1) suggests that only one type of free OD species is formed at 400 K. The frequency range is in good agreement with other studies that have identified free isolated hydroxyl groups on oxides [Reference Schwarz, Faisal, Mohr, Hohner, Werner, Xu, Skála, Tsud, Prince, Matolín, Lykhach and Libuda37, Reference Schwarz, Mohr, Hohner, Werner, Xu and Libuda38, Reference Fujimori, Zhao, Shao, Levchenko, Nilius, Sterrer and Freund55]. In previous work on CoO/Au(111), Fester et al. showed that only the CoO edges are reactive against water during water exposure at room temperature [Reference Fester, Garcia-Melchor, Walton, Bajdich, Li, Lammich, Vojvodic and Lauritsen14]. This finding is in agreement with studies on thicker CoO(111) films, which show no indication for H2O dissociation on the oxygen-terminated (111) facets [Reference Schwarz, Mohr, Hohner, Werner, Xu and Libuda38]. Furthermore, Fester and coworkers demonstrated that water dissociates on Co-edges only, leading to the formation of two distinct hydroxyl species, i.e., one hydroxyl coordinated to a terminal Co2+ at the CoO edge and the second hydroxyl species formed by adsorption of the abstracted proton at an oxygen ion on the basal plane [Reference Fester, Garcia-Melchor, Walton, Bajdich, Li, Lammich, Vojvodic and Lauritsen14]. A similar mechanism was found by Wang et al. for water adsorption on FeO(111) islands on Pt(111) [Reference Wang, Zhang, Wang, Zhao, Wang and Hou34]. In sharp contrast, water dissociation can occur directly on the facets if these expose Lewis acid sites (i.e., Fe2+ or Co2+) as it is the case for at Fe3O4(111) [Reference Dementyev, Dostert, Ivars-Barceló, O’Brien, Mirabella, Schauermann, Li, Paier, Sauer and Freund28, Reference Mirabella, Zaki, Ivars-Barcelo, Li, Paier, Sauer, Shaikhutdinov and Freund29, Reference Li and Paier30, Reference Joseph, Kuhrs, Ranke, Ritter and Weiss36] or Co3O4(111) [Reference Schwarz, Faisal, Mohr, Hohner, Werner, Xu, Skála, Tsud, Prince, Matolín, Lykhach and Libuda37, Reference Schwarz, Mohr, Hohner, Werner, Xu and Libuda38].
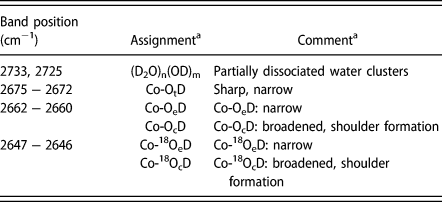
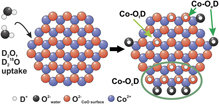
It is noteworthy that in our experiments, only one single OD band is observed in spite of the fact that two different OD species are formed in the initial dissociation reaction. This observation can be explained, however, by assuming that the proton diffuses to an oxygen terminated edge of the CoO islands, a process that is also suggested by recent DFT studies for water dissociation on CoO/Au(111) [Reference Fester, Garcia-Melchor, Walton, Bajdich, Li, Lammich, Vojvodic and Lauritsen14]. As a result, an OD group would be formed that is very similar or even equivalent to the first one. The fraction of oxygen terminated edges that could accommodate protons is rather low for the CoO islands on Pt(111), however, dynamic rearrangements of the edge structures are possible and seem to be an important factor for the dissociation at the edges [Reference Fester, Garcia-Melchor, Walton, Bajdich, Li, Lammich, Vojvodic and Lauritsen14]. Accordingly, we attribute the single band at 2661 cm−1 to a free OD species at the edges of the CoO islands (Co-OeD), which is formed by water dissociation at the Co-terminated edges (see Table I). The narrow shape and low intensity of the band suggests that the density of the free Co-OeD species at the particle edges is rather low (at high coverage, chemical interactions and dipole coupling should lead to a broadening of the OD band).
Vibrational bands and assignments for obtained OD-species on CoO.

a t: terrace; e: edge; c: cluster.
In the next step, the OD covered CoO bilayer was exposed to H2O at 400 K using the same experimental procedure (see Experimental section). We observe that the OD band at 2661 cm−1 decreases with increasing exposure (see Supplementary material Fig. S1) and vanishes almost completely at H2O exposures exceeding 10 L. This finding indicates that OD exchanges very efficiently with water from the gas phase, while new features appear in the OH stretching frequency region around 3600 cm−1, as it is the case for 300 K, depicted in Fig. 4(c). To test the reversibility of the hydroxylation and exchange reaction, a second D2O uptake experiment was performed. The corresponding spectra are displayed in Fig. 3 (lower panel). In fact, the spectra are nearly identical to those observed in the first adsorption experiment. This observation suggests that the isotopic exchange reaction is fully reversible at 400 K.
Isothermal adsorption of D2O and D2O/H2O exchange at 300 K
Next, we turn to the adsorption behavior of D2O at 300 K. The IR spectra taken after exposure of the CO pre-saturated CoO islands to increasing doses of D2O are displayed in Fig. 3 (middle panel). Again, we used the spectrum after subsequent H2O exposure as a reference.
In the limit of low coverage, a narrow peak is observed at 2667 cm−1, which shifts slightly to 2672 cm−1 and saturates already at exposures of 0.5 L. It is accompanied by a broader feature around 2653 cm−1, which grows continuously and shifts to 2661 cm−1 while additional shoulders appear at 2643 and 2631 cm−1.
The absence of any features below 2600 cm−1 suggests that all bands observed can be assigned to free OD groups on the CoO islands and no molecular water is present. Furthermore, at 300 K, weakly bound water molecules would not be stable at the surface and would desorb at this temperature. Following the arguments in section “Isothermal adsorption of D2O and D2O/H2O exchange at 400 K”, we attribute the feature around 2660 cm−1 to the OD groups at the island edges (Co-OeD) (see Table I). Interestingly, a second OD band appears at higher wavenumbers (around 2670 cm−1). For CoO on Au(111), it was found that isolated OD groups are formed upon water exposure on the basal planes of the islands [Reference Fester, Garcia-Melchor, Walton, Bajdich, Li, Lammich, Vojvodic and Lauritsen14]. Accordingly, we assign the peak at 2672 cm−1 to such OD groups on the CoO nanoislands (Co-OtD) (see Table I). This assignment is consistent with the isotopic exchange experiments with D218O which will be discussed in section “Isotopic labelling studies with D218O”. Interestingly, the Co-OtD band saturates quickly and then decreases slowly in intensity. We attribute the saturation to the self-limiting character of water adsorption which stops after the Co-terminated island edges are saturated. However, the OD feature at lower frequency increases in intensity and gets substantially broader. These effects can be attributed to the slow formation of clusters consisting of the formed hydroxyls starting from the OeD species at the island edges (Co-OcD). Such OD clusters should show an increased OD bandwidth because of coupling effects between adjacent OD groups. In addition, the formation of hydroxylated areas may be associated with structural transformations in the CoO island, which would explain the low rate of formation of the Co-OcD clusters. Another explanation is associated with the process of water-assisted dissociation and diffusion which was suggested in previous work [Reference Fester, Garcia-Melchor, Walton, Bajdich, Li, Lammich, Vojvodic and Lauritsen14, Reference Merte, Peng, Bechstein, Rieboldt, Farberow, Grabow, Kudernatsch, Wendt, Laegsgaard, Mavrikakis and Besenbacher56]. We note that the proposed water-mediated mechanism would be fully compatible with the above assignment. During exposure to D2O, there is a finite steady state concentration of molecular water which increases with decreasing sample temperature. Assuming that the formation of Co-OcD clusters is a water assisted process, the absence of OD clusters at 400 K could be explained by the much lower steady state concentration of molecular water at this temperature.
In the next step, we switch again from D2O to H2O and, subsequently, back to D2O. A comparison of the OD bands during this adsorption experiment at 300 K is shown in Fig. 4(a), where the trend of the peak growth and decrease can be followed during the respective uptake. In Fig. 4(b), we show the development of the integral intensity of the OD bands as a function of exposure. In Fig. 4(c), we compare the bands in the OH region after exchange to H2O and the bands in the OD region after back-exchange to D2O.
Upon exposure of the D2O-treated CoO islands to H2O [see Figs. 4(a) and 4(b), middle panel], the OD bands at 2672 and 2661 cm−1 decrease rapidly. Again, this observation indicates efficient exchange of the OD groups with water from the gas phase. Note that in these spectra, the spectrum after CO pre-saturation and prior to D2O exposure was used as a reference. Note that a small amount of D2O was present already when the reference spectrum was recorded, giving rise to a small positive band at 2666 cm−1 after complete exchange to OH [see Fig. 4(a), middle panel].
Interestingly, the OD spectra recorded during the first and the second D2O uptakes are not identical. The sharp band at 2672 cm−1, which was assigned to OD groups on the CoO terraces (Co-OtD), decreases slowly with increasing D2O exposure, while the band attributed to the clusters consisting of OD groups (Co-OcD) changes its shape continuously. We attribute these changes to the slow growth of hydroxylated areas at the expense of free nonhydroxylated CoO islands. An effect that was also observed by STM images of water adsorption on CoO/Au(111), where the formed hydroxyls reveal an affinity to form clusters at specific parts of the moiré pattern [Reference Fester, Garcia-Melchor, Walton, Bajdich, Li, Lammich, Vojvodic and Lauritsen14]. The same effect can also be seen when comparing the spectral regions of the OH and OD modes after back exchange with D2O [see Fig. 4(c)]. The spectra were recorded after extended exposure to D2O (30 min). In the OD region, we observe two OH related features at 3620 and 3601 cm−1. After exchange to D2O, the two corresponding OD bands at 2671 and 2660 cm−1 are detected. However, the relative intensities of the two bands changes continuously during water exposure. In particular, the high frequency band associated with the isolated OD groups on the CoO islands decreases with increasing H2O dose. This observation suggests that the CoO islands become completely hydroxylated after extended exposure to water.
Isothermal adsorption of D2O and D2O/H2O exchange at 200 K
Finally, we consider the adsorption of D2O and the D2O/H2O exchange at 200 K. The corresponding data are shown in Fig. 3 (left panels) and in the Supplementary Material (Fig. S1). The experiment is complicated by the fact that some D2O is already adsorbed on the surface while cooling to 200 K. The IR reference spectrum is taken after the final temperature has been reached. As a result, the background spectrum contains some absorption signals from pre-adsorbed OD and water species and only those features are observable in the displayed spectra which arise from additional OD or D2O species or from those which are exchanged in the isotopic switching experiments.
We observe the appearance of a narrow peak at 2675 cm−1 for low exposures (Fig. 3, upper left panel). With increasing D2O exposure, the band disappears and a broad feature develops at 2730 cm−1. In the second D2O uptake experiments, the feature at 2675 cm−1 is not observed anymore, while the broad band at 2730 cm−1 is still visible (Fig. 3, lower left panel).
These observations can be rationalized as follows. During the cooling step to 200 K, some water from the background adsorbs and dissociates on the sample and blocks most of the island edge sites. The corresponding OD and OH bands do not appear in the IR spectra as these species are not exchanging with gas phase water at 200 K. Upon exposure to D2O at 200 K, additional OD groups are formed on the terraces (Co-OtD) giving rise to the band at 2675 cm−1. However, the islands undergo complete hydroxylation with increasing D2O exposures. This leads to the disappearance of the IR bands from isolated OD on the terraces, in accordance with what has been observed at 300 K (see section “Isothermal adsorption of D2O and D2O/H2O exchange at 300 K”). In the region associated with the OD clusters (Co-OcD, 2660 cm−1), there is only a slight increase in intensity, as this band grows only slightly with increasing coverage (see section “Isothermal adsorption of D2O and D2O/H2O exchange at 300 K”, note that the IR band intensities are not proportional to the surface coverage, see, e.g., Ref. Reference Hoffmann57). The much faster disappearance of the Co-OtD band as compared to 300 K is in line with the suggestion that molecular water assists in the hydroxylation reaction. At 200 K, residence time of molecular water is much larger than at higher temperature and, therefore, water assisted reactions are more likely. In fact, the new band at 2730 cm−1 can be assigned to the free O-D mode of weakly bound molecular water species attached to the surface hydroxyl groups (see Table I). Such partially dissociated water clusters have been observed in several studies, for instance, on Fe3O4(111) [Reference Mirabella, Zaki, Ivars-Barcelo, Li, Paier, Sauer, Shaikhutdinov and Freund29] and on Co3O4(111) [Reference Schwarz, Faisal, Mohr, Hohner, Werner, Xu, Skála, Tsud, Prince, Matolín, Lykhach and Libuda37]. The band position agrees well with those reported in the literature.
In conclusion, we find that at 200 K, the CoO islands are rapidly converted into hydroxylated islands, supporting the hypothesis that water-assisted D2O dissociation is similar to that observed for CoO/Au(111). Weakly adsorbed molecular water attaches to the strongly bound OD groups and exchanges rapidly with water in the gas phase. By contrast, the OD groups themselves show no isotopic exchange with the gas phase at 200 K.
Isotopic labelling studies with D218O
To explore whether the hydroxyl species involve lattice oxygen from the CoO islands or oxygen from adsorbed water molecules, we performed adsorption experiments with isotopically labelled D218O. The OD stretching mode of 18O-labelled OD is expected to be red-shifted by 17 cm−1 with respect to nonlabelled OD.
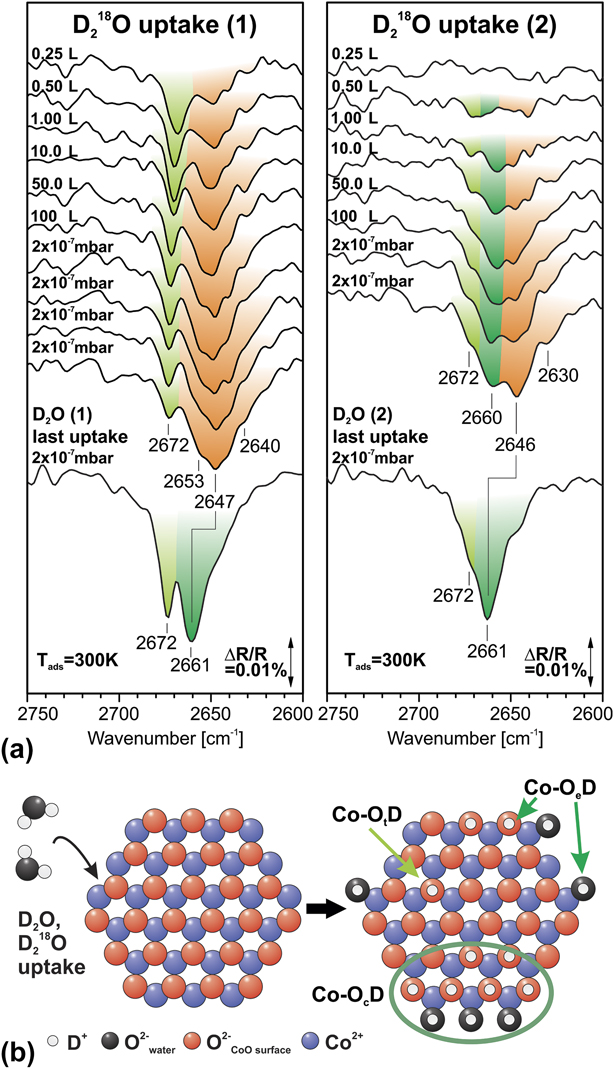
In Fig. 5(a), IR data are displayed which were acquired during the adsorption of D218O on the CoO islands at 300 K. The experimental procedure was identical to the one previously applied for nonlabelled D2O (see Fig. 3). As a reference, we used the spectrum after subsequent exchange with H2O (similar as for the data shown in Fig. 3). In Fig. 5(a), we provide a direct comparison of the spectra obtained after exposure to D218O and nonlabelled D2O, both during the first and the second uptake experiments.
(a) Surface IR spectra recorded after exposure of CoO nanoislands on Pt(111) to D218O at 300 K with comparison to the IR spectrum after exposure to D2O at 300 K. (Reference spectrum: CO/H2O-saturated sample; Color code: light green: Co-OtD; dark green: Co-OeD/Co-OcD; orange: Co-18OeD/Co-18OcD); (b) Schematic representation of the OD species formed upon D2O or D218O uptake proposed in this work.

During the first D218O uptake, we observe the appearance of a peak at 2667 cm−1 which blue-shifts slightly to 2672 cm−1 and decreases in intensity with increasing dose [see Fig. 5(a), left panel]. In addition, we observe a broad band around 2647 cm−1, which contains several shoulders with varying intensity as a function of exposure.
The direct comparison with the nonlabelled D2O [see Fig. 5(a), left panel] reveals that the feature at 2672 cm−1 is observed in both experiments without any measurable shift. This observation shows that the corresponding OD species involves nonlabelled lattice oxygen only. This conclusion is consistent with the assignment of this band to isolated OD groups on the island terraces (Co-OtD) (see Table I). Note that the intensity of the band at 2672 cm−1 varies drastically as a function of exposure. The lower intensity in the case of the D218O uptake is attributed to a larger fraction of the CoO islands being hydroxylated [compare spectra in Fig. 5(a), left panel].
Comparing the broad features around 2647 cm−1 associated with the hydroxylated OD clusters [Co-OcD, see Fig. 5(a), left panel], we indeed observe an isotopic shift induced by the labelled D218O. However, this shift is smaller than the expected 17 cm−1 and the IR band is substantially broader than for the nonlabelled D2O. In addition, the band contains several shoulders which are not observed for the nonlabelled D2O. This observation suggests that the band contains contributions from both, labelled 18OD species and nonlabelled 16OD species. In fact, this conclusion is in line with the dissociation mechanism suggested above. The dissociation of one D218O at the Co-terminated edges of the CoO islands leads to the formation of one labelled 18OD and one nonlabelled OD. The corresponding features overlap and give rise to the reduced shift and broadened IR signal.
Finally, we consider the second D218O uptake experiment after H2O treatment [see Fig. 5(a), right panel]. Here, the band at 2672 cm−1 has disappeared almost completely and the broad feature associated with hydroxylated OD areas on the CoO islands (Co-OtD) dominates the spectrum. After extended exposure to D218O, the broad band clearly contains components [see Fig. 5(a), right panel], one of which is red-shifted by 16 ± 2 cm−1. This observation clearly demonstrates that D218O dissociation leads to the formation of both types of OD groups, i.e., labelled 18OD involving oxygen from the adsorbed water and nonlabelled 16OD involving lattice oxygen from the CoO islands. This is in line with the assumption that the two equivalent OD groups are formed upon D2O dissociation at the CoO edges.
Temperature-programmed IRAS and interaction of D2O with co-adsorbed CO
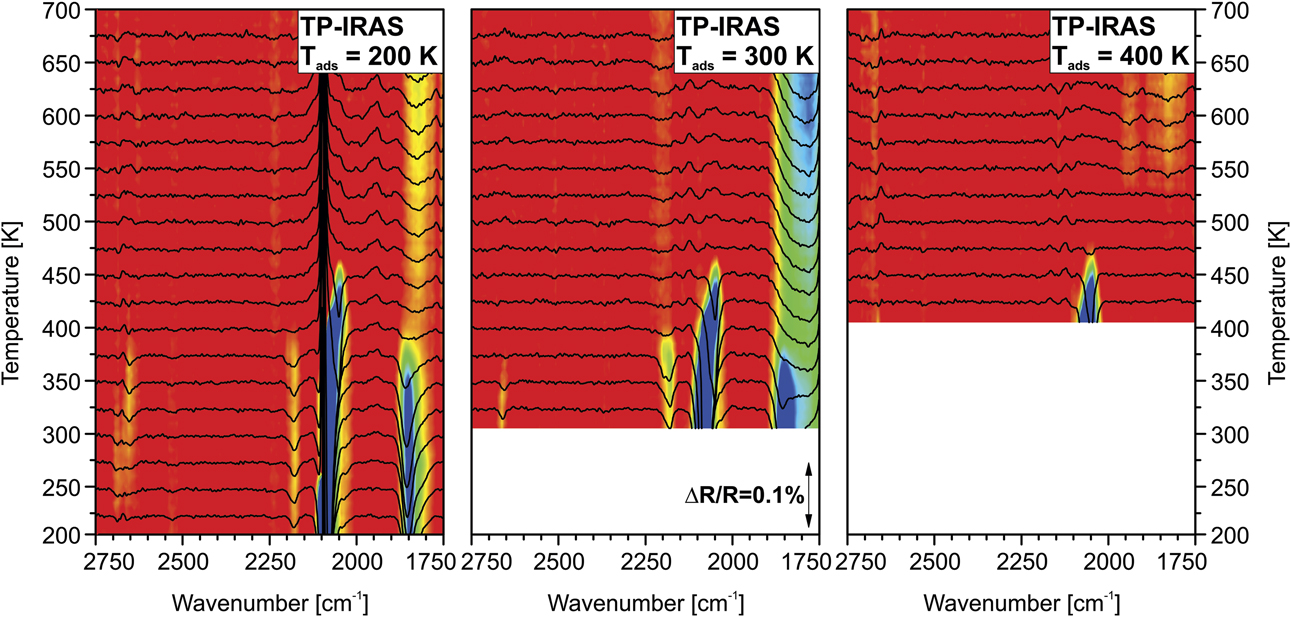
After each D2O adsorption and exchange experiment (see Fig. 3), we performed a temperature-programmed IRAS (TP-IRAS) measurement. Here, the samples were heated to 700 K with a constant rate of 1 K/min while a background pressure of 3 × 10⁻⁸ mbar of D2O was applied to suppress isotopic exchange with residual H2O in the UHV chamber. The IR spectra were taken with an acquisition time of 300 s. The corresponding data are displayed in Fig. 6. As a reference, we used the spectrum of the as-prepared CoO islands before exposure to CO. Therefore, the spectra show both, the bands of adsorbed CO and OD.
Temperature-programmed IRAS data recorded after the isotopic exchange experiments with D2O and H2O at 200, 300, and 400 K (heating rate: 1 K/min; acquisition time per spectrum: 300 s; Reference spectrum: as-prepared CoO sample).

First, we consider the OD region between 2600 and 2800 cm−1. The features in this range are very weak and difficult to identify in the TP-IRAS experiment due to the fact that the background signal is less stable than in the isothermal experiments. Still, we can identify the OD feature from the hydroxylated areas (2661 cm−1, Co-OcD) for D2O exposure at 200 K and at 300 K. The feature disappears around temperatures of 380 ± 10 K, indicating that the OD groups recombine and D2O desorbs in this temperature range.
Before the experiment, the CoO/Pt(111) samples were exposed to CO. As a result, the uncovered Pt(111) areas are saturated with CO at the beginning of the TP-IRAS experiment. By monitoring the changes in the CO stretching frequency region, we can obtain additional information on the interaction of OD with the CO on the Pt(111) terraces.
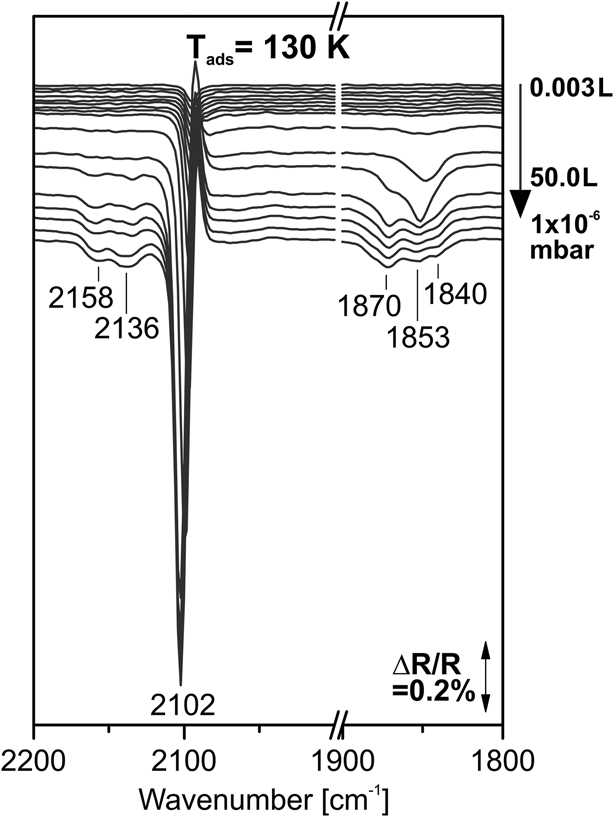
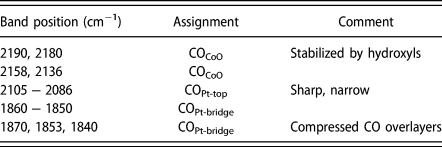
As a starting point, we consider the adsorption of CO on CoO/Pt(111) in the absence of water. The corresponding IR spectra taken during adsorption of CO are displayed in Fig. 7. At low coverage, we observe two bands at 2102 cm−1 and 1850 cm−1, which are assigned to CO adsorbed on on-top and bridge positions, respectively (see Table II) [Reference Hoffmann57, Reference Gajdos, Eichler and Hafner58, Reference Sun, Qin, Lewandowski, Carrasco, Sterrer, Shaikhutdinov and Freund59]. With increasing dose, new peaks appear in the bridging CO region at 1870, 1853, and 1840 cm−1, indicating the formation of compressed CO overlayers (see Table II) [Reference Carrasco, Aumer, Brown, Dowler, Palacio, Song and Sterrer60, Reference Persson, Tüshaus and Bradshaw61, Reference Tüshaus, Schweizer, Hollins and Bradshaw62]. In addition, two new peaks emerge at 2159 and 2134 cm−1. Both peaks can be assigned to CO adsorbed on CoO, in accordance with previous studies (see Table II) [Reference Ferstl, Mehl, Arman, Schuler, Toghan, Laszlo, Lykhach, Brummel, Lundgren, Knudsen, Hammer, Schneider and Libuda43, Reference Spoto, Gribov, Ricchiardi, Damin, Scarano, Bordiga, Lamberti and Zecchina63]. The corresponding TP-IRAS experiment (see Supplementary Material Fig. S2) shows that the CO on CoO desorbs already at 160 ± 5 K, which is in accordance with experiments on thicker films such as Co3O4(111) or Fe3O4(111) [Reference Ferstl, Mehl, Arman, Schuler, Toghan, Laszlo, Lykhach, Brummel, Lundgren, Knudsen, Hammer, Schneider and Libuda43, Reference Li, Paier, Sauer, Mirabella, Zaki, Ivars-Barcelo, Shaikhutdinov and Freund64].
Surface IR spectra recorded after stepwise exposure of the CoO nanoislands on Pt(111) to CO at 130 K (Reference spectrum: as-prepared CoO sample).

Vibrational bands and assignments for obtained CO-species on CoO and Pt(111).

Coming back to the TP-IRAS spectra after exposure of the CO-saturated CoO/Pt(111) to D2O (see Fig. 6), we observe two dominating bands at 2100 and 1850 cm−1 which are attributed to the on-top and bridge-bonded CO on Pt(111), respectively. The bridge-bonded CO desorbs between 350 and 400 K while the on-top CO band shows a red-shift to 2081 cm−1 and, finally, desorbs between 400 and 450 K. The peak shifts originate from interactions between on-top and bridge-bonded CO, which is released when the bridge bonded species desorbs [Reference Olsen and Masel65].
The most remarkable finding is the additional CO absorption signal at 2180 cm−1. The band is located in a spectral range which is a characteristic for CO on oxide surfaces [Reference Ferstl, Mehl, Arman, Schuler, Toghan, Laszlo, Lykhach, Brummel, Lundgren, Knudsen, Hammer, Schneider and Libuda43, Reference Spoto, Gribov, Ricchiardi, Damin, Scarano, Bordiga, Lamberti and Zecchina63, Reference Li, Paier, Sauer, Mirabella, Zaki, Ivars-Barcelo, Shaikhutdinov and Freund64, Reference Scarano, Spoto, Bordiga, Coluccia and Zecchina66]. Therefore, we attribute this band to a CO species adsorbed on the CoO islands (see Table II). On other cobalt oxides, for instance, Co3O4(111), CO-derived bands around 1750 cm−1 were found, which were attributed to weakly bound carbonate-like species [Reference Ferstl, Mehl, Arman, Schuler, Toghan, Laszlo, Lykhach, Brummel, Lundgren, Knudsen, Hammer, Schneider and Libuda43]. The formation of similar species can be ruled out because of the very different vibrational frequency of the new CO species in the present case. Surprisingly, the feature at 2180 cm−1 is observable up to temperatures of 380 ± 20 K. This is in sharp contrast to the weak adsorption of CO on pristine CoO film (see Supplementary Material Fig. S2) and on other cobalt oxide surfaces [Reference Ferstl, Mehl, Arman, Schuler, Toghan, Laszlo, Lykhach, Brummel, Lundgren, Knudsen, Hammer, Schneider and Libuda43]. This unusual behavior of the new CO species formed during water uptake is noteworthy because it may play a role for the catalytic properties. Interestingly, adsorbed H2O was found to inhibit low-temperature oxidation of CO on cobalt oxide catalysts [Reference Xie, Li, Liu, Haruta and Shen5, Reference Thormählen, Skoglundh, Fridell and Andersson7, Reference Cunningham, Kobayashi, Kamijo and Haruta8], which clearly demonstrates the high importance of studying the interaction of CO and H2O at the catalysts surface.
Noteworthy, the CO feature at 2180 cm−1 disappears in the same temperature range in which also the OD groups are lost. This observation suggests that the new CO species is associated with the presence of hydroxyl groups on the CoO islands. To probe whether this is really the case, we investigated the changes in the CO stretching frequency region during exposure to D2O. The corresponding IR data are shown in Fig. 8. For all spectra shown, we used a reference spectrum recorded on the CO-saturated surface. As a result, we obtain difference spectra which show exclusively the spectral changes induced by the co-adsorption of D2O.
Top panel: Surface IR spectra recorded after exposure of the CoO nanoislands on Pt(111) to CO (Reference spectrum: as-prepared CoO sample); bottom panel: difference IR spectra recorded on the CO-saturated CoO nanoislands on Pt(111) during stepwise exposure to D2O (Reference spectrum: CO-saturated sample).

The largest difference in signals is observed in the region around 2100 cm−1, where both positive (loss) peaks and negative (gain) peaks are detected. This behavior indicates a change in the peak shape of the on-top CO band, mainly a broadening or redshift. We attribute this effect to the interaction of the CO on the Pt(111) terraces with the OD groups formed at the edges of the CoO islands. A similar phenomenon is observed in the region of the bridge bonded CO. The most surprising phenomenon is observed, however, in the spectral region above 2100 cm−1 which is characteristic for CO adsorbed on oxides (see the insets in Fig. 8). Here we detect the appearance of the new CO band at 2180 cm−1 induced by exposure to D2O. This observation clearly shows that a new CO species is formed on the CoO islands when the CoO islands are hydroxylated. The OD-stabilized CO species is observed in the isothermal experiments at 200 K and at 300 K, but not at 400 K (see Fig. 8). This is in line with the TP-IRAS experiments showing that this species has a desorption temperature of 380 ± 20 K. Noteworthy, this desorption temperature is approximately 200 K higher than that of CO on the pristine CoO islands, showing that the interaction with the OD groups strongly stabilizes the CO on the CoO islands.
Conclusion
In this work, we investigated the dissociation of water and the hydroxylation of atomically defined CoO nanoislands grown on a Pt(111) support. The CoO islands were characterized by STM and the reaction with water was studied by isothermal and temperature-programmed IRAS, in combination with isotopic exchange experiments. The main findings can be summarized as follows:
(1) OD species: Three different OD species are identified on the CoO nanoislands, (i) isolated OD species at the edges of the CoO nanoislands (Co-OeD), (ii) larger hydroxylated areas growing on the surface of the CoO nanoislands (Co-OcD), and (iii) isolated OD species on the terraces of the CoO nanoislands (Co-OtD). The main fraction of the OD desorbs from the CoO islands at a temperature of approximately 380 ± 10 K.
(2) Hydroxylation kinetics and mechanism: The time-dependent hydroxylation behavior suggests that D2O dissociation occurs rapidly at the Co-terminated edges of the CoO islands. The reaction yields two spectroscopically equivalent OD groups located at the island edges. Upon extended exposure to water vapor, larger hydroxylated areas are formed on the CoO islands, eventually leading to slow hydroxylation of the complete CoO island.
(3) Temperature dependence: The hydroxylation behavior depends sensitively on the reaction temperature. At 400 K, the reaction stops after the formation of isolated OD at the island edges. At 300 K, the hydroxylation process proceeds further and leads to formation of isolated OD species on the terraces (Co-OtD) and to formation of larger hydroxylated areas on the CoO islands (Co-OcD). At 200 K, hydroxylation is very fast and molecular water co-adsorbs at the OD groups, leading to the formation of partially dissociated OD-D2O aggregates.
(4) Influence on CO adsorption: The OD groups formed on the CoO islands interact strongly with CO pre-adsorbed on the Pt(111) substrate. In particular, we observe a new strongly bound CO species formed on the CoO islands in the presence of the OD groups. This species is stable up to a temperature of 380 ± 10 K and desorbs in the same temperature range as the OD groups from the CoO islands.
Our work shows that it is possible to derive detailed insights into the complex hydroxylation processes on nanostructured oxide interfaces by the combination of scanning probe microscopy and vibrational spectroscopy to atomically defined model systems.
Experimental
The STM images of the CoO bilayer system on Pt(111) were acquired in a ultrahigh vacuum (UHV) setup with a base pressure of 1 × 10⁻¹⁰ mbar, consisting of one preparation chamber with metal evaporator sources and an analysis chamber equipped with an Aarhus-type STM [Reference Fester, Sun, Rodriguez-Fernandez, Walton and Lauritsen39]. All infrared (IR) experiments were carried out in another UHV system with a base pressure of 2 × 10⁻¹⁰ mbar, which was described elsewhere [Reference Ferstl, Mehl, Arman, Schuler, Toghan, Laszlo, Lykhach, Brummel, Lundgren, Knudsen, Hammer, Schneider and Libuda43]. Briefly, the IR-UHV system is equipped with several evaporator sources and a gas dosing system, and the required sample characterization methods [low energy electron diffraction (LEED), Auger electron spectroscopy (AES)], and a quadrupole mass spectrometer (QMS). The IR spectra were recorded with a vacuum Fourier-transform infrared (FTIR) spectrometer (Vertex 80v, Bruker, Billerica, Massachusetts) and an external liquid nitrogen cooled narrow band mercury cadmium telluride (LN-MCT) detector at a spectral resolution of 4 cm−1. H2O, D2O, and D218O were degassed by several freeze-pump-thaw cycles prior to the deposition and were dosed via fine leak valves at pressures of 2 × 10⁻⁷ mbar.
Preparation of CoO bilayer/Pt(111)
For the STM measurements, a Pt(111) single crystal mounted on a Ta sample plate was cleaned by repeated cycles of Ar+ sputtering (1.5 keV, 300 K, 15 min, Linde AG, Pullach, Germany/Air Liquide, Paris, France, 5.0), subsequent steps of annealing at 980 K for 15 min in O2 atmosphere (Air Liquide, 4.8), and flashing to 1100 K for 0.5 min. The CoO bilayer structure on Pt(111) was prepared by reactive deposition of Co in O2, according to the previously reported procedures [Reference Fester, Sun, Rodriguez-Fernandez, Walton and Lauritsen39, Reference Fester, Bajdich, Walton, Sun, Plessow, Vojvodic and Lauritsen40, Reference Walton, Fester, Bajdich, Arman, Osiecki, Knudsen, Vojvodic and Lauritsen42]. Briefly, Co was deposited onto the clean Pt(111) using an electron beam evaporator (Oxford Applied Research, Witney, United Kingdom, EGCO4) at a sample temperature of 380 K and O2 background pressure of 1 × 10⁻⁶ mbar with subsequent annealing at 523 K for 10 min in 1 × 10⁻⁶ mbar O2 and for 5 min in UHV. Afterwards, the sample was cooled in UHV to 300 K and the structure was characterized by means of STM (SPECS GmbH, Berlin, Germany, Aarhus 150). This preparation led to the formation of well-defined and crystalline CoO bilayer nanoislands with only few defect sites.
For the IRAS measurements, a slightly modified sample preparation procedure was applied. First, the Pt(111) single crystal was cleaned by cycles of Ar+ sputtering (1.5 keV, 300 K, 60 min; Ar, Linde, 6.0). Subsequently, the sample was annealed at 973 K for 5 min in UHV and for 5 min in 5 × 10⁻⁸ mbar O2 (Linde, 5.0). Afterwards, it was flashed to 1173 K in O2 atmosphere and, finally, annealed at 1073 K for 5 min in UHV. To avoid O2 pre-adsorption on the surface, a reactive annealing step was added at 523 K in 1 × 10⁻⁶ mbar CO (Westfalen AG, Münster, Germany, 3.7) for 5 min. Prior to the CoO bilayer preparation, the cleanliness of the Pt(111) sample was checked by CO adsorption at 130 K. Next, the sample was exposed to 1 × 10⁻⁶ mbar O2 at 380 K and Co was evaporated onto the crystal surface using a commercial electron beam evaporator (Focus EFM3, 2 mm Co rod, Alfa Aesar, Ward Hill, Massachusetts, 99.995%). At an ion flux of 10 nA, the Co deposition time for 0.3 ML of the CoO bilayer was 78 s, as calibrated by using a quartz microbalance and CO adsorption. After preparation, the nanoislands were post-annealed at 523 K for 10 min in 1 × 10⁻⁶ mbar O2 and for 5 min in UHV. The quality of the CoO bilayer was checked by LEED, which showed the characteristic moiré pattern of the monolayer CoO islands.
CO pre-saturation
Prior to the isothermal isotopic exchange experiments, the as-prepared sample was pre-saturated with CO at 1 × 10⁻⁷ mbar at 200 K, 300 K, and 400 K, respectively. This prevents co-adsorption of CO from the residual gas in the UHV chamber during D2O/H2O dosage and allows us to use the adsorbed CO as an additional spectroscopic probe.
Isothermal D2O exposure experiments
The sample was exposed to increasing doses of D2O (Sigma-Aldrich, St. Louis, Missouri, 99.9 atom % D) at pressures of 2 × 10⁻⁷ mbar at sample temperatures of 200 K, 300 K, and 400 K, respectively (0.25 L, 0.50 L, 1.00 L, 10.0 L, 50.0 L, 100 L). After each D2O dose, an IR spectrum was recorded with an acquisition time of 600 s. Subsequently, several spectra (acquisition time 600 s) were recorded at an applied background pressure of D2O of 2 × 10⁻⁷ mbar.
Isotopic exchange experiments
After the isothermal exposure to D2O, the sample was exposed to H2O using the same dosing procedure and pressure (2 × 10⁻⁷ mbar). Finally, a second D2O dosing cycle was applied to investigate the reversibility of the adsorption processes by isotopic exchange. To obtain a spectrum after full exchange of D2O by H2O at 300 K, the CoO nanoislands were pre-saturated with H2O at 2 × 10⁻⁷ mbar for 10 min, and a spectrum was recorded in H2O atmosphere with an acquisition time of 30 min. Subsequently, D2O was dosed at a pressure of 2 × 10⁻⁷ mbar for 10 min and an IR spectrum was recorded with an acquisition time of 30 min in D2O atmosphere. The spectrum of the H2O saturated sample was used as a reference.
Isothermal D218O exposure and isotopic exchange
The same measurements as described above for D2O/H2O at 300 K were also performed with isotopically labeled D218O (Sigma-Aldrich, 99 atom % D; 95 atom % 18O).
Temperature-programmed IRAS
Subsequently to the isotopic exchange experiment, a temperature-programmed IRAS (TP-IRAS) measurement was conducted at each adsorption temperature (200, 300, 400 K). Here, the sample was heated to 700 K at a rate of 1 K/min, while IR spectra were continuously recorded with an acquisition time of 300 s. During the whole experiment, a constant D2O background pressure of 3 × 10⁻⁸ mbar was maintained to exclude the exchange of deuterium with water from the background of the UHV chamber. For the analysis of the TP-IRAS data, we applied the procedure previously proposed by Xu et al. [Reference Xu, Schwarz, Werner, Mohr, Amende and Libuda44]. Briefly, the decreasing reflectivity of the surface at elevated temperatures results in a loss of signal intensity. This loss was compensated by scaling the spectra to the initial intensity at the starting temperature. The corrected spectra were referred to the spectrum of the as-prepared CoO bilayer prior to CO pre-saturation and D2O/H2O exposure.
Low-temperature CO adsorption experiments
The freshly prepared nanoislands were exposed to pulses of CO (Westfalen, 3.7) with exponentially increasing doses using a remote-controlled doser (National Instruments (NI), Austin, Texas, LabView interface). An additional liquid nitrogen cooling trap was installed for the purification of the CO gas, in particular to remove possible traces of carbonyls. Prior to the CO pulse experiment, the CoO bilayer islands were cooled to 130 K and a reference spectrum was recorded with an acquisition time of 10 min and a spectral resolution of 4 cm−1. After each CO pulse, a spectrum was recorded (resolution 4 cm−1, acquisition time 90 s).
Supplementary material
To view supplementary material for this article, please visit https://doi.org/10.1557/jmr.2018.388.
Acknowledgments
This project was supported by the Deutsche Forschungsgemeinschaft (DFG) within the Reasearch Unit FOR 1878 “funCOS-Functional Molecular Structures on Complex Oxide Surfaces”. Further financial support of the DFG within the Excellence Cluster “Engineering of Advanced Materials” (Bridge Funding) in the framework of the Excellence Initiative is gratefully acknowledged. J.V.L. and J.R-F. acknowledge the VILLUM foundation. Z.S. would like to acknowledge financial support from the China Scholarship Council (CSC).