

The attitudes of educators towards the inclusion of students with disabilities in regular schools are of enduring interest to researchers (Avramidis & Norwich, Reference Avramidis and Norwich2002; Graham & Spandagou, Reference Graham and Spandagou2011; Scruggs & Mastropieri, Reference Scruggs and Mastropieri1996; Subban & Sharma, Reference Subban and Sharma2006; Ward, Center, & Bochner, Reference Ward, Center and Bochner1994). This interest both parallels and complements movements in international policy and legislation around inclusive schooling. The vision of inclusion is grounded in the education policies contained in the Salamanca Statement (United Nations Educational, Scientific and Cultural Organization [UNESCO], 1994), which was reaffirmed at the World Education Forum in 2000, and requires that education systems promote inclusion through ‘. . . stimulating discussion, encouraging positive attitudes and improving educational and social frameworks to cope with new demands in education structures and governance’ (UNESCO, 2009, p. 7).
The policy guidelines arising from the World Education Forum affirm that ‘Education for All’ must take account of the poor and disadvantaged as well as persons with disabilities or special learning needs (UNESCO, 2009). These international declarations set the stage for education policy and research interested in expanding upon practice and to explore facilitators and barriers to full inclusion. Although these global shifts have invoked policy changes that have resulted in the increased access to regular schooling for many students with disabilities (Avramidis, Bayliss, & Burden, Reference Avramidis, Bayliss and Burden2000a; Graham & Sweller, Reference Graham and Sweller2011), it is argued by some that barriers to the full inclusion of students with disruptive behaviours continue or are increasing (Armstrong, Armstrong, & Spandagou, Reference Armstrong, Armstrong and Spandagou2011; Graham & Sweller, Reference Graham and Sweller2011; Slee, Reference Slee2013). Over time, the attitudes towards the inclusion of this group of students are reported as consistently more negative than towards other disability groups (Avissar, Reiter, & Leyser, Reference Avissar, Reiter and Leyser2003; Avramidis & Norwich, Reference Avramidis and Norwich2002; Praisner, Reference Praisner2003; Subban & Sharma, Reference Subban and Sharma2006). These findings shine a spotlight on the need for increased research into the educational practices and attitudes of educators towards this group of students.
Interest in the attitudes of educators is viewed as a critical component of both understanding practice and exploring ways to progress inclusive practice in schools. A significant body of research currently exists that highlights the views held by teachers on the assumption that the success of inclusion is dependent on teachers holding positive views (Avramidis & Norwich, Reference Avramidis and Norwich2002; Subban & Sharma, Reference Subban and Sharma2006). With this same principle in mind, attitudes of a full range of education professionals have also been explored, including preservice teachers (Avramidis et al., Reference Avramidis, Bayliss and Burden2000a; Spandagou, Evans, & Little, Reference Spandagou, Evans and Little2008), school counsellors or psychologists (Center & Ward, Reference Center and Ward1989; Roberts & Smith, Reference Roberts and Smith1999), special education teachers (Cook, Semmel, & Gerber, Reference Cook, Semmel and Gerber1999), students (Bunch & Valeo, Reference Bunch and Valeo2004) and school principals (Bailey, Reference Bailey2004; Barnett & Monda-Amaya, Reference Barnett and Monda-Amaya1998; Center, Ward, Parmenter, & Nash, Reference Center, Ward, Parmenter and Nash1985; Graham & Spandagou, Reference Graham and Spandagou2011; Praisner, Reference Praisner2003). Common among many of these studies is the finding that the views of educators vary depending on the type and severity of the disability, with less positive attitudes held towards students with more severe disabilities and students with emotional and behavioural disabilities. These views appear to have changed little from the early studies into the ‘mainstreaming’ of students with disabilities (Center et al., Reference Center, Ward, Parmenter and Nash1985; Ward et al., Reference Ward, Center and Bochner1994) through to the most recent study of principals in New South Wales (NSW; Graham & Spandagou, Reference Graham and Spandagou2011), with a further study suggesting that narrowing constructions of ‘normal’ have resulted in decreasing tolerance of students with disruptive behaviours in regular/mainstream classrooms (Graham & Sweller, Reference Graham and Sweller2011).
Disruptive student behaviour has multiple definitions in the international literature. Emotional and behaviour disorders (EBD) is commonly used in the United States and social, emotional and behaviour difficulties (SEBD) is the preferred term in Britain. Australian researchers use multiple terms to describe the group of students seen as most challenging to educators, including troublesome (Beaman, Wheldall, & Kemp, Reference Beaman, Wheldall and Kemp2007), challenging (Carter, Stephenson, & Clayton, Reference Carter, Stephenson and Clayton2008; Graham & Spandagou, Reference Graham and Spandagou2011; Michail, Reference Michail2011), disruptive (Beaman, Wheldall, & Kemp, Reference Beaman, Wheldall and Kemp2006; Graham, Reference Graham2008), emotional disturbance/behaviour disorder or EDBD (Graham & Sweller, Reference Graham and Sweller2011), or adopt the American term EBD (Cumming, Reference Cumming2010; O’Neill & Stephenson, Reference O’Neill and Stephenson2009). The above terms are often used interchangeably and their definitions can vary, depending on both the context and focus of the study. This study uses the term disruptive behaviour to encompass students with identified and labelled mental health conditions (who fit under the term EBD) but also for students for whom no diagnosed condition exists but whose behaviour is viewed by schools as challenging or disruptive. In defining the term disruptive, the following description taken from a NSW Government Department of Education and Communities (DEC) policy document is applied: ‘In NSW public schools, behaviour is defined as disruptive where it: interferes with individual learning and disrupts the learning of others, and the delivery of educational programs; is of high intensity, frequency and duration’ (NSW Government Department of Education and Training [NSW DET], 2007, p. 4).Footnote 1
The issue of disruptive student behaviour continues to gain the attention of schools, policy-makers and researchers internationally, with an often-cited claim that behavioural standards in schools are on the decline (Beaman et al., Reference Beaman, Wheldall and Kemp2007; Horner & Sugai, Reference Horner and Sugai2000; Kauffman, Reference Kauffman1999; Kern & Manz, Reference Kern and Manz2004; Lewis, Powers, Kelk, & Newcomer, Reference Lewis, Powers, Kelk and Newcomer2002; Rydell & Henricsson, Reference Rydell and Henricsson2004). Although such claims can be traced back through most generations (Bushaw & Lopez, Reference Bushaw and Lopez2010; Rose & Gallup, Reference Rose and Gallup2002), they continue to be used to expand a broader range of services that result in the segregation of many of these students from their regular schools (NSW DET, 2004, 2005, 2006). Describing recent research into ‘troublesome’ behaviour in schools, Beaman et al. (Reference Beaman, Wheldall and Kemp2007) concluded that the weight of evidence would suggest that despite school and public rhetoric, prevalence rates of students with behaviour difficulties in schools remain largely unchanged. They further rallied for a collective guarding of the creation of a ‘new excluded’ group of students in schools, suggesting it would be a ‘travesty’ that while students with physical, sensory and intellectual disabilities are increasing in number in inclusive settings, students with disruptive behaviours are more frequently being excluded and educated in segregated settings where ‘aberrant behaviour is the norm’ (p. 58). Graham and Sweller (Reference Graham and Sweller2011) reported large increases in the numbers of students in NSW with emotional and behavioural disorders in segregated settings in the 10-year period from 1997 to 2007. Although these findings would suggest that the new excluded may already be on the rise, these figures correspond with a significant increase in students in inclusive settings ‘diagnosed’ with behaviour disorders. Graham and Sweller (Reference Graham and Sweller2011) linked these findings with the research into teacher attitudes and suggested that such figures also demonstrate a shrinking conception of how schools define normality and boundaries of acceptable behaviour. These two Australian studies (i.e., Beaman et al., Reference Beaman, Wheldall and Kemp2007; Graham & Sweller, Reference Graham and Sweller2011) make contrary claims regarding prevalence rates, but they concur that teachers continue to find student behaviour problematic in classrooms.
Interest in the attitudes of teachers towards inclusion has been sustained on the basis that teachers have been viewed as the primary agents in the implementation of inclusive philosophy and practice (Subban & Sharma, Reference Subban and Sharma2006). Although some empirical work has addressed the views of principals (Angelides, Reference Angelides2012; Avissar et al., Reference Avissar, Reiter and Leyser2003; Bailey, Reference Bailey2004; Bailey & du Plessis, Reference Bailey and du Plessis1998; Barnett & Monda-Amaya, Reference Barnett and Monda-Amaya1998; Center et al., Reference Center, Ward, Parmenter and Nash1985; Cook et al., Reference Cook, Semmel and Gerber1999; Graham & Spandagou, Reference Graham and Spandagou2011; Praisner, Reference Praisner2003), they have not experienced the same level of attention as other groups of educators. This focus on teachers has benefits by directing attention to where inclusion happens — in classrooms. Increasing evidence, however, in both the inclusive education work and the field of educational leadership sheds light on the significance of the role of the principal in shaping school-wide cultures and practices, which also impact greatly on inclusive practice. The conclusions of over a decade of research in educational leadership suggests that principals have an indirect but significant influence on their schools (Avramidis, Bayliss, & Burden, Reference Avramidis, Bayliss and Burden2002; Hallinger, Reference Hallinger2011; Huber, Reference Huber, Townsend and MacBeath2011; MacBeath & Townsend, Reference MacBeath, Townsend, Townsend and MacBeath2011a; Townsend, Reference Townsend2011; Zollers, Ramanathan, & Yu, Reference Zollers, Ramanathan and Yu1999).
Even though the quantitative evidence linking principals’ direct and immediate effect on student outcomes is tentative (Hallinger, Reference Hallinger2011; Hallinger & Heck, Reference Hallinger and Heck1998), the results of qualitative and mixed-method investigations suggest that principals exercise significant influence in other ways across the school, which in turn influence student outcomes (Day, Reference Day2007; Drysdale & Gurr, Reference Drysdale and Gurr2011; MacBeath & Townsend, Reference MacBeath, Townsend, Townsend and MacBeath2011a). Robinson (Reference Robinson2007) sythesised 24 quantitative studies of the impact of leadership on student outcomes and identified five leadership practices believed to have had a powerful impact on students: establishing goals and expectations; strategic resourcing; planning, coordinating and evaluating teaching and the curriculum; promoting and participating in teacher learning and development; and ensuring an orderly environment. These findings are consistent with a range of qualitative studies conducted both in Australia and internationally that also suggest that principals exercise strong influence on school practices through their values and beliefs, the establishment of shared vision, building school capacity through professional learning, and taking an instructional focus on teaching and learning (Gurr, Drysdale, & Mulford, Reference Gurr, Drysdale and Mulford2006; Parkes & Thomas, Reference Parkes and Thomas2007). Common among all of this work is the importance of principals’ relationship skills, which Robinson (Reference Robinson2007) claimed are embedded in all leadership practice. Studies within Australia conducted as part of the International Successful School Principals Project (Day, Reference Day2007) also draw attention to the existence of a strong commitment to social justice evident in principals perceived as effective (Gurr, Drysdale, & Mulford, Reference Gurr, Drysdale and Mulford2005). Irrespective of either methodology or epistemology of the existing research, there exists strong claims that principals exercise a significant influence on schools through their attitudes, values and beliefs, which are enacted in some capacity through school systems, structures and relationships.
There is little empirical work in Australian or international literature that explores how principals’ attitudes towards students with disruptive behaviours can act as either a barrier or facilitator to the effective inclusion of this group of students. A recent study into principals’ attitudes towards inclusion in NSW, Australia, by Graham and Spandagou (Reference Graham and Spandagou2011) highlighted continued tensions experienced by principals around students they described as having challenging behaviour. The authors suggested that in implementing inclusive practices in schools, caveats such as levels of funding and levels of student (mis)behaviour influence decision-making and definitions of inclusion (Graham & Spandagou, Reference Graham and Spandagou2011). Bailey and du Plessis (Reference Bailey and du Plessis1997) called this ‘qualified inclusion’ (p. 433). Given the substantial claims in the leadership literature around principals’ influence on school practice, this study operates on the simple premise posited by Bailey (Reference Bailey2004) that ‘the person with the most organisational power in the school is in the best position to adversely or positively affect inclusion policies’ (p. 77). Further, the focus on regular principals acknowledges that the majority of students with disruptive behaviours are enrolled in regular schools (NSW DEC, 2011).
This study explores the attitudes of principals towards the inclusion of students with disruptive behaviour in NSW, Australia. The NSW Government is the largest education provider in Australia, with 741,061 students enrolled in 2200 NSW public schools. More than half of these students are supported in approximately 1700 primary schools across the state (NSW DEC, 2011). Approximately 12% of these students have a disability or special need. Students with social, emotional and behavioural disorders make up an increasing percentage of this group, with 41% of the 15,006 students with an identified disability in regular schools falling under the mental health classification (NSW DEC, 2011). Although some separate educational provision exists, the numbers of students accessing these services are smaller, approximately one fifth of the numbers in regular schools (Parker & New South Wales Parliament Legislative Council General Purpose Standing Committee, Reference Parker2010). Graham and Sweller (Reference Graham and Sweller2011) suggested that the students in segregated settings are more likely to be of high school age. These figures would then suggest that students with disruptive behaviour are in their greatest numbers in NSW primary schools. With this in mind, this paper addresses the following research objectives for NSW Government primary schools:
• To consider the attitudes of principals towards the inclusion of students with disruptive behaviour into regular schools.
• To examine the relationship between principals’ attitudes and selected demographic variables.
• To explore whether attitudes and emotional responses towards students with disabilities are affected by disability type and availability of resources.
• To highlight points of tension and areas for future attention to enhance inclusive practice in schools.
Method
Sample
The participants for this study were drawn from government school primary principals across NSW. The NSW Department of Education and Communities is the educational authority responsible for government school provision in NSW and is referred to throughout the paper as the DEC. Ethical approval for the study was gained from The University of Sydney Human Research Ethics Committee. Permission to conduct research in NSW Public Schools was also provided by the DEC State Education Research Approval Process (SERAP).
Principals in the sample were from 1702 NSW regular primary schools for students aged 5–12 years, which included schools with support classes for students with an identified behavioural disorder (support classes EDBD). Email addresses of principals were sourced through the NSW Primary Principals’ Association (NSW PPA) website, through school websites and through direct contact with schools. An initial stratified random sample failed to provide a large enough sample (N = 95) and saturation sampling (Bailey, Reference Bailey2004) was employed to expand the dataset to a final sample size of N = 340, which represents 20% of all primary principals across NSW. The dataset was checked for representativeness across NSW by school size, geography and socioeconomic characteristics using statistical data from the NSW Government's 2009 annual report (NSW DET, 2009) and Australian Bureau of Statistics 2006 census data cubes (Pink, Reference Pink2008). The complete dataset is largely representative; however, it is worth noting that female principals were slightly overrepresented.
The survey was distributed electronically using Survey Monkey® to all principals’ email addresses. Completion of the survey formed consent for participation. A series of follow-up emails were sent to increase the sample size. An initial follow-up email was sent to all principals, followed by a second email to principals of small schools (schools with less than 160 students), who were not equally represented in the initial sample.
Instrument
The Principals and Behaviour Survey (PABS) is a new composite scale built upon a foundation of existing validated studies measuring principals’ responses to the constructs of the integration or inclusion of students with disabilities in regular schools (Avramidis, Bayliss, & Burden, Reference Avramidis, Bayliss and Burden2000b; Bailey, Reference Bailey2004; Praisner, Reference Praisner2003). PABS contains multiple scales exploring the attitudes, knowledge and confidence of principals around students with disruptive behaviour. PABS has six sections. Sections I through III provide the demographic characteristics of the principals. Section IV provides knowledge and confidence measures, and Section VI provides some additional prevalence data.
Principals’ attitudes were measured through the scales in Section V and VI. Section V contains a 26-item Likert scale, developed by compositing three existing validated scales: School Principals’ Attitudes Towards Inclusion (Bailey, Reference Bailey2004), the Principals and Inclusion Survey (Praisner, Reference Praisner2003), and Opinions Relative to Mainstreaming (Larrivee & Cook, Reference Larrivee and Cook1979), modified by Avramidis et al. (Reference Avramidis, Bayliss and Burden2000a, Reference Avramidis, Bayliss and Burden2000b). The three scales were combined, duplicate items removed, items related to students with specific disabilities (e.g., physical or sensory) also removed and wording changed to ‘students with disruptive behaviours’ in place of ‘students with disabilities’. As a result of these changes, three NSW principals reviewed the survey for clarity of instructions, and minor modifications were made prior to conversion to an online instrument. The online survey was given a final check for functionality by the deputy principal from a metropolitan primary school.
Section VI contains three semantic differential scales consisting of seven bipolar adjectives such as ‘comfortable, uncomfortable’, ‘unhappy, happy’. The scales were adapted from the two scales used by Avramidis et al. (Reference Avramidis, Bayliss and Burden2000a, Reference Avramidis, Bayliss and Burden2000b). These have been expanded upon to include a third grouping that focuses on the availability of resources and supports. The three categories include (a) students with intellectual, physical or sensory disabilities, (b) students with emotional and behavioural disorders with funding and (c) students with disruptive behaviour and no funding. The DEC provides funding to schools based on the clinical diagnosis of a disability or mental health condition for individual students. Funding is in the form of an annual financial payment to schools and is targeted towards salaries for teachers and teacher assistants (referred to in NSW as School Learning Support Officers or SLSOs), including professional development but not equipment or resources.Footnote 2
Employed in this study were both cognitive measures (Section V) and affective measures (Section VI), as the authors acknowledge that the complexity of attitudes may not be fully measured through a single cognitive scale (Avramidis et al., Reference Avramidis, Bayliss and Burden2000b; Bailey, Reference Bailey2004). The PABS is an extensive survey instrument and also contains multiple scales and measures beyond attitudes. In this paper, however, the authors refer only to the attitudinal measures and demographic characteristics of the sample.
Procedures
The attitudinal scale measured responses to a set of 26 positively worded and negatively worded items along a 5-point scale from strongly disagree (1) to strongly agree (5). Negatively worded items were reverse coded so that high means represent a more positive position towards the inclusion of students with disruptive behaviour (Field, Reference Field2009; Hair, Black, Babin, & Anderson, Reference Hair, Black, Babin and Anderson2010). As there were no a priori assumptions about the variables, exploratory factor analysis using principal component analysis (PCA) was conducted. For this present study, the purpose of PCA was to bring forward those item groupings that seem to have some form of conceptual affinity in relation to measuring principals’ attitudes towards the inclusion of students with disruptive behaviour in regular schools and to provide a basis for discussion around variable groupings (Bailey, Reference Bailey2004). Visual inspections of the correlation matrix combined with the Kaiser-Meyer-Olkin measure of sampling adequacy, KMO = .90, confirmed the appropriateness of exploratory factor analysis (Field, Reference Field2009; Hair et al., Reference Hair, Black, Babin and Anderson2010). Barlett's test of sphericity, χ2 (325) = 2929.541, p < .001, also indicated that the correlations between items were sufficiently large for PCA.
PCA was run with both orthogonal and oblique rotations using the default settings in PASW Version 18 (SPSS, 2009). Six components had eigenvalues over Kaiser's criterion of 1 and in combination explained 56% of the variance. The scree plot was ambiguous and a further parallel analysis was conducted that suggested the retention of three components (Henson & Roberts, Reference Henson and Roberts2006). The component correlation matrix showed no correlations above .30, hence an orthogonal rotation using varimax was selected (Field, Reference Field2009). PCA was run with three, four and five components, all of which contained cross-loading and low-loading variables.
Based on recommendations by Hair et al. (Reference Hair, Black, Babin and Anderson2010), the minimum cut-off values for variable loadings was set at .35. Rules of thumb recommend deleting cross-loading and low-loading variables if sufficient adequate- to strong-loading variables (.50 or better) exist on each factor (Costello & Osborne, Reference Costello and Osborne2005; Hair et al., Reference Hair, Black, Babin and Anderson2010). Six of the variables were subsequently removed. Parallel analysis confirmed the three-component solution for the revised 20-item scale, which accounted for 43% of variance. Subscale alphas for the three components were α = .82, α = .72 and α = .61.
Descriptive statistics and correlations were conducted between summated component scores, demographic variables and means from the semantic differential scale. A within-subject analysis of variance using the Greenhouse–Geisser έ adjustment also explored the difference in mean scores across the semantic differential scale.
Results
Demographic Characteristics of Principals
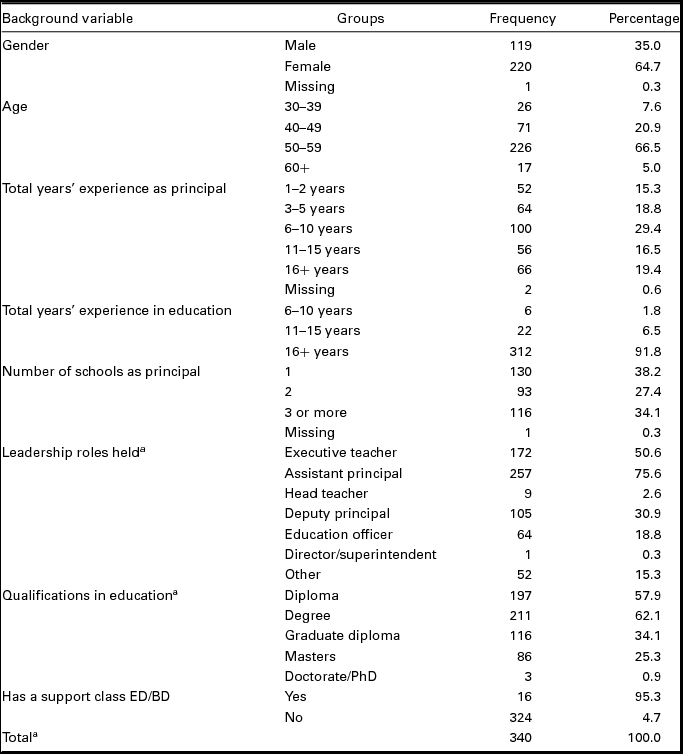
In terms of age, 92% of the principals were aged over 40 and two thirds were between 50 and 59 years. Ninety-two percent of the sample had 16 or more years’ experience in education. More than 90% of the sample had held a leadership position prior to becoming a principal; two thirds had more than six years’ experience as a principal and two thirds were in their second or third school as a principal. Sixteen principals reported having a support class (EDBD) in their school. Overall, the sample contains an experienced group of principals. Female principals are overrepresented in the sample. Approximately 50% of all principals in NSW were female compared with 65% of the sample (NSW DET, 2009). Demographic characteristics of the sample population are presented in Table 1.
Demographic Characteristics of the Sample

aPercentages will not equal 100 as principals may have held more than one leadership role or have more than one qualification.
Attitudes of Principals Towards Students With Disruptive Behaviour
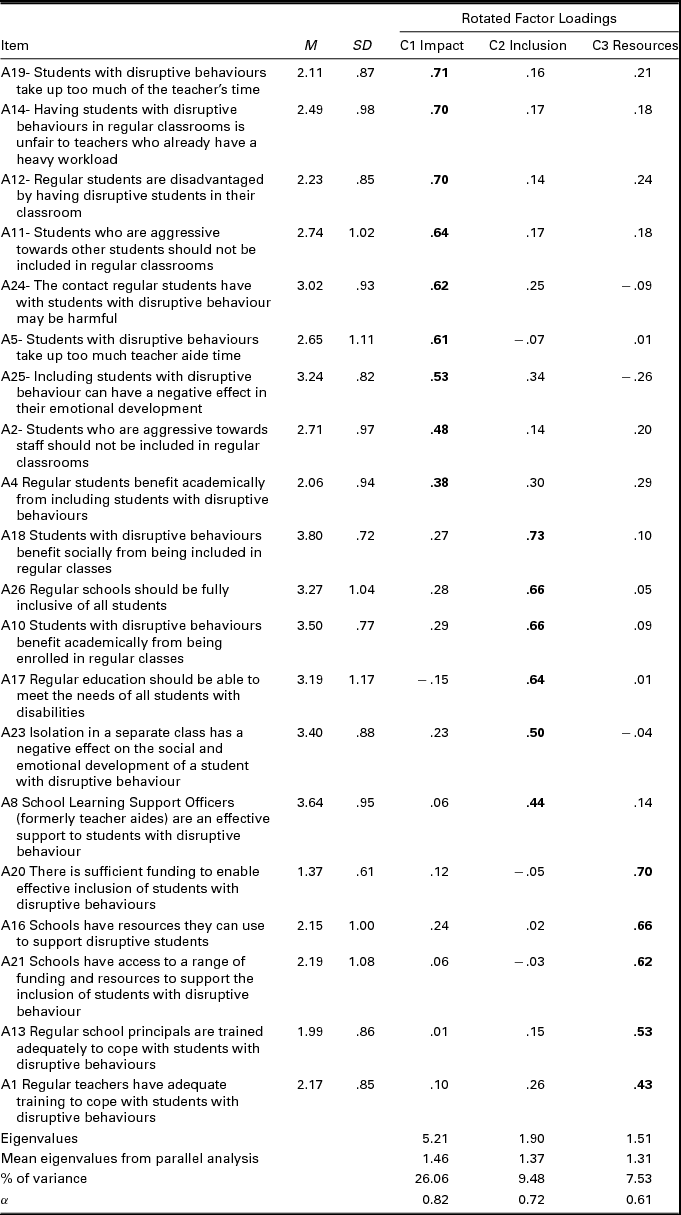
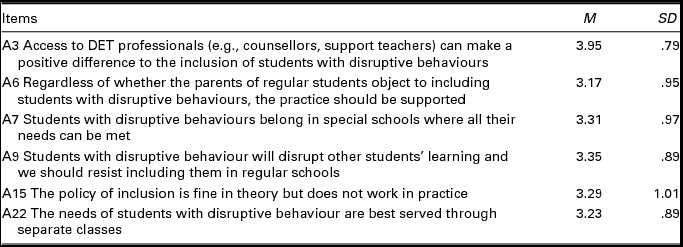
The average of all item means across the original 26-item attitudinal scale was 2.86; the lowest mean was 1.37 and the highest mean was 3.95. Highest means related to the support provided by DEC professionals, such as counsellors and support teachers (3.95) and SLSOs (3.64), as well as the social benefits of inclusion to students with disruptive behaviour (3.80). Lowest means related to the existence of sufficient funding (1.37) and training of principals (1.99).
Principal component analysis (PCA) with varimax rotations provided three components, accounting for 43% of the total variance. The three-factor solution represented the ‘cleanest’ structure (Costello & Osborne, Reference Costello and Osborne2005, p. 3) with all factors loadings greater than .35 (Hair et al., Reference Hair, Black, Babin and Anderson2010), no cross-loading items and conceptual affinity between items within each component. Labels have been applied to each of the three components to describe the individual dimensions. Component 1, Impacts, describes variables related to the impact of inclusion on students and staff, which include both positive and negative impacts. Component 2, Inclusion, describes perspectives on statements on inclusion and on its benefits for students with disruptive behaviour. The final component, Resources, describes teacher training and funding. Table 2 identifies each variable loading in the final solution. Eigenvalues from the parallel analysis have also been included. Table 3 contains means and standard deviations for the six deleted items.
Component Loading for Principal Component Analysis with Varimax Rotation for the PABS Attitudinal Scale
Note. Factor loadings > .35 are in boldface. The eigenvalue of the fourth factor was 1.14 (lower than the mean eigenvalue of 1.25 in the parallel analysis and therefore not retained). Items reverse coded are shown with a - sign.
Means and Standard Deviations for the Deleted Items from the PABS Attitudinal Scale
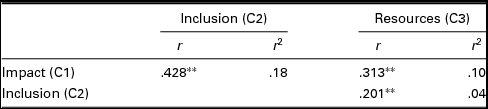
Pearson Product Moment Correlations conducted between summated component scores revealed significant correlations at p < .01 (two-tailed) for all three summed variables. The strongest correlation was between Impacts and Inclusion, r(338) = .43, p < .01 (two-tailed), accounting for 18% of variance explained. The moderate effect size (Field, Reference Field2009; Hair et al., Reference Hair, Black, Babin and Anderson2010) suggests that principals who are more positive about inclusion and its benefits to students with disruptive behaviour may also be more likely to report lower levels of impact upon schools. Statistically significant correlations among all the variables, listed in Table 4, show that principals who hold more positive views in any one of the three components, hold more positive views across all three components to varying degrees.
Correlations Between Summed Components From PABS Attitudinal Scale (N = 340)
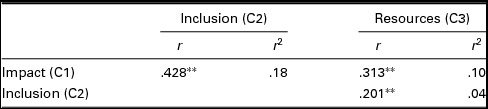
Note. r 2 effect size based on Cohen (1998, 1992, as cited in Field, Reference Field2009, p. 57) where .01 = small, .09 = medium, and .25 = large.
**Correlation significant at p < .01.
Relationship Between Principals’ Attitudes and Demographic Characteristics
Correlations conducted between components and demographic variables showed no significant relationships between attitudes for the Impacts component or Inclusion component for age, gender, years of experience in education, number of schools as principal or levels of prior leadership positions. A small relationship was found between principals’ attitudes towards the impact of students with disruptive behaviour on schools and the size of the school, r(338) = .15, p < .01 (two-tailed), which only accounted for 2% of the variance. This suggests that as enrolments increase a small portion of principals’ attitudes are impacted. Perhaps a more salient point is the reverse: principals report an impact of students with disruptive behaviour in smaller schools. A significant relationship, r(338) = .17, p < .05 (two-tailed), was also found between the component Inclusion and the number of students in the school with a diagnosed mental health condition (expressed as a percentage of school enrolment population). The small but significant finding suggests that principals with a greater representation of students identified with mental health conditions within their school hold slightly more positive views about their inclusion. A Spearman's rho correlation found no relationship between the attitudes of principals and the presence of a support class EDBD, but it is worth noting that the number of schools in the sample was very small (less than 5%).
Emotional Responses to Inclusion of Students With Disruptive Behaviour
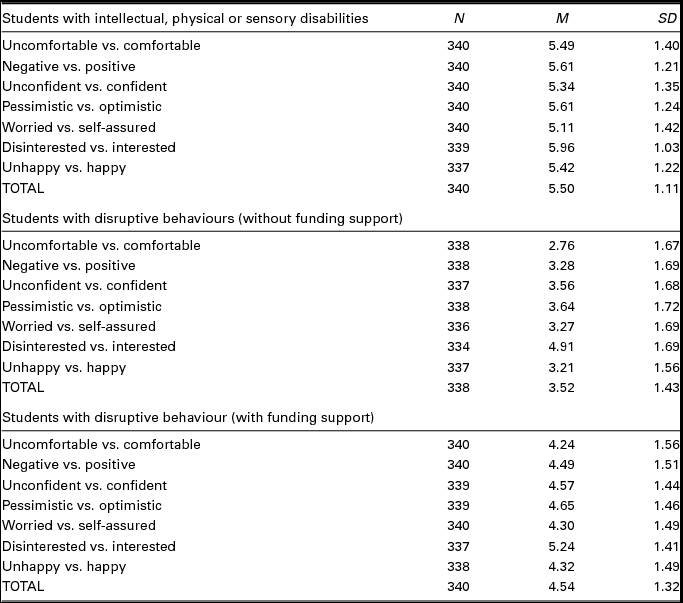
The results of the semantic differential scale indicated that attitudes differed for each group on a continuum of least positive to most positive. Principals held their most positive views in response to the vignette describing students with intellectual, physical or sensory disabilities (M = 5.50). Principals’ feelings were significantly less positive (M = 3.52) when the student was described as having disruptive behaviours and the school was provided with no additional financial support. The presence of funding did appear to mediate these views as attitudes rose when funding was provided (M = 4.54). A full description of mean scores is provided in Table 5 for each individual item and total means overall for each category. Highest means across all categories were for the bipolar adjectives ‘interested’ versus ‘disinterested’ (M = 5.96, M = 5.24, M = 4.91).
Item Means for Emotional Response Scales
Descriptive analysis of the mean scores showed that emotional responses decrease for students with disruptive behaviour and again further decrease when the condition of funding is removed from the descriptor. A within-subject analysis of variance using the Greenhouse–Geisser έ adjustment, revealed these differences to be statistically significant, F(1.8, 622.05) = 434.17, p < .0001, partial η2 = .58.
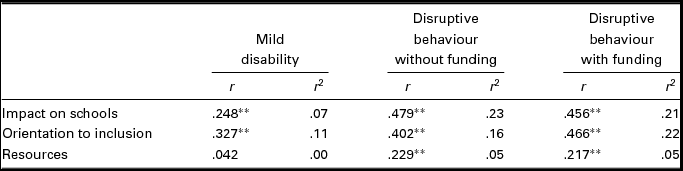
Pearson Product Moment Correlations were conducted between the emotional response scales and the three attitude components, with results presented in Table 6. Moderate relationships were found between the components of Inclusion and Impacts across the two vignettes relating to students with disruptive behaviour, suggesting that principals who are more positive towards inclusion also hold more positive ‘feelings’ when confronted with enrolling students with disruptive behaviour (i.e., they are more interested, confident, happier). These are in contrast to the smaller relationships for sensory, physical and intellectual disabilities and for the component Resources.
Pearson Correlations Between Emotional Response Scales and Attitude Components (N = 340)
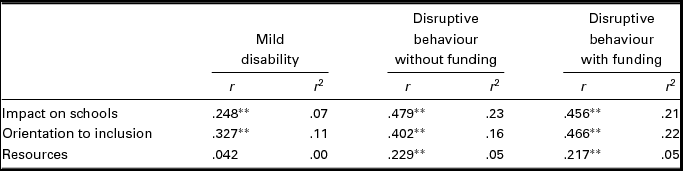
Note. r 2 effect based on Cohen (1998, 1992, as cited in Field, Reference Field2009, p. 57) where .01 = small, .09 = medium, and .25 = large.
**Correlation significant at p < .01. *Correlation significant at p < .05.
Discussion
The purpose of this study was to explore principals’ attitudes towards the inclusion of students with disruptive behaviour in their schools. The study is set in the context of increases in the percentage of students enrolled in regular schools, the increased movement of students into segregated settings (Graham & Sweller, Reference Graham and Sweller2011) and the existing knowledge and research in relation to principals’ attitudes towards the inclusion of all students with disabilities. With these considerations in mind, it seemed an important piece of the inclusion puzzle to explore principals’ attitudes specifically towards this group of students. It is acknowledged that a range of services to support students with disabilities is a feature of NSW schooling and it is not the intent of this paper to comment on the efficacy of this range of services. The presence of students with disruptive behaviours in high numbers in regular schools and the role that principals play does, however, warrant continued discussion in our efforts to continually improve outcomes and participation for this group of students.
Principals in the study were found to hold marginal positive attitudes towards inclusion. They see as positive both the academic and social benefits for students with disruptive behaviour being in their local schools, surrounded by their local peers. In contrast, their views become more negative when considering the impact of disruptive behaviour on staff and students’ peers.
The finding of such tensions is not new and some argue these tensions represent an understandable balancing of competing needs and policy demands (Bailey & du Plessis, Reference Bailey and du Plessis1998). This position can, however, seem at odds with the concepts of inclusion and the realities of schools. The caveats around aggression, disruption to staff, as well as levels of funding that appear to define which students are perceived as appropriate for regular schools and classrooms, and which are not, are consistent with some of the prior attitudinal work on principals and inclusion (Graham & Spandagou, Reference Graham and Spandagou2011; Praisner, Reference Praisner2003). This is not to suggest that principals do not struggle with the dichotomies; the apparent tensions in these attitudes would suggest they do. That principals see the benefits for students with disruptive behaviours in their regular schools both as academic and social would suggest that seeking ways to enable or enhance the capacity of schools to better support students may be viewed favourably by principals. Weighing up the impacts of students with disruptive behaviour upon their schools may be more about working with staff, students and communities and attempting to balance a range of complex attitudes, policy expectations and community reputation (Graham & Spandagou, Reference Graham and Spandagou2011). This may represent a ‘sound and rational’ approach to managing the complexity of schools (Bailey & du Plessis, Reference Bailey and du Plessis1997, p. 437) but may not always be in the best interests of students with disruptive behaviour. These dichotomous views also suggest that the inclusion of students with disruptive behaviour represents a key point of the collision of values and accountability that can characterise principals’ work (MacBeath & Townsend, Reference MacBeath, Townsend, Townsend and MacBeath2011b).
Although the authors acknowledge that the results of the present study were unable to account for all the factors that may be impacting on principal attitudes, the findings do suggest that positive attitudes can play some role in influencing principals’ overall perspectives. Positive attitudes have been identified as one of the key pillars of support for inclusive education (Loreman, Reference Loreman2007) and the increased positivity of principals appears to have some level of ‘flow-on’ effect in terms of the way principals view these observed tensions and the role that resources and training play in supporting students and staff. Professional learning support that challenges the ways in which disruptive behaviour is defined (Beaman et al., Reference Beaman, Wheldall and Kemp2007; Graham & Sweller, Reference Graham and Sweller2011), combined with strategies to enhance the knowledge and skills of principals and their communities, may go some way to further addressing these tensions. Research into the Positive Behaviour for Learning (PBL) approach adopted in Western Sydney Region of NSW has shown some positive benefits when whole school approaches are heavily supported by school leaders, particularly around changing staff attitudes (Mooney et al., Reference Mooney, Dobia, Power, Watson, Barker, Yeung and Schofield2008). The authors of this research (Mooney et al., Reference Mooney, Dobia, Power, Watson, Barker, Yeung and Schofield2008), however, recognised that other factors may be contributing to the success in some schools that were not measured using PBL's School-Wide Evaluation Tool. Vinson (Reference Vinson2002) also made reference to NSW school principals who have ‘turned around’ schools through the use of positive school-wide approaches (p. 71). Common to the findings of Vinson (Reference Vinson2002) and Mooney et al. (Reference Mooney, Dobia, Power, Watson, Barker, Yeung and Schofield2008) is that the active leadership role of the principal was seen to play an important role in school adoption of programs and their ongoing success.
It is neither surprising nor unique to find that principals who hold more positive views about inclusion in general have more positive tendencies towards students with disruptive behaviour, their impact on schools, the availability of resources and levels of training for staff. This level of positivity, for NSW principals, is largely unaffected by age, experience, qualifications or school location. Principals who hold more positive views were spread across the state and across age groups. This is an interesting finding that also suggests that other factors are likely to be influencing variations in principal positivity. This also sits in contrast to some of the international work suggesting that older teachers hold more negative views (Cornoldi, Terreni, Scruggs, & Mastropieri, Reference Cornoldi, Terreni, Scruggs and Mastropieri1998), but does align with early Australian research that found principals’ views were generally more positive than teachers (Center et al., Reference Center, Ward, Parmenter and Nash1985). There are a number of potential explanations for such differences in attitudes once demographic characteristics are removed, which make this subject worthy of further detailed investigation. The small relationship found between principals’ positivity and the percentage of students with ‘diagnosed’ disruptive behaviour in the school suggests that experience with students is one of the possible factors contributing to more positive attitudes. Others have made this link (Barnett & Monda-Amaya, Reference Barnett and Monda-Amaya1998; Graham & Spandagou, Reference Graham and Spandagou2011; Praisner, Reference Praisner2003). The finding could also suggest that the provision of resources impacts on positivity. Given that this relationship is much smaller, it is also possible to draw a bow to suggest that principals with more positive attitudes are able to look beyond conditional funding barriers and see opportunities for how to use resources and training as opposed to a conditional stance that can limit opportunities to success. This suggestion supports the concept of reciprocity discussed by Graham and Spandagou (Reference Graham and Spandagou2011) where attitudes shape and are shaped by schools. Positive attitudes lead to positive solutions and positive outcomes that further support positive attitudes, and so the cycle goes.
It is recognised that students and schools require additional support to achieve positive outcomes for students with a range of disabilities (Parker & New South Wales Parliament Legislative Council General Purpose Standing Committee, Reference Parker2010). The existence of this support, specifically through funding, has a significant effect on the emotions of principals, but so too does simply the presence of the characteristic of behaviour as opposed to other disability categories. Principals’ levels of comfort, positivity, and confidence significantly decreased when the disability became ‘disruptive’ and even further still when no financial support was provided. Given the principals’ role in leading and inspiring inclusive cultures, these emotional response differences are likely to have a significant bearing on how school communities perceive and respond to students with disruptive behaviour. A positive attitude towards inclusion in general (Component 2: Inclusion) and the school's ability to ‘manage’ (Component 1: Impact) appear to be moderate mediators on these effects. The relationships between these positive attitudes and greater levels of comfort and happiness, for example, again suggest that attitudes have some impact across the board, though for Resources this relationship is much smaller and more tenuous. Principals were clear that schools require more resources and both principals and their staff require more training, but it could be argued that positive attitudes are likely to make some schools more receptive to such interventions than others and that positive school cultures and achievements may be the result of an already existing range of approaches (Mooney et al., Reference Mooney, Dobia, Power, Watson, Barker, Yeung and Schofield2008). A case could also be made that school interventions require a flexible focus that includes developing positive attitudes towards disruptive behaviour as well as upskilling school communities in a range of effective strategies, which would involve a greater integration of mental health initiatives, behaviour strategies and social/emotional learning (Mooney et al., Reference Mooney, Dobia, Power, Watson, Barker, Yeung and Schofield2008). Research by De Jong (Reference De Jong2005), which informed the National Safe Schools Framework (Australian Government, 2011), provides a model of an integrated approach to developing safe and supporting school cultures, which has not been widely implemented in schools (Cross et al., Reference Cross, Epstein, Hearn, Slee, Shaw and Monks2011).
Professional learning has also been shown to have positive effects on teacher practice (Day, Reference Day2007; Hattie, Reference Hattie2009; Robinson, Reference Robinson2007; Wachholz & Christensen, Reference Wachholz and Christensen2003; Wei, Darling-Hammond, Andree, Richardson, & Orphanos, Reference Wei, Darling-Hammond, Andree, Richardson and Orphanos2009), and raising awareness of disability issues has shown some promise in improving attitudes for some groups (Bailey, Barr, & Bunting, Reference Bailey, Barr and Bunting2001; D’Alonzo, Giordano, & Cross, Reference D’Alonzo, Giordano and Cross1996; Spandagou et al., Reference Spandagou, Evans and Little2008). Careful consideration, however, needs to be given to the models of professional learning required to support students with disruptive behaviour and the relationship between effective practices and individual teacher knowledge (Cook, Landrum, Tankersley, & Kauffman, Reference Cook, Landrum, Tankersley and Kauffman2003; Cook, Tankersley, & Harjusola-Webb, Reference Cook, Tankersley and Harjusola-Webb2008). How these also combine within the context and the school (Gersten & Dimino, Reference Gersten and Dimino2001) may in part be influenced by the attitudes of principals.
In summary, these findings show that despite legislative changes, including the Disability Discrimination Act (Commonwealth of Australia, 1992) and the Disability Standards for Education (Commonwealth of Australia, 2006), which have resulted in increased participation in regular schooling for some students, attitudes towards students with disruptive behaviour remain largely unchanged over time. This is a complex problem with no easy solution, and principals clearly struggle with the ideological tug of war that these issues create. The findings of this study suggest that principals who hold more positive attitudes also think more positively about impacts on schools and the use of resources. Although we can offer some possible explanations for why these may occur, the correlational nature of this study and the other considerations that remain unaccounted for through this scale means these explanations are tentatively offered as only one part of a larger complex puzzle.
Limitations
The tentative explanations offered should take into account the limitations present in the current study. The survey instrument developed for this study was not formally tested for its construct validity or internal consistency reliability. A small pilot was conducted to improve the clarity of the instrument that resulted in minor modifications. A slightly lower alpha for the Resources subscale identified through the PCA process should lead to some caution in interpreting correlations between these components and other variables. Despite the sample being representative of the demographic characteristics of NSW schools, the use of saturation sampling means that participation was entirely voluntary and it is possible that those most interested in the topic chose to respond. The large sample size goes some way to addressing this limitation. Additionally, attitudinal surveys also fail to take into account the unique complexities of individual circumstances, nor allow many opportunities for principals to qualify their responses, which was noted by several respondents.
The PCA explained only 43% of the variance. This leaves a large proportion of the variance in participants’ scores not explained by the three components. This is perhaps the most significant limitation, which suggests that further work is needed in exploring principals’ perspectives on the inclusion of students with disruptive behaviour; this may involve considering broader perspectives including mental health programs and other initiatives in schools that may be supporting this group of students.
Conclusions and Future Directions
There is no denying that the role of the principal is a complex one that requires significant skill in balancing competing demands, increasing accountability and a narrowing conception of school effectiveness dominated by measures of academic performance and school comparison (MacBeath & Townsend, Reference MacBeath, Townsend, Townsend and MacBeath2011a). Little empirical work exists that fully explores the role that principals play in contributing to successful outcomes for students with disruptive behaviour despite its relative prominence as an ongoing educational issue for schools. There is no doubt that principals feel greater levels of resources are needed to support them to achieve these goals, but this study suggests that attitudinal factors may also play a part in how principals lead schools that are supportive of students whose behaviour is judged to be disruptive. Holding more positive views appears to have a reciprocal positive relationship with principals’ attitudes to training, resources, the impact of students with disruptive behaviour on their schools and their overall feelings about students. Having experience with students with disruptive behaviour in greater numbers in the school also appears to have some relationship with more positive views. This would suggest professional learning approaches in schools need to be able to challenge attitudinal barriers, enhance both teacher and principal capacity and see principals take a leading role in promoting inclusivity for this group of students. There is a chicken and egg argument about the adoption of ‘evidence-based practices’ in schools and the beliefs and value systems of the school; does one presuppose the other? The role of positive principal attitudes suggests that principals and schools need both. This study makes a contribution to the limited body of knowledge around principals’ practice and suggests that further work is needed to understand the extent of principals’ knowledge in order to support principals to manage these tensions and adopt approaches to positively lead their school community.