INTRODUCTION
The Palmer Drought Severity Index (PDSI) was one of the first indices to achieve an important level of success at monitoring drought events (Ma et al., Reference Ma, Ren, Singh, Tu, Jiang and Liu2015; Wells et al., Reference Wells, Goddard and Hayes2004), because it attempts to encapsulate such phenomenon on regional bases (Alley, Reference Alley1984). A key-step of the PDSI algorithm is to calculate the amount of precipitation required to meet a normal water balance level. This quantity is called Climatically Appropriate For Existing Conditions (CAFEC) Precipitation and it takes into account precipitation, evapotranspiration and others parameters of the climate water balance related to soil moisture (Wells et al., Reference Wells, Goddard and Hayes2004). The differences (d) between a particular precipitation record and the corresponding CAFEC precipitation were regarded by Palmer (Reference Palmer1965) as a relative measure of the current climate condition in respect to normal/expected condition. The other steps of the PDSI algorithm attempt to transform d into an invariant indicator of moisture anomaly (the z-index) within time and space domain. The increment of drought or flood events between two successive periods (usually months) are specified by duration factors, which assume a linear relationship between the current index value and the summation of the z-index (Wells et al., Reference Wells, Goddard and Hayes2004).
Two of the most common criticisms over the original PDSI algorithm are that (i) it frequently fails to produce values that can be easily compared among distinct climate conditions (e.g., Vicente-Serrano et al., Reference Vicente-Serrano, Van der Schrier, Beguería, Azorin-Molina and Lopez-Moreno2015; Wells et al., Reference Wells, Goddard and Hayes2004) and that (ii) it cannot be calculated at different time scales (e.g., Blain et al., Reference Blain, De Avila and Pereira2018). In addition, although the PDSI algorithm may be calculated for different values of Available Water Capacity (AWC), a review on drought literature reveals that this index has frequently been calculated for a single AWC value (100 mm, as early suggested by Palmer, Reference Palmer1965). One of the few exceptions are the studies of Ma et al. (Reference Ma, Ren, Singh, Tu, Jiang and Liu2015) and Vicente-Serrano et al. (Reference Vicente-Serrano, Van der Schrier, Beguería, Azorin-Molina and Lopez-Moreno2015) that used globally gridded 1° × 1° AWC values provided by Webb et al. (Reference Webb, Rosenzweig and Levine2000). In order to improve the spatial comparability of the PDSI, Wells et al. (Reference Wells, Goddard and Hayes2004) proposed the self-calibrated PDSI (Sc-PDSI) that attempts to standardize the variability of the index at any location by using characteristics of the local climate (Wells et al., Reference Wells, Goddard and Hayes2004). This latter version of the Palmer Index has indeed improved the spatial comparability of the PDSI (Wells et al., Reference Wells, Goddard and Hayes2004) and has turn it into a more suitable drought metric (Trenberth et al., Reference Trenberth, Dai, Van Der Schrier, Jones, Barichivich, Briffa and Sheffield2014). However, as observed by its proposing study, the Sc-PDSI is not as spatially comparable as other Standardized Drought Indices (SDI), such as the Standardized Precipitation Index (SPI, Mckee et al., Reference Mckee, Doesken and Kleist1993), which is calculated by means of nonlinear methods. As the PDSI, the Sc-PDSI cannot be regarded as a multi-scalar index (Blain et al., Reference Blain, De Avila and Pereira2018) that recognizes the importance of different time scales on drought quantification (Guttman, Reference Guttman1998).
SDI are probability-based algorithms that measure normalized anomalies in a particular variable accumulated at a specified time scale (Blain et al., Reference Blain, De Avila and Pereira2018; Guttman, Reference Guttman1998; Stagge et al., Reference Stagge, Tallaksen, Gudmundsson, Van Loon and Stahl2015; Vincente-Serrano et al., Reference Vicente-Serrano, Beguería and López-Moreno2010a; Wu et al., Reference Wu, Svoboda, Hayes, Wilhite and Wen2007). SDI, such as the SPI and the Standardized Precipitation-Evapotranspiration Index (SPEI; Vicente-Serrano et al., Reference Vicente-Serrano, Beguería and López-Moreno2010a), have been widely tested and used in virtually all regions of the globe because they are normalized in time and normalized to a location (Wu et al., Reference Wu, Svoboda, Hayes, Wilhite and Wen2007). In Brazil, both SPI and SPEI are used in academic as well as operational mode by agricultural research institutions such as the Instituto Agronômico (IAC) and the Empresa Brasileira de Pesquisa Agropecuária (EMBRAPA). In spite of this use in agricultural studies, none of these SDI can be calculated for distinct AWC values. Further information on the SPI and SPEI can be found in Wu et al. (Reference Wu, Svoboda, Hayes, Wilhite and Wen2007), Vincente-Serrano et al. (Reference Vicente-Serrano, Beguería and López-Moreno2010a), Stagge et al. (Reference Stagge, Tallaksen, Gudmundsson, Van Loon and Stahl2015), Vicente-Serrano and Beguería (Reference Vicente-Serrano and Beguería2016) and Blain et al. (Reference Blain, De Avila and Pereira2018).
Aiming at joining the advantages of the PDSI algorithm with those of the above-mentioned standardized indices, Ma et al. (Reference Ma, Ren, Yuan, Jiang, Liu, Kong and Gong2014) proposed the hypothesis that the d factor from the PDSI algorithm may be transformed into a multi-scalar drought index sharing the same normalized nature of others SDI. This latter study developed the Standardized Palmer Drought Index (SPDI), which was designed as a normalized drought index that takes into account precipitation, evapotranspiration and others parameters of the climate water balance related to soil moisture conditions. Although, as previously described, Ma et al. (Reference Ma, Ren, Singh, Tu, Jiang and Liu2015) have used different AWC values to calculate several versions of the Palmer's index, the normalized nature of the SPDI has not been formally tested. In other words, the SPDI has not been subjected to hypothesis tests used to (i) verify if a SDI is capable of representing floods and drought events in a similar probabilistic way (Wu et al., Reference Wu, Svoboda, Hayes, Wilhite and Wen2007) and to (ii) select candidate distributions for their calculation algorithm (Blain et al., Reference Blain, De Avila and Pereira2018; Vicente-Serrano and Beguería Reference Vicente-Serrano and Beguería2016; Stagge et al., Reference Stagge, Tallaksen, Gudmundsson, Van Loon and Stahl2015; Vicente-Stagee et al., Reference Vicente-Serrano and Beguería2016).
Therefore, the goal of this study is to verify if SPDI series generated from distinct AWC values are capable of meeting the normally assumption expected from any SDI. On such background, the hypothesis that d can be transformed into a SDI were evaluated by statistical procedures used to assess and improve the performance of widely used drought indices (e.g., SPI and SPEI; Blain et al., Reference Blain, De Avila and Pereira2018; Stagee et al., Reference Stagge, Tallaksen, Gudmundsson, Van Loon and Stahl2015; Reference Stagge, Tallaksen, Gudmundsson, Van Loon and Stahl2016; Vicente-Serrano and Beguería Reference Vicente-Serrano and Beguería2016; Wu et al., Reference Wu, Svoboda, Hayes, Wilhite and Wen2007). The testing region was the State of São Paulo, a tropical-subtropical region of Brazil. Time scales ranging from 1- to 12-month (Blain et al., Reference Blain, De Avila and Pereira2018) and AWC values equal to 50, 100 and 150 mm have been considered in this study. The degree of correlation between the new SPDI and their corresponding SPI and SPEI series were also measured by means of Kendall's correlation analysis. Finally, as recommended by the World Meteorological Organization (WMO, Reference Svoboda, Hayes and Wood2012), a computational algorithm that facilitates the SPDI calculation has also been provided.
MATERIALS AND METHODS
Testing region
The State of São Paulo is situated in the tropical-subtropical region of South America (Tropic of Capricorn, 19° and 26° South latitude, and 53° and 44° West longitude). Its climate is influenced by monsoon and frontal systems (Raia and Cavalcanti Reference Raia and Cavalcanti2008, among others). The austral summer is the regional wet season mainly because of the South Atlantic Convergence Zone (SACZ). The lowest rainfall amounts are observed in winter season mainly because of the high pressure system of the South Atlantic (Vera et al., Reference Vera, Higgins, Amador, Ambrizzi, Garreaud, Gochis and Gutzler2006).
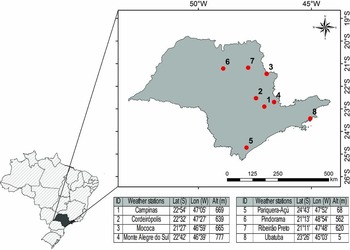
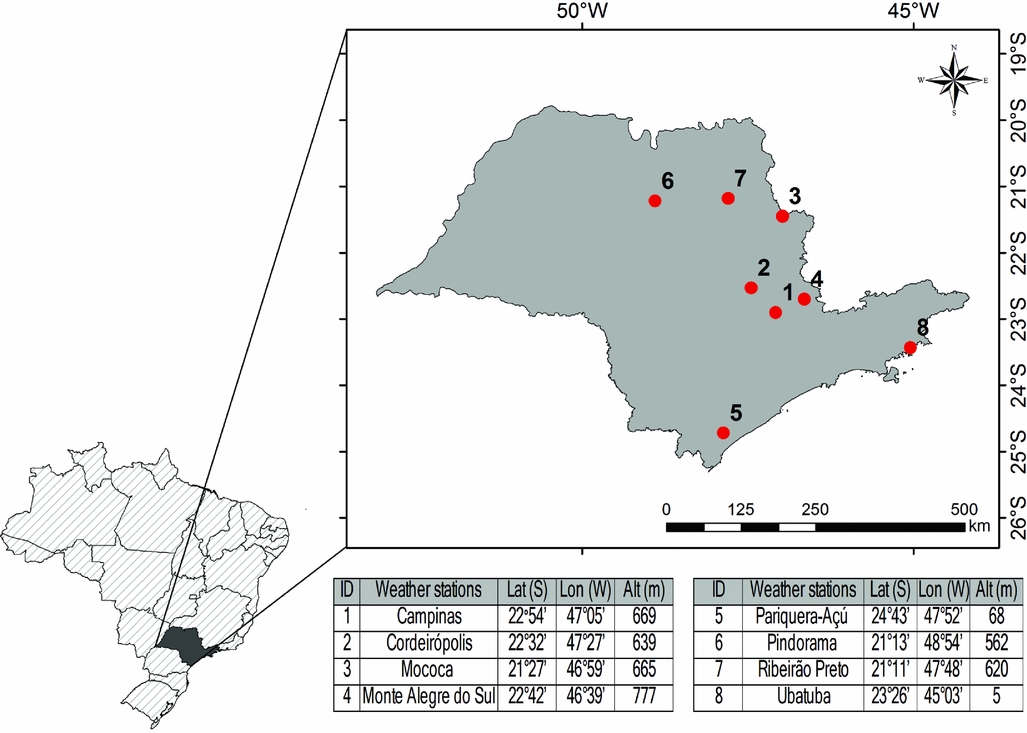
Daily rainfall and air temperature data were collected from eight weather stations of the Instituto Agronômico (IAC/APTA/SAA, 1960–2016). As described in Blain et al. (Reference Blain, De Avila and Pereira2018), these weather stations have been routinely used in scientific studies so that any missing record is replaced by data extracted from pluviographs and thermographs or from automatic weather stations situated at the same site. The percentage of missing records in none of these weather series was higher than 2%. In addition, these stations are situated in distinct climatic regions, ranging from the coastal area, where there is virtually no dry season, to the northwestern region of the state, where there is a distinctly dry season during austral winter (Figure 1). Further information on the consistence of this series can be found in Blain et al. (Reference Blain, De Avila and Pereira2018). Due to a lack of at-site meteorological data such as wind speed and net radiation, the Thornthwaite's method was used to estimate monthly potential evapotranspiration (PE) amounts (EP). Despite of its limitations, this method is suited to calculate EP values at monthly scale in the State of São Paulo (Camargo and Camargo, Reference Camargo and Camargo2000).
Weather stations in the State of São Paulo.
The original PDSI
The PDSI algorithm is based on a water balance model that can be calculated from different AWC levels. The following quantities related to soil moisture conditions (Wells et al., Reference Wells, Goddard and Hayes2004) are computed: PE, potential recharge (PR), potential runoff (PRO) and potential loss (PL). These quantities are used to estimate the coefficients of evapotranspiration (α), recharge (β), runoff (γ) and loss (δ), which are dependent on the local climate (Alley, Reference Alley1984). These coefficients are used to calculate the CAFEC precipitation (P.CAFEC; equation (1)).
 $$\begin{equation}
{\rm{P}}.{\rm{CAFEC}} = {\alpha _i}{\rm{PE}} + {\beta _i}{\rm{PR}} + {\gamma _i}{\rm{PRO}} + {\delta _i}{\rm{PL}}
\end{equation}$$
where i varies from 1 to 12 when the analysis is carried out on monthly basis.
The differences between observed precipitation (P) and P.CAFEC is computed for each i value (equation (2)). As described in Section 1, the following steps of the PDSI algorithm (Alley, Reference Alley1984; Palmer, Reference Palmer1965; Wells et al., Reference Wells, Goddard and Hayes2004) attempt to transform d into an invariant measure of moisture anomaly within time and space domains (Z; equation (3)).
 $$\begin{equation}
d & = & {\rm{P}} - {\rm{P}}.{\rm{CAFEC}}
\end{equation}$$ \\
 $$\begin{equation}
Z & = & d*K
\end{equation}$$
The Z-index was designed as a standardized moisture anomaly index that expresses the departures of the climatic conditions of a particular month from the average moisture climate of that month (Wells et al., Reference Wells, Goddard and Hayes2004, among others). Finally, the PDSI value for a particular j > 1 month is obtained from equation (4).
 $$\begin{equation}
{\rm{PDS}}{{\rm{I}}_i} = 0.897{\rm{PDS}}{{\rm{I}}_{i - 1}} + (1/3){Z_i}
\end{equation}$$
where 0.897 and (1/3) are the duration factors, and the PDSI values for the 1st month of the series assumes PDSI1=(1/3)Z1.
The use of equation (4) is not straightforward because it must be used to compute three PDSI index (X1, X2 and X3) for each month (e.g., Wells et al., Reference Wells, Goddard and Hayes2004). While X1 and X2 represent the severity of wet or dry spells, respectively, X3 represents the severity of the currently stablished event. In order to decide whether an established wet or drought event is over, Palmer (Reference Palmer1965) developed the Pe factor, which can be regarded as the probability that a particular wet or drought spell has actually ended.
Transforming the PDSI into a multi-scalar index: conceptual basis, normally assumption and correlation with others SDI
As previously described, standardized climatic indices attempt to normalize their input variables by applying a rational approach proposed by Abramowitz and Stegun (Reference Abramowitz and Stegun1965) to the cumulative probabilities of each input data. This normalized nature allows a SDI to represent wet and dry events in a similar probabilistic/normalized way (Wu et al., Reference Wu, Svoboda, Hayes, Wilhite and Wen2007). In other words, this normalized nature facilitates both temporal and spatial comparisons of drought and floods events (Lloyd-Hughes and Saunders, Reference Lloyd-Hughes and Saunders2002). Although the above-mentioned cumulative probabilities may be estimated from non-parametric methods, they are frequently calculated by fitting a parametric distribution to the input data accumulated at predetermined time scales (Blain et al., Reference Blain, De Avila and Pereira2018; Mckee et al., Reference Mckee, Doesken and Kleist1993; Stagge et al., Reference Stagge, Tallaksen, Gudmundsson, Van Loon and Stahl2015; Vicente-Serrano et al., Reference Vicente-Serrano, Beguería and López-Moreno2010a, among many others). On such background, the hypothesis that the PDSI can be transformed into a multi-scalar SDI may be evaluated by investigating if the above-mentioned normalization process can be successfully applied to d values (equation (2)) accumulated at distinct time scales, derived from different AWC levels and obtained from distinct locations.
Considering studies such as Ma et al. (Reference Ma, Ren, Yuan, Jiang, Liu, Kong and Gong2014), Vicente-Serrano & Beguería (Reference Vicente-Serrano and Beguería2016), Stagge et al. (Reference Stagge, Tallaksen, Gudmundsson, Van Loon and Stahl2016) and Blain et al. (Reference Blain, De Avila and Pereira2018), the Generalized Logistic (GLO) and Generalized Extreme Value (GEV) distributions were taken as candidate models to calculate the cumulative probabilities of d. The parameters of these two models were estimated by the Probability Weighted Moments method (PWM; PWM-GLO and PWM-GEV) and by the Maximum Likelihood method (MLE; MLE-GLO and MLE-GEV). The MLE estimates were calculated through the Nelder–Mead optimization method using PWM estimates as initial values (Stagge et al., Reference Stagge, Tallaksen, Gudmundsson, Van Loon and Stahl2015, Reference Stagge, Tallaksen, Gudmundsson, Van Loon and Stahl2016). The fit of all d series to these four candidate models (PWM-GLO, PWM-GEV, MLE-GLO and MLE-GEV) were evaluated by the Anderson–Darling test (AD; Anderson and Darling Reference Anderson and Darling1954). This goodness-of-fit test estimates the sum of the squares of the differences between parametrical and empirical cumulative functions. The critical values for the AD test were calculated by Monte Carlo Bootstrap procedures as described in several studies, including Stagge et al. (Reference Stagge, Tallaksen, Gudmundsson, Van Loon and Stahl2015). The AD test was used by Stagge et al. (Reference Stagge, Tallaksen, Gudmundsson, Van Loon and Stahl2015); (Reference Stagge, Tallaksen, Gudmundsson, Van Loon and Stahl2016) and Blain et al. (Reference Blain, De Avila and Pereira2018) to select candidate distributions for calculating both SPI and SPEI. In this study, the term ‘rejection rate’ refers to the number of times a specific model failed to fit the d series accumulated at each time scale divided by 96 (12 months and eight locations).
Besides fitting the input data well, the candidate model must lead to normally distributed SPDI series (e.g., Blain et al., Reference Blain, De Avila and Pereira2018; Stagge et al., Reference Stagge, Tallaksen, Gudmundsson, Van Loon and Stahl2015). In other words, the new index must be capable of representing wet and dry events in a similar probabilistic way (Wu et al., Reference Wu, Svoboda, Hayes, Wilhite and Wen2007). Therefore, all SPDI series were subjected to the Shapiro–Wilk normality test (Blain et al., Reference Blain, De Avila and Pereira2018; Stagge et al., Reference Stagge, Tallaksen, Gudmundsson, Van Loon and Stahl2015; Wu et al., Reference Wu, Svoboda, Hayes, Wilhite and Wen2007). In addition, the mean absolute error (MAE) between calculated SPDI values and their corresponding theoretical values generated from the standard normal distribution were also estimated. This latter procedure, recommended and improved by Vicente-Serrano & Beguería (Reference Vicente-Serrano and Beguería2016), Stagge et al. (Reference Stagge, Tallaksen, Gudmundsson, Van Loon and Stahl2016) and Blain et al. (Reference Blain, De Avila and Pereira2018) specifies which of the four models best approximates theoretical SPDI values obtained from the standard normal distribution (Blain et al., Reference Blain, De Avila and Pereira2018). The strategy of calculating the MAE only for those values falling within the range of typical events −2.0 ≤ SPDSI ≤ 2.0 (Blain et al., Reference Blain, De Avila and Pereira2018) has also been adopted in this study. This strategy was also applied to the Shapiro–Wilk test. All statistical tests have been performed at 5% significance level. The R-package fitdistplus (Delignette-Muller and Dutang, Reference Delignette-Muller and Dutang2015), was used in this study.
Finally, quantitative assessments of the correlation between SPDI and the other two SDI (SPI and SPEI) have been carried out by Kendall's tau method, which is a well-known non-parametric measure of dependence (Genest and Favre, Reference Genest and Favre2007). Both SPI and SPEI were calculated as recommended by Blain et al. (Reference Blain, De Avila and Pereira2018) at the same time scales used for calculating the SPDI (1- to 12-month). The frequency of occurrence of distinct SPDI values classified by the same wet and drought categories adopted by others SDI (e.g., Mckee et al., Reference Mckee, Doesken and Kleist1993 and WMO, Reference Svoboda, Hayes and Wood2012) was also calculated. As shown in the next section, these frequencies of occurrence supported our decision of given emphasis to the performance of the candidate models within the range of typical values [−2.0:2.0], given that 95% of the calculated SPDI fell within such categories.
RESULTS AND DISCUSSION
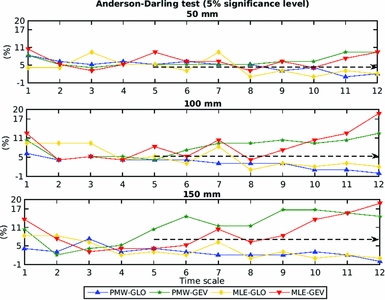
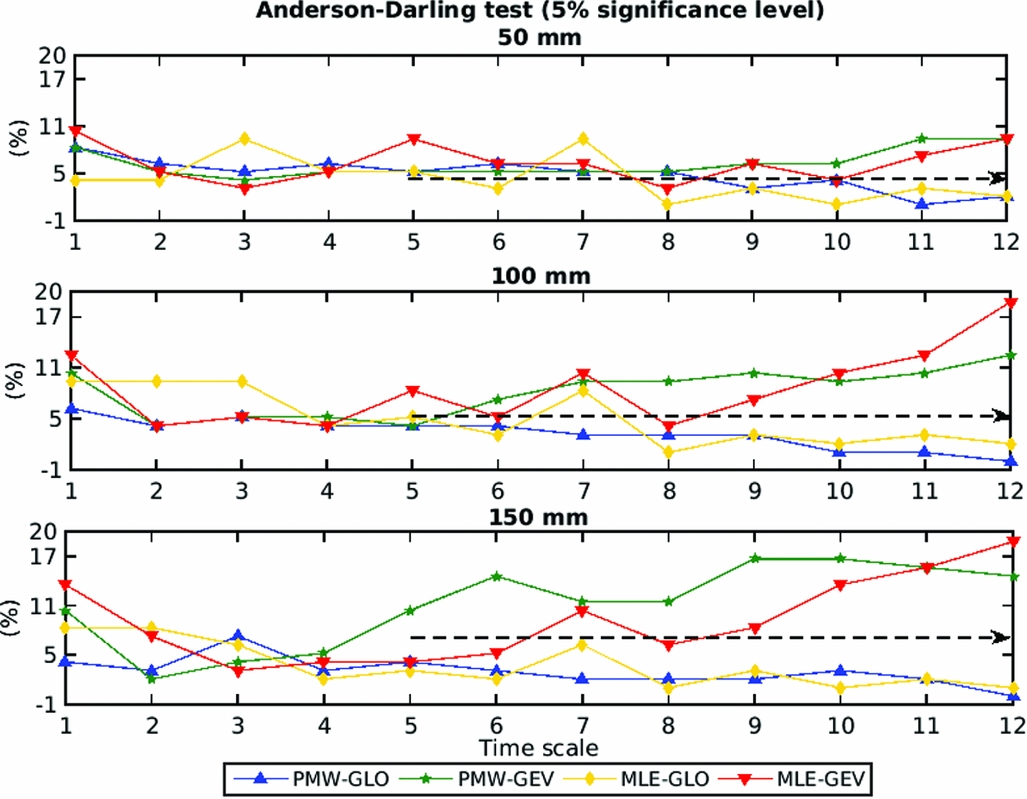
In general, the PWM-GLO distribution presented the best performance for fitting the d factors derived from the three AWC values (50, 100 and 150 mm; Figure 2). The rejection rates presented by this latter parametric model remained close to the adopted significance level (5%) at virtually all time scales. The MLE-GLO presented the second-best performance and both models based on the GEV distribution performed poorly for AWC values equal to 100 and 150 mm. This poor performance is particular evident for large time scales (≥5-month). Considering studies such as Stagge et al. (Reference Stagge, Tallaksen, Gudmundsson, Van Loon and Stahl2015) and Blain et al. (Reference Blain, De Avila and Pereira2018), the relative low rejection rates presented by the models based on the GLO are consistent with the idea that the d factor can be fitted to a parametric distribution. Therefore, the results of the AD test (Figure 2) may be regarded as the first evidence supporting the hypothesis that the multi-scalar approach used to calculate standardized indices such as the SPI and the SPEI can also be used to calculate a new standardized version of the Palmer's index.
Rejection rates (%) of four candidate models used to fit d series derived from the PDSI's algorithm. The term ‘rejection rate’ refers to the number of times the null hypothesis of the Anderson–Darling test has been rejected divided by 96 (12 months and eight locations – State of São Paulo, Brazil). This goodness-of-fit test has been carried out at 5% significance level (dotted line).
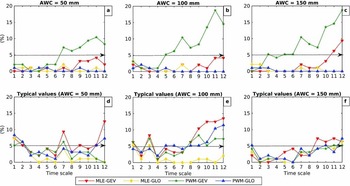
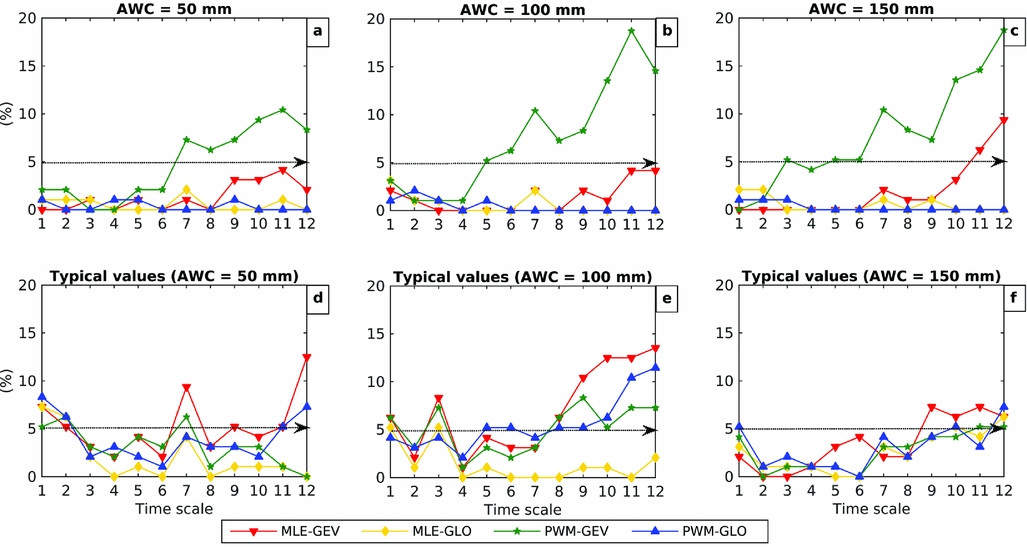
Regarding the ability to generate normally distributed data, the PWM-GEV presented the worse performance when the Shapiro–Wilk test was applied to the range of all possible SPDI values (Figure 3a–c). Within the range of typical values [−2.0:2.0] (Figure 3d–f), the MLE-GEV presented the highest rejection rates. Within the range of all possible values, the rejection rates presented by both PWM-GLO and MLE-GLO remained lower than the adopted significance level at all time scales and for all AWC values (Figure 3a–c). Considering that the Shapiro–Wilk test cannot discriminate the most suitable model among those presenting rejection rates lower than the adopted significance level (Vicente-Serrano and Beguería, Reference Vicente-Serrano and Beguería2016; Stagge et al., Reference Stagge, Tallaksen, Gudmundsson, Van Loon and Stahl2016; and Blain et al., Reference Blain, De Avila and Pereira2018), the results depicted in Figure 3 indicate that both PWM-GLO and MLE-GLO presented similar performance for calculating the SPDI in the State of São Paulo. This statement holds true for the range of all SPDI values. Within the range of typical values, the MLE-GLO outperformed the PWM-GLO (Figure 3d–f). This latter statement is particular true for AWC= 100 mm where the MLE-GLO model presented no rejection rate higher than 5%.
Rejection rates (%) of four candidate models used to calculate the new Standardized Palmer Drought Index (SPDI). The term ‘rejection rate’ refers to the number of times the null hypothesis of the Shapiro–Wilk test has been rejected divided by 96 (12 months and eight locations – State of São Paulo, Brazil). This test has been carried out at 5% significance level (dotted line) and it was applied to all range of possible values (a–c) and only to those SPDI values falling within the [−2.0:2,0] range (d–f).
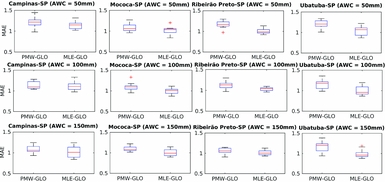
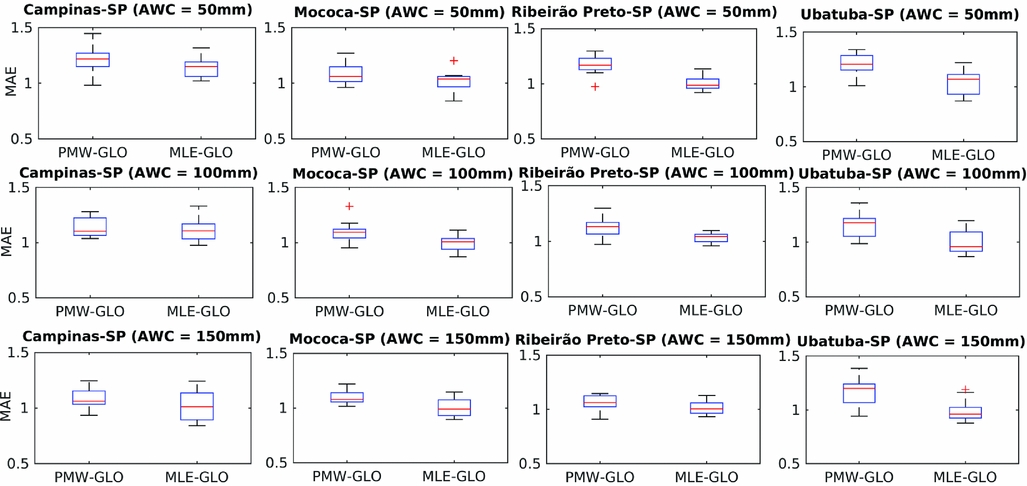
Considering the strategy of emphasizing the performance of the candidate model within the range of typical SDI values (Blain et al., Reference Blain, De Avila and Pereira2018; Stagee et al., Reference Stagge, Tallaksen, Gudmundsson, Van Loon and Stahl2016), the results of both AD (Figure 2) and Shapiro-Wilk (Figure 3) tests suggest the MLE-GLO as the most suitable model for calculating the SPDI in the State of São Paulo. On such background, the MAE estimated from calculated SPDI values and their corresponding theoretical values (Figure 4) also indicated that the MLE-GLO is the model that best approximates the values generated from the standard normal distribution. In other words, the results exemplified in Figure 4 agree with those of the Shapiro-Wilk test suggesting the MLE-GLO for calculating the SPDI under the tropical-subtropical conditions of the State of São Paulo (Blain et al., Reference Blain, De Avila and Pereira2018).
Box-plot of Mean Absolute Errors (MAE) between calculated Standardized Palmer Drought Index values and their corresponding theoretical values generated from the standard normal distribution. The Palmer's indices were calculated from Generalized Logistic distribution (GLO) with parameters estimated by the Probability Weighted Moments method (PWM-GLO) and by the Maximum Likelihood method (MLE-GLO).
In spite of the technical relevance of this latter recommendation, the most important result of the analyses depicted in Figures 2 to 4 is that they support the hypothesis that the d factor can be transformed into a multi-scalar drought index presenting the normalized nature expected from any SDI and also the capability of monitoring different types of Drought (Vicente-Serrano et al., Reference Vicente-Serrano, Van der Schrier, Beguería, Azorin-Molina and Lopez-Moreno2015). This allows us to compare the behaviour of the SPDI with those of both SPI and SPEI and to provide an easy-to-use R-code (https://www.r-project.org/) for calculating the SPDI at several time scales (1- to 12-month). The code (Supplementary Table S1, available online at https://doi.org/10.1017/S0014479718000340) was developed so that only based knowledge on R-programing is required. However, advanced users can easily adapt it to their needs.
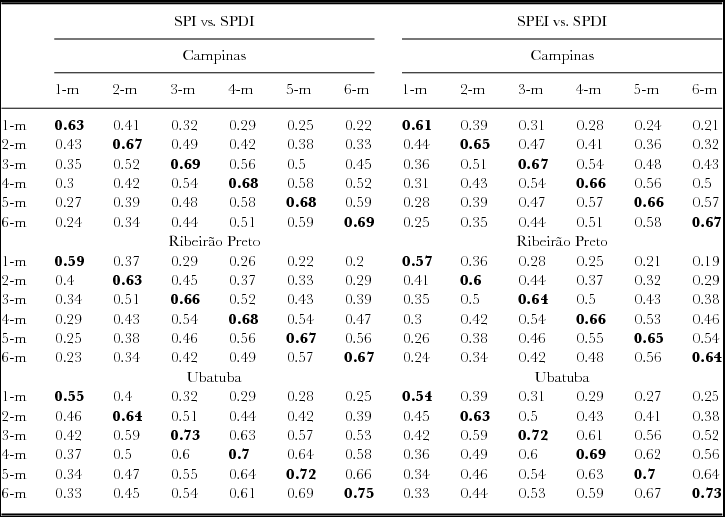
Before comparing the spatial variability of the SPDI with those of the other two SDI, it is worth mentioning that because of equation (4), both original PDSI and Sc-PDSI may be regarded as auto-regressive processes with long memories, which varies across different locations (Gutman, Reference Guttman1998; Vicente-Serrano et al., Reference Vicente-Serrano, Beguería, López-Moreno, Angulo and El Kenawy2010b and Wang et al., Reference Wang, Pan and Yaning Chen2017). For instance, Wang et al. (Reference Wang, Pan and Yaning Chen2017) assessed the level of correlation between the Sc-PDSI and SPEI (SPI) calculated at several time scales in distinct locations of northwestern China. In one location (Hex Corredor), the Sc-PDSI presented the largest level of correlation with SPEI (SPI) calculated at time scales varying from 3 (6) to 9-month (15-month). However, in another location (North Xinjiang) the largest levels of correlation between these indices were found for SPEI (SPI) calculated from 9 (12) to 24-month (30-month). Equivalent results were found by Guttman (Reference Guttman1998) and Vicente-Serrano et al. (Reference Vicente-Serrano, Beguería, López-Moreno, Angulo and El Kenawy2010b) when these authors compared the spatial variability of the PDSI (Sc-PDSI) with the SPI (SPI). Naturally, the long memory of these two former versions of the PDSI limits their abilities to identify rapidly emerging drought (Vicente-Serrano et al., Reference Vicente-Serrano, Beguería, López-Moreno, Angulo and El Kenawy2010b and WMO, Reference Svoboda, Hayes and Wood2012). On such background, the results of the correlation analyses carried out in this study (Table 1) indicated that the level of correlation between the new SPDI and the SPEI (SPI) do not vary across different location. In other words, the normalized nature of the SPDI makes it readily comparable to other SDI (Ma et al., Reference Ma, Ren, Singh, Tu, Jiang and Liu2015). As exemplified in Table 1 the highest level of correlation between the three SDI is always observed at the time scale in which both indices (SPDI vs. SPEI or SPDI vs. SPI) have been calculated. This latter statement holds true for the three AWC values.
Kendall's tau correlation coefficient between Standardized Palmer Drought Severity Index (SPDI) and two widely used Standardized Climatic Index (SPEI and SPI).

Time scales ranging from 1 (1-m) to 6 months (6-m).
Bold values indicate that the two drought indices have been calculated at the same time scale.
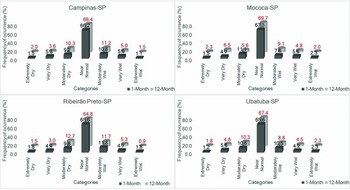
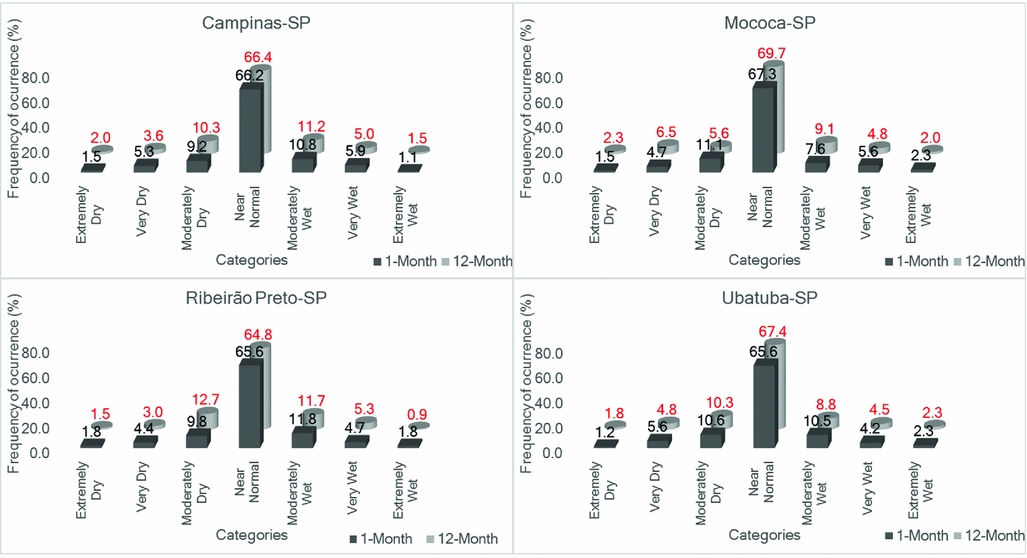
The results of the normality tests and Kendall's tau correlation analyses, along with those showing that the frequency of drought and flood events detected by the SPDI (1960–2016) are virtually equal across distinct locations (Figure 5), indicate that the new SPDI is as spatially comparable as any other Standardized Climatic Index, such as the SPI. The symmetrical behaviour between the frequencies of wet and dry categories (Figure 5) is also consistent with the assumption that the SPDI is capable of representing drought and flood events in a similar probabilistic way (Wu et al., Reference Wu, Svoboda, Hayes, Wilhite and Wen2007).
Frequency of wet and dry events for two distinct time scales in eight locations of the State of São Paulo. Standardized Palmer Drought Severity Index calculated for available water capacity level equal to 100 mm.
CONCLUSION
The new SPDI has shown to be capable of meeting the normally assumption under tropical-subtropical climatic conditions of Brazil. This statement holds true for three different AWC values (50, 100 and 150 mm) and for time scales ranging from 1 to 12 months. The GLO distribution with parameters estimated by means of the maximum likelihood method are recommended to calculate this new Standardized Drought Index. From an academic standpoint, the results of the normality tests (Figures 3 and 4) are in line with the strategy of basing the selection of an appropriate distribution on its performance within the range of typical wet/dry values [−2.0:2.0]. The results also supported the hypothesis that the Palmer Index can be transformed into a multi-scalar standardized drought index, encouraging future studies to address the use of this new index in others regions of the World.
SUPPLEMENTARY MATERIAL
To view supplementary material for this article, please visit https://doi.org/10.1017/S0014479718000340