


Introduction
As reported by the World Health Organization (WHO), between 2015 and 2050 the proportion of the world’s older adults is estimated to almost double from about 12% to 22%, with major implications for health, social and economic systems (World Health Organization, 2023). The protection of the physical and mental health status of this vulnerable segment of the population needs to be recognised as a public health priority.
Depression is one of the most common mental health conditions in older adults, along with anxiety (World Health Organization, 2023). In 2019, depressive disorders, including major depressive disorder (MDD) and dysthymia within the Global Burden of Disease framework, showed an age-standardised annual prevalence of approximately 5.7% (95% UI 4.94%–6.54%) and accounted for about 9.21 million disability-adjusted life years among older adults worldwide (Li et al., Reference Li, Zhou, Wang, Cheng, Xu, Cao, Gao and Zhu2025). Diagnosing depression in older adults is more difficult than in young people because of physical comorbidities and cognitive dysfunction (Bergua et al., Reference Bergua, Blanchard and Amieva2026). Lastly, the development of depression in older age, often due to bereavement or loss of physical health and independence, is a well-recognised risk factor for suicide (De Leo, Reference De Leo2022).
In recent years, the increasing availability of large-scale administrative healthcare registries has provided new opportunities to investigate the epidemiology of mental disorders in real-world settings (Pasman et al., Reference Pasman, Meijsen, Haram, Kowalec, Harder, Xiong, Nguyen, Jangmo, Shorter, Bergstedt, Das, Zetterberg, Tate, Lichtenstein, Larsson, Odsbu, Werge, Reichborn-kjennerud, Andreassen, Sullivan, Buil, Tesli and Lu2023). Administrative data allow population-level coverage, long-term follow-up and linkage across multiple healthcare services, overcoming some of the limitations of survey-based studies, such as recall bias and limited sample size. In the field of late-life depression, administrative data can be used to estimate epidemiological measures based on clinically recorded diagnoses and healthcare utilisation. However, longitudinal evidence on epidemiology of MDD derived from comprehensive regional administrative registries remains limited in Southern European settings.
Based on the data warehouse (DWH) of Lombardy Region, the most populous region in Italy (about 10 million residents), we aimed to investigate the burden of MDD among older adults aged 65+ between 2013 and 2023, overall, by sex and age groups, using individually inter-linked regional administrative healthcare data. We hypothesised that the integration of multiple administrative healthcare registries would provide a comprehensive assessment of healthcare-recorded, algorithm-defined MDD and its temporal trends, while allowing the investigation of differences according to sex and age group.
Methods
Study design and data sources
We conducted a retrospective population-based cohort study using the administrative healthcare registries of the Lombardy Region. These data are stored and managed within the Lombardy DWH, which collects anonymised individual-level information on healthcare utilisation for the entire regional population (Parabiaghi et al., Reference Parabiaghi, Franchi, Tettamanti, Barbato, D’avanzo, Fortino, Bortolotti, Merlino and Nobili2011; Blandi et al., Reference Blandi, Bertuccio, Clemens, Brand and Odone2025a, Reference Blandi, Bertuccio, Signorelli, Brand, Clemens, Renzi and Odone2025b).
The DWH is based on a star schema architecture, allowing the linkage of multiple health-related information registries at the individual level via a unique anonymous identification code. The Population Registry represents the central component within this architecture and provides sociodemographic information (i.e., sex and year of birth), vital status (week of death) and residency data for all residents registered in the Regional Health Service. Multiple healthcare utilisation registries, including hospital discharges, drug prescriptions, outpatient care records and administrative exemptions, as well as mental health services, are linked to the Population Registry, allowing complete longitudinal follow-up and individual-level record linkage over time.
This data infrastructure has been extensively validated and used in prior epidemiological studies (Blandi et al., Reference Blandi, Bertuccio, Clemens, Brand and Odone2025a, Reference Blandi, Bertuccio, Signorelli, Brand, Clemens, Renzi and Odone2025b). Data access was established under a research agreement with the Lombardy Region’s Welfare Directorate, led by the University of Pavia and approved by the regional public health authority, in compliance with the General Data Protection Regulation.
Study cohort
We constructed an open dynamic cohort of all individuals born in 1958 or before, residing in Lombardy and actively registered in the Regional Health Service between 2001 and 2023. Birth year 1958 corresponds to the youngest cohort reaching 65 years of age in 2023, i.e., the last year of observation. Participants entered the cohort on 1 January of the first calendar year in which they reached the age of 65, or on 1 January 2001, if they were already aged 65 years or older at the start of the study period. They were followed until the earliest occurrence of one of the following: event of interest (MDD), death, emigration, or end of follow-up (31 December 2023).
MDD incident case definition
To identify incident cases of MDD over the study period, as defined by the Diagnostic and Statistical Manual of Mental Disorders, Fifth Edition (DSM-5) (American Psychiatric Association, 2013), we applied an a priori algorithm based on four administrative healthcare registries available within the Lombardy Regional DWH (Supplementary Figure S1):
i) Hospital discharges;
ii) Administrative exemptions (administrative certificates for selected medical conditions that exempt from payment for health services);
iii) Long-term care facilities admissions;
iv) Community psychiatric services.
All four registries contain diagnostic information (Supplementary Table S1). Over the period 2001–2023, for each individual we extracted: (i) from the Hospital Discharge Registry, the earliest hospitalisation in which MDD was recorded among any of the discharge diagnoses (primary or secondary), using ICD-9-CM codes 296.2 or 296.3; (ii) from the Administrative Exemptions registry, the earliest exemption certificate recorded for MDD, identified by codes 044.296.2 (MDD, single episode) and 044.296.3 (MDD, recurrent episode); (iii) from the Long-Term Care Facilities Admissions registry, the earliest recorded diagnosis of MDD, using ICD-9-CM codes 296.2 or 296.3; and (iv) from the Community Psychiatric services registry, the earliest recorded diagnosis of MDD, using ICD-10 codes F32 and F33.
The four registries were merged with the Population Registry through multi-source individual-level record linkage using a unique pseudonymised individual identifier, in order to obtain an integrated analytical database. Individuals were classified as incident MDD cases if they had at least one recorded diagnosis of MDD in any of the four selected registries, with the date of MDD onset defined as the earliest recorded MDD diagnosis across all linked databases. The distribution of MDD incident cases across the four administrative registries was represented using a Venn diagram, a graphical tool that displays the overlapping and non-overlapping proportions of cases identified by each data source.
Antidepressant dispensing and primary-care or private-specialist records were deliberately not used to define cases: in older adults, antidepressants are frequently prescribed for non-depressive indications (e.g., neuropathic pain, insomnia, anxiety and behavioural symptoms of dementia, anxiety disorders, obsessive-compulsive and related disorders, and stressor-related disorders), so a dispensing-based definition would have low specificity for MDD; while primary-care diagnoses are not comprehensively captured by the regional administrative flows (Liang et al., Reference Liang, Lapane, Ott, Tjia, Baek, Yuan and Alcusky2026). We therefore adopted an a priori diagnosis-based algorithm, accepting that the resulting estimates represent a lower bound of true occurrence.
Statistical analyses
For each calendar year, MDD incidence rates were calculated as the number of all new cases occurring during the year divided by the corresponding person-time at risk, expressed in person-years. Person-years were calculated by summing the time contributed by all residents who were alive and free from MDD during each calendar year until the occurrence of MDD, death or the end of the calendar year. Incidence rates were expressed per 100,000 person-years, and 95% confidence intervals (CIs) were calculated assuming a Poisson distribution of events and using the normal approximation. For comparative purposes, we then computed the annual age-standardised incidence rates per 100,000 person-years at age 65+, using the direct method based on the WHO World Standard Population, truncated from age group 65–69 to 85+ years old (World Health Organization, 2001).
To minimise misclassification of individuals with a previous history of MDD as incident cases, incidence estimation started in 2013, when all four registries contributing to the algorithm-based MDD case definition were available. All available historical information from the regional administrative healthcare registries was used to identify and exclude individuals with any recorded MDD diagnosis before the start of incidence estimation (Supplementary Figure S2). Overall, 29,156 individuals met this exclusion criterion. Episodes occurring before the available observation period could not be identified and may therefore have resulted in residual left-censoring (Plana-Ripoll et al., Reference Plana-Ripoll, Momen, Gallego-alabanda, Chen, Hansen, Melis, Pedersen and Agerbo2025).
For each calendar year between 2013 and 2023, prevalent MDD cases were defined as all residents aged 65 years or older who were alive on 31 December of each year and who had a diagnosis of MDD, using the same a priori algorithm described above, at any time since 2001 up to the calendar year. Annual point prevalence was computed by dividing the number of prevalent cases in each calendar year by the sum of all residents alive at the end of the year. To minimise survivor bias, individuals who died during the year were excluded from the denominator if death occurred before 31 December. Age-standardised annual prevalence was computed using the same reference population as for incidence rates.
MDD incidence and prevalence estimates were stratified by sex (males and females) and age (age groups: 65–69, 70–74, 75–79, 80–84 and 85+).
To quantify temporal changes, annual percent changes (APCs) in MDD incidence and prevalence were estimated through Poisson regression models with a log link and the logarithm of the population at risk as an offset. Calendar year was modelled as a continuous variable. Overall models were adjusted for sex and age group (65–69, 70–74, 75–79, 80–84 and ≥85 years), while sex- and age-specific models were mutually adjusted. APCs were calculated as (exp(β)-1)∙100 and are presented with corresponding 95% CIs. To account for overdispersion, standard errors were corrected using the Pearson scale parameter. Heterogeneity in temporal trends by sex and age group was evaluated by introducing year × sex and year × age interaction terms in separate Poisson regression models.
Results were presented both in tabular form and as line plots to highlight temporal trends (12).
All statistical analyses were performed using SAS version 9.4 (SAS Institute Inc., USA).
Results
Incidence
Applying our case definition algorithm for MDD, we observed a total of 19,851 new MDD cases among individuals aged 65 years or older residing in the Lombardy region between 2013 and 2023. The percentage of MDD cases identified from the four selected registries, showing the proportion of cases identified exclusively within each registry and those identified across multiple registries (overlap), is reported in Supplementary Figure S3. The Community Psychiatric Services registry represented the largest single source, contributing 38.6% of MDD cases identified exclusively through this registry, followed by the Hospital Discharge Registry (32.9%) and Administrative Exemptions registry (4.7%). Long-Term Care Facilities contributed no cases as a sole source. Overlap between registries was minimal. A total of 21.8% of cases were identified through both Long-Term Care Facilities and Community Psychiatric Services registries, while 1.6% were captured by both Administrative Exemptions and the Hospital Discharge Registries. All remaining combinations of two or more registries each accounted for less than 0.2% of cases.
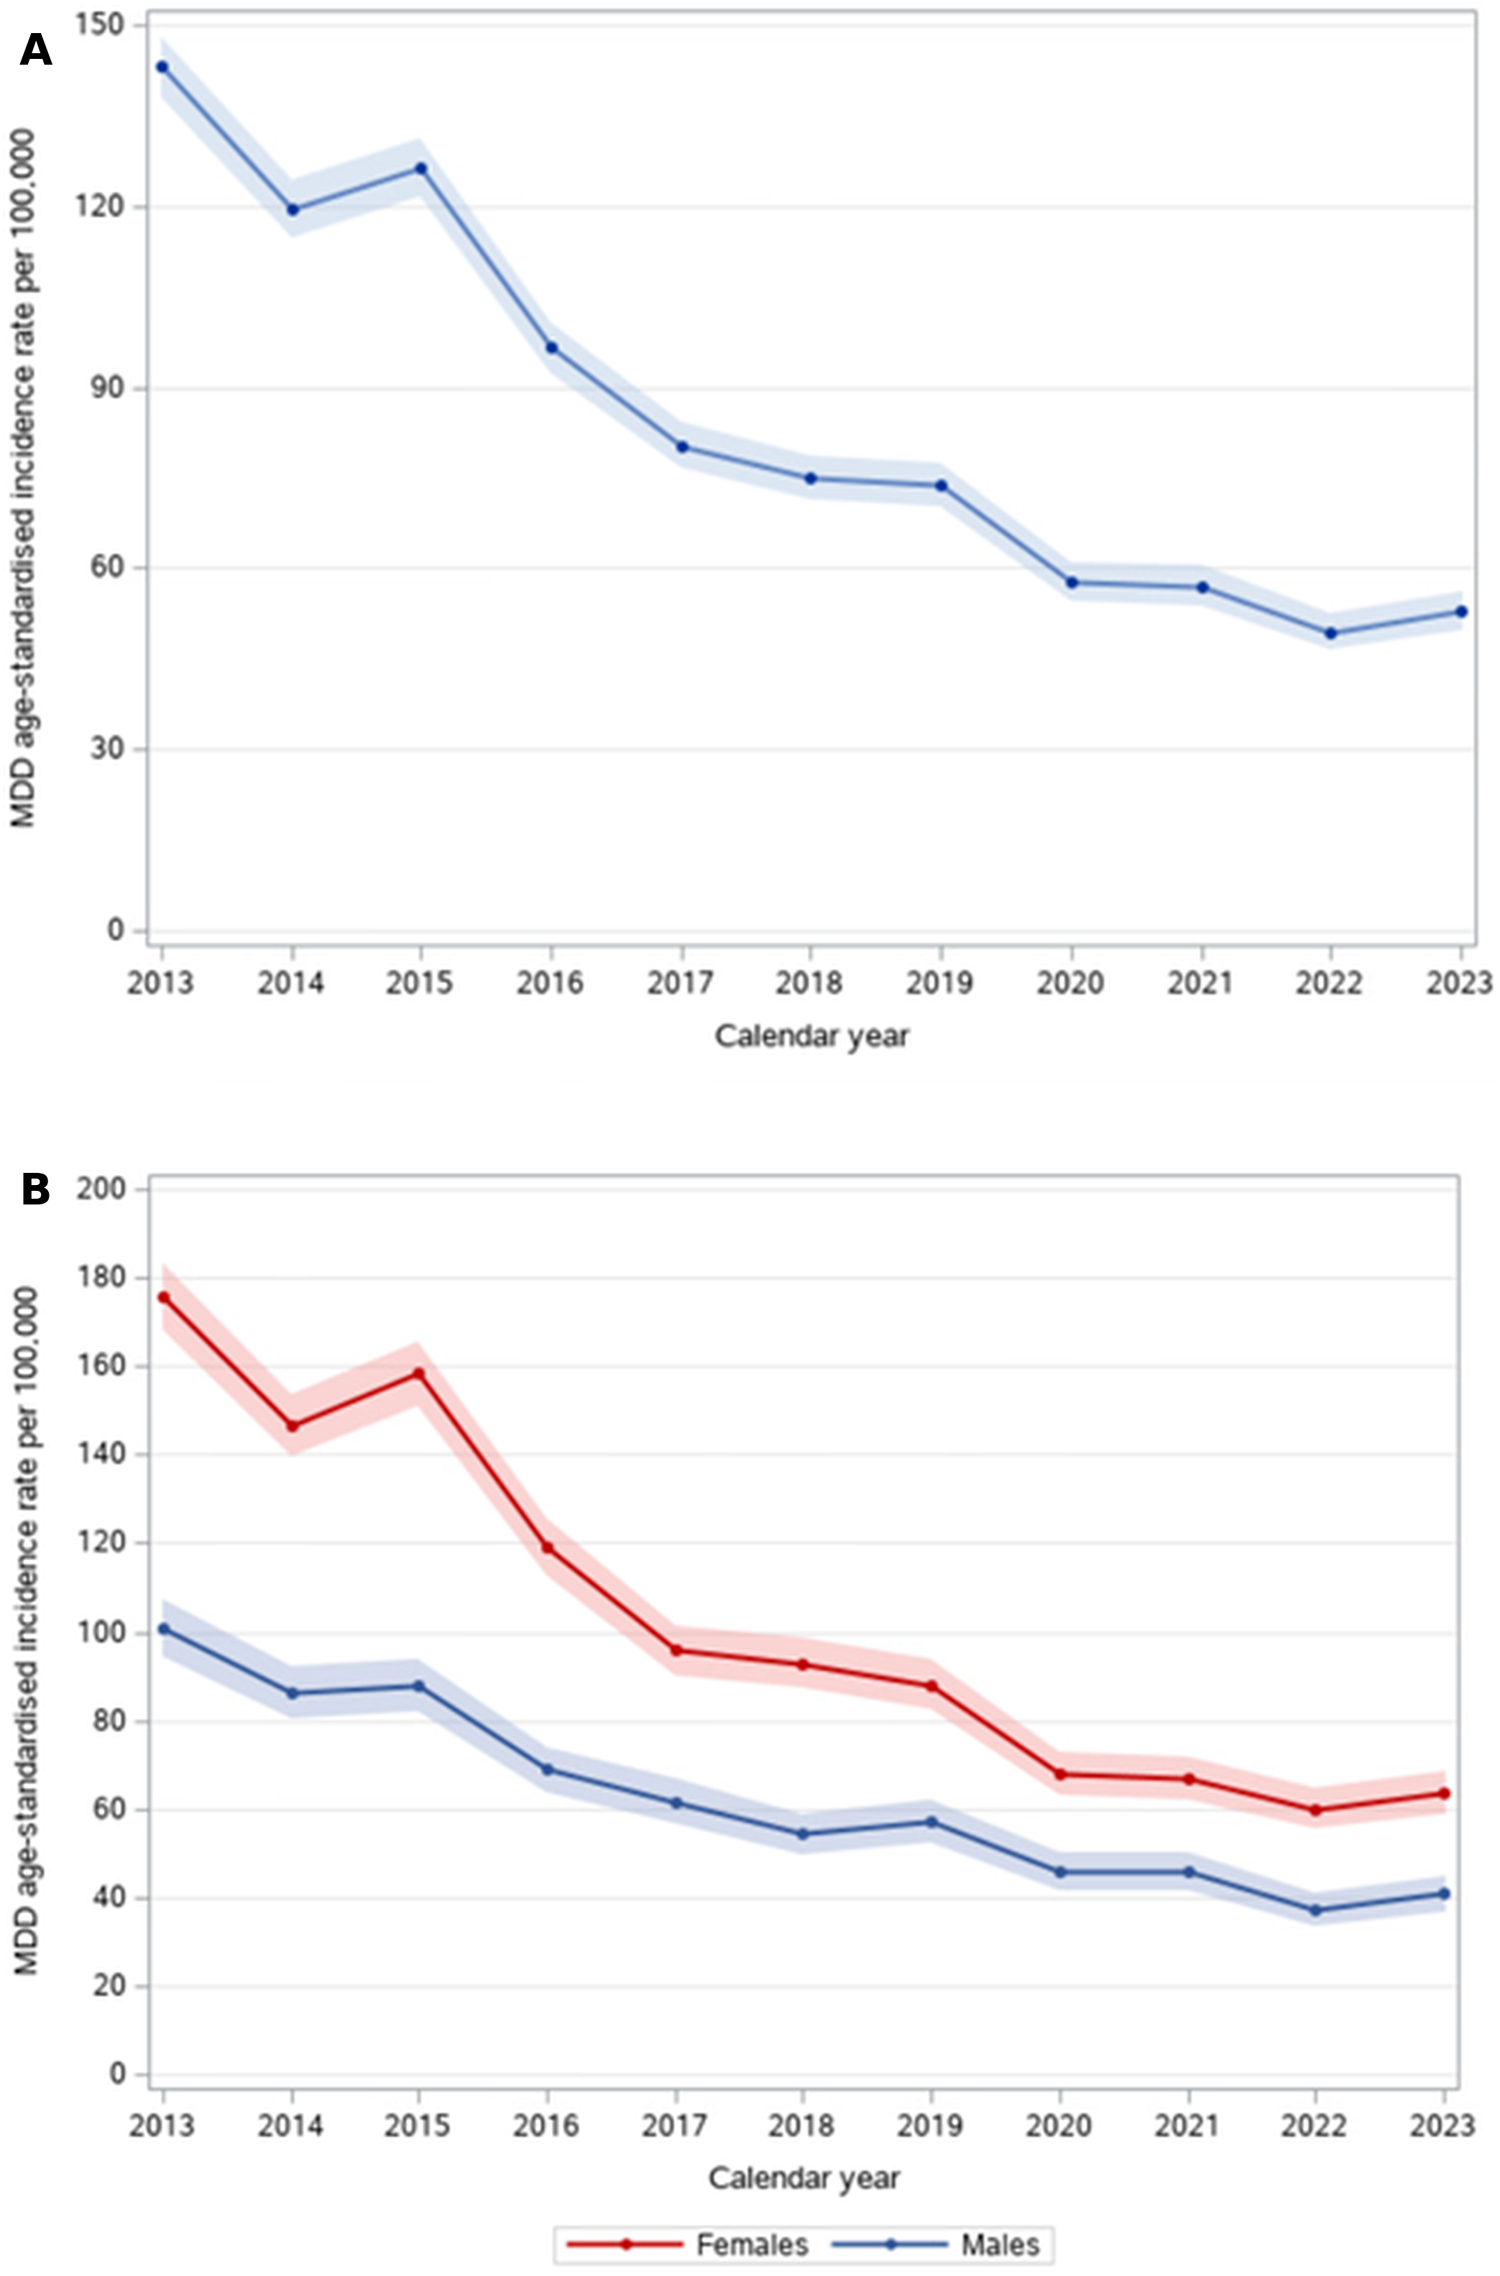
Table 1 reports the annual number of new MDD cases, person-years at risk, crude and age-standardised MDD incidence rates per 100,000 person-years over the study period. Annual age-standardised MDD incidence trends are illustrated in Figure 1A. Age-standardised MDD incidence declined markedly over the study period, from 126.5/100,000 person-years (95% CI: 121.7–131.3) in 2013 (n = 2,900 MDD incident cases) to 50.6/100,000 person-years (95% CI: 47.6–53.7) in 2023 (n = 1,173), corresponding to an overall percentage reduction of 60%. Crude incidence rates showed a comparable pattern.
Annual major depressive disorder (MDD) incidence trends (age-standardised – world standard population – rates per 100,000 person-years) in adults aged ≥ 65 years, overall (A) and by sex (B), from 2013 to 2023. Lombardy region, Italy.
Major depressive disorder (MDD) new cases, person-years, crude and age-standardised (WHO world standard population) incidence rates per 100,000 person-years at age 65+ and corresponding 95% confidence intervals (CIs) from 2013 to 2023, Lombardy region, Italy

Table 1 Long description
Annual counts for age 65 plus list new MDD cases, person-years, crude incidence rate per 100,000 person-years with 95% confidence interval, and age-standardised incidence rate per 100,000 with 95% confidence interval, for 2013 to 2023 in Lombardy. New cases decline from 2,900 in 2013 to 1,070 in 2022, then increase to 1,173 in 2023, while person-years rise from 2,180,117 in 2013 to 2,445,994 in 2023. Crude incidence rates with 95% confidence intervals are 133.0, 128.2 to 137.9 in 2013; 111.4, 107.0 to 115.8 in 2014; 114.3, 109.9 to 118.7 in 2015; 89.7, 85.8 to 93.6 in 2016; 77.1, 73.5 to 80.7 in 2017; 71.7, 68.3 to 75.2 in 2018; 68.9, 65.6 to 72.2 in 2019; 53.4, 50.5 to 56.4 in 2020; 51.4, 48.5 to 54.3 in 2021; 44.2, 41.6 to 46.9 in 2022; and 48.0, 45.2 to 50.7 in 2023. Age-standardised incidence rates with 95% confidence intervals are 126.5, 121.7 to 131.3 in 2013; 107.6, 103.2 to 112.1 in 2014; 110.7, 106.2 to 115.1 in 2015; 86.1, 82.2 to 90.1 in 2016; 74.7, 71.1 to 78.1 in 2017; 69.9, 66.3 to 73.4 in 2018; 68.9, 65.3 to 72.4 in 2019; 54.0, 50.8 to 57.2 in 2020; 53.9, 50.8 to 57.1 in 2021; 47.3, 44.3 to 50.3 in 2022; and 50.6, 47.6 to 53.7 in 2023. In each year, crude and age-standardised rates are close in value, with the largest separation in 2013 and smaller differences from 2019 onward.
Sex-specific annual age-standardised MDD incidence rates are reported in Figure 1B, and corresponding data reported in Supplementary Table S3. Among females, a total of 13,435 MDD incident cases were observed over the study period. Age-standardised MDD incidence rates decreased by 60.8%, from 154.4/100,000 (95% CI: 147.2–161.6) in 2013 (n = 2,039 MDD incident cases) to 60.6/100,000 (95% CI: 56.0–65.3) in 2023 (n = 753). Among males, a total of 6,416 MDD incident cases were observed over the period 2013–2023. Over the same period, the reduction was 56.3%, from 90.4/100,000 (95% CI: 84.2–96.5) in 2013, to 39.5/100,000 (95% CI: 35.6–43.4) in 2023. Females showed consistently higher incidence rates compared to males, although the sex difference narrowed over time.
Age-specific MDD incidence rates aggregated over three calendar periods (2013–2015, 2016–2019 and 2020–2023) are reported in Figure 2, with corresponding data reported in Supplementary Table S4. Across all age groups, incidence rates declined progressively over time. Between 2013–2015 and 2016–2019, percentage reductions ranged from −27.7% in the 65–69 age group to −43.9% among individuals aged 85 years or older. Further decreases were observed in 2020–2023 compared to 2016–2019, with the largest relative reductions among individuals aged 85 years or older (−53.5%) and 80–84 years (−47.9%).
Major depressive disorder (MDD) incidence trends by age group, in 2013–2015, 2016–2019 and 2020–2023. Lombardy region, Italy.

Detailed annual MDD incidence trends by age group are reported in Supplementary Table S5 and Figure S4. In 2013, MDD incidence rates increased with age up to the 80–84 age group (100.6/100,000 in the 65–69 age group and 162.4/100,000 in the 80–84 age group), while the rate was slightly lower in the over-85 age group (156.5/100,000 people). Over the study period, all age groups showed substantial declines, with incidence rates in 2023 ranging from 27.1/100,000 among individuals aged 85+ to 58.1/100,000 in those aged 70–74. Differences between age groups progressively narrowed, and by the end of the study period, incidence rates had largely converged across age categories.
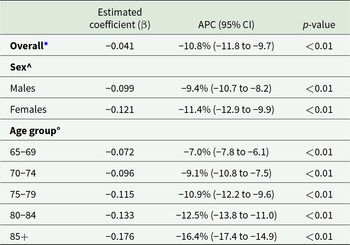
Table 2 gives the estimated APC and 95% CI obtained through Poisson regression models. The overall age-standardised MDD incidence significantly declined by 10.8% per year (95% CI: −11.8 to −9.7). Sex-specific models showed significant annual declines in both males (APC: −9.4%, 95% CI: −10.7 to −8.2) and females (APC: −11.4%, 95% CI: −12.9 to −9.9). Age-specific analyses showed significant declines across all age groups, with the largest annual reduction among individuals aged ≥85 years (APC: −16.4%, 95% CI: −17.4 to −14.9). There was no evidence that temporal trends differed by sex (year × sex interaction term, p-value = 0.063), whereas trends varied significantly across age groups (year × age group interaction term, p-value < 0.001), with the steepest declines observed in the oldest age groups.
Annual percent change (APC) and corresponding 95% confidence intervals (CI) in major depressive disorder (MDD) incidence rates over the decade 2013–2023 among adults aged ≥65 years, overall and by sex and age group. Lombardy region, Italy

Table 2 Long description
Annual percent change values for MDD incidence rates from 2013 to 2023 are listed with an estimated coefficient beta, a 95 percent confidence interval, and a p value. Overall, the estimated coefficient beta is minus 0.041, with annual percent change minus 10.8 percent and 95 percent confidence interval from minus 11.8 to minus 9.7, p value less than 0.01. By sex, males have beta minus 0.099 and annual percent change minus 9.4 percent with confidence interval minus 10.7 to minus 8.2, and females have beta minus 0.121 and annual percent change minus 11.4 percent with confidence interval minus 12.9 to minus 9.9; both have p value less than 0.01. By age group, 65 to 69 has beta minus 0.072 and annual percent change minus 7.0 percent with confidence interval minus 7.8 to minus 6.1; 70 to 74 has beta minus 0.096 and annual percent change minus 9.1 percent with confidence interval minus 10.8 to minus 7.5; 75 to 79 has beta minus 0.115 and annual percent change minus 10.9 percent with confidence interval minus 12.2 to minus 9.6; 80 to 84 has beta minus 0.133 and annual percent change minus 12.5 percent with confidence interval minus 13.8 to minus 11.0; and 85 plus has beta minus 0.176 and annual percent change minus 16.4 percent with confidence interval minus 17.4 to minus 14.9; each p value is less than 0.01.
* For overall estimates, a Poisson regression model adjusted by sex and age was fitted.
^ For sex estimates, a Poisson regression model adjusted by sex and age was fitted for each stratum of sex.
° For age group estimates, a Poisson regression model adjusted by sex and age was fitted for each stratum of age group.
Prevalence
Table 3 presents the annual number of prevalent MDD cases, crude and age-standardised annual prevalence (%) and corresponding 95% CI at age 65 years or older in Lombardy region from 2013 to 2023, with trends illustrated in Figure 3A. Over the study period, age-standardised MDD prevalence declined steadily, decreasing from 0.94% (95% CI: 0.93–0.95) in 2013, with 23,217 MDD prevalent cases, to 0.63% (95% CI: 0.62–0.64) in 2023, with 20,367 MDD prevalent cases. The overall reduction was 33.0%.
Annual number of major depressive disorder (MDD) prevalent cases, crude and age-standardised prevalence (%) at age ≥65 and corresponding 95% confidence intervals (CIs), from 2013 to 2023. Lombardy region, Italy

Table 3 Long description
Annual values are listed for number of prevalent MDD cases, crude prevalence percent with 95 percent confidence interval, and age standardised prevalence percent with 95 percent confidence interval. In 2013 there were 23,217 cases, crude prevalence 1.07 with confidence interval 1.06 to 1.09, and age standardised prevalence 0.94 with confidence interval 0.93 to 0.95. Cases rose to 24,418 in 2014, 25,563 in 2015, 26,056 in 2016, and 26,065 in 2017, then declined to 25,680 in 2018, 25,340 in 2019, 23,353 in 2020, 22,557 in 2021, 21,290 in 2022, and 20,367 in 2023. Crude prevalence increased from 1.07 in 2013 to 1.11 in 2014, 1.14 in 2015, and 1.15 in 2016, then decreased to 1.14 in 2017, 1.11 in 2018, 1.08 in 2019, 1.00 in 2020, 0.96 in 2021, 0.89 in 2022, and 0.84 in 2023. Age standardised prevalence was 0.94 in 2013, 0.95 in 2014, 0.98 in 2015, 0.96 in 2016, 0.92 in 2017, 0.88 in 2018, 0.84 in 2019, 0.78 in 2020, 0.73 in 2021, 0.68 in 2022, and 0.63 in 2023. Each year includes a 95 percent confidence interval for both prevalence measures, with crude prevalence intervals ranging from 0.83 to 1.16 across the years and age standardised prevalence intervals ranging from 0.62 to 0.99 across the years.
Sex-specific crude and age-standardised prevalence trends are reported in Figure 3B. Corresponding figures are given in Supplementary Table S6. Over the study period, prevalence rates were consistently higher among females than males. Among females, age-standardised prevalence declined by 33.6%, from 1.19% (95% CI: 1.17–1.21) in 2013 (n = 17,300 MDD prevalent cases) to 0.79% (95% CI: 0.78–0.81) in 2023 (n = 15,023). Among males, age-standardised prevalence decreased by 31.7%, from 0.60% (95% CI: 0.58–0.61) in 2013 (n = 5,917) to 0.41% (95% CI: 0.40–0.43) in 2023 (n = 5,344). The female-to-male prevalence ratio remained approximately twofold throughout the period (1.98 in 2013 and 1.93 in 2023), narrowing only marginally; a marked narrowing was observed for incidence (from about 1.71 in 2013 to 1.53 in 2023).
Annual prevalence trends of major depressive disorder (MDD) at age ≥65 years, overall (panel A) and by sex (panel B), from 2013 to 2023. Lombardy region, Italy.

Age-specific MDD prevalence rates aggregated over three calendar periods are reported in Figure 4, with corresponding figures reported in Supplementary Table S7. From 2013 to 2015, prevalence of MDD increased with age, from 0.32% in the 65–69 age group to 1.79% in the 80–84 age group. Prevalence declined across age groups in subsequent periods, with some exceptions. The percentage change between 2013–2015 and 2016–2019 showed a decrease in MDD prevalence up to the 75–79 age group, while there were increases in the 80–84 (+6.1%) and 85+ (+17.2%) age groups. Comparing 2020–2023 with 2016–2019, substantial decreases were observed across all age groups; however, prevalence remained comparatively stable among individuals aged 85 years or older. Detailed annual prevalence trends by age group are shown in Supplementary Table S8 and Figure S5.
Major depressive disorder (MDD) prevalence trends by age group, in 2013–2015, 2016–2019 and 2020–2023. Lombardy region, Italy.

Estimated APC and corresponding 95% CI for temporal trends in recorded MDD prevalence are reported in Table 4. The overall MDD prevalence declined by 3.0% per year (95% CI: −4.7 to −1.3), as well as among males (APC: −3.6%, 95% CI: −5.9 to −1.3) and females (APC: −2.8%, 95% CI: −5.2 to −0.4). Age-specific APCs became progressively less marked with increasing age, ranging from −8.2% among individuals aged 65–69 years to a slight increase of 1.2% among those aged ≥85 years. There was no evidence that temporal trends differed by sex (year × sex interaction, p-value = 0.708), whereas trends varied significantly across age groups (year × age group interaction, p-value = 0.005).
Annual percent change (APC) and corresponding 95% confidence intervals (CI) in major depressive disorder (MDD) prevalence rates over the decade 2013–2023 among adults aged ≥65 years, overall and by sex and age group. Lombardy region, Italy

Table 4 Long description
Columns report estimated coefficient beta, annual percent change with 95 percent confidence interval, and p value for major depressive disorder prevalence rates from 2013 to 2023 in adults aged 65 years and older. Overall, estimated coefficient beta is minus 0.031, annual percent change is minus 3.0 percent with confidence interval minus 4.7 to minus 1.3, p value less than 0.01. By sex, males have beta minus 0.037 and annual percent change minus 3.6 percent with confidence interval minus 5.9 to minus 1.3, p value less than 0.01; females have beta minus 0.029 and annual percent change minus 2.8 percent with confidence interval minus 5.2 to minus 0.4, p value less than 0.02. By age group, 70 to 74 has beta minus 0.071 and annual percent change minus 6.8 percent with confidence interval minus 7.5 to minus 6.2, p value less than 0.01; 75 to 79 has beta minus 0.044 and annual percent change minus 4.3 percent with confidence interval minus 5.1 to minus 3.4, p value less than 0.01. Ages 80 to 84 show beta minus 0.023 and annual percent change minus 2.3 percent with confidence interval minus 3.4 to minus 1.1, p value less than 0.01. Ages 85 plus show beta minus 0.012 and annual percent change plus 1.2 percent with confidence interval plus 0.2 to plus 2.3, p value less than 0.02.
* For overall estimates, a Poisson regression model adjusted by sex and age was fitted.
^ For sex estimates, a Poisson regression model adjusted by sex and age was fitted for each stratum of sex.
° For age group estimates, a Poisson regression model adjusted by sex and age was fitted for each stratum of age group.
Discussion
To the best of our knowledge, this is the first region-wide population-based longitudinal study to investigate temporal trends in diagnosis-based and algorithm-defined MDD among older adults, using a multi-source linkage of administrative healthcare registries in Italy. We observed a substantial decline in both recorded MDD incidence and annual point prevalence among older adults over the period 2013–2023. Age-standardised MDD incidence rates decreased from 126.5 to 50.6 per 100,000 person-years (APC: −10.8%) and prevalence from 0.94% to 0.63% (APC: −3.0%). Rates were consistently higher in females than in males. Temporal trends in MDD burden showed no significant differences between sexes, consistent with well-established sex disparities in depression (Pasman et al., Reference Pasman, Meijsen, Haram, Kowalec, Harder, Xiong, Nguyen, Jangmo, Shorter, Bergstedt, Das, Zetterberg, Tate, Lichtenstein, Larsson, Odsbu, Werge, Reichborn-kjennerud, Andreassen, Sullivan, Buil, Tesli and Lu2023); however, they varied across age groups, with the most marked declines observed among individuals aged 80 years and older.
These findings align with survey-based evidence from Italy and other European countries. Data from the Italian national surveillance system on the health status of older adults, named Progressi delle Aziende Sanitarie per la Salute in Italia (PASSI d’Argento), indicate that approximately 9% of Italian adults aged 65 + report depressive symptoms with functional limitations, with a downward trend from 2016 to 2024 across all age groups, possibly accelerated by COVID-19-related excess mortality among the most vulnerable older adults (Carpiniello et al., Reference Carpiniello, Tusconi, Di Sciascio, Zanalda and Di Giannantonio2020, Istituto Superiore di Sanità, 2026). At the European level, analyses of the SHARE study reported a prevalence of clinically relevant depressive symptoms of 28.3% in 2022, with a 5.9% decline between 2004 and 2022 (Nunez-Cortes et al., Reference Nunez-Cortes, Calatayud, Andersen, Villafane, Suso-marti and Lopez-bueno2026), while the EURODEP meta-analysis estimated an average depression prevalence of 12.3% in community-dwelling older Europeans (Copeland et al., Reference Copeland, Beekman, Braam, Dewey, Delespaul, Fuhrer, Hooijer, Lawlor, Kivela, Lobo, Magnusson, Mann, Meller, Prince, Reischies, Roelands, Skoog, Turrina, Devries and Wilson2004). However, direct comparisons between survey-based and administrative-data estimates require caution, as they can differ in both case ascertainment methods and outcome definitions, with surveys typically assessing depressive symptoms rather than MDD.
Among healthcare registry-based studies, a previous Scandinavian study (Pasman et al., Reference Pasman, Meijsen, Haram, Kowalec, Harder, Xiong, Nguyen, Jangmo, Shorter, Bergstedt, Das, Zetterberg, Tate, Lichtenstein, Larsson, Odsbu, Werge, Reichborn-kjennerud, Andreassen, Sullivan, Buil, Tesli and Lu2023) provided a comprehensive MDD epidemiological overview using nationwide registers (>272,000 cases), demonstrating that cross-country differences in MDD prevalence were substantially influenced by healthcare organisation and recording practices. Recent Danish register-based studies further provided comprehensive incidence estimates across mental disorders, although relying primarily on specialist care diagnoses and not incorporating multi-source case ascertainment (Beck et al., Reference Beck, Pedersen, Plana-Ripoll, Dalsgaard, Debost, Laursen, Musliner, Mortensen, Pedersen, Petersen, Yilmaz, Mcgrath and Agerbo2024; Momen et al., Reference Momen, Beck, Lousdal, Agerbo, Mcgrath, Pedersen, Nordentoft and Plana-Ripoll2025). In contrast, our study adopts a multi-registry linkage framework specifically tailored to capture MDD among older adults, integrating hospital, community psychiatric services, administrative exemptions and long-term care data. Earlier population-based evidence from the United States showed increasing rates of diagnosed depression alongside expanded antidepressant use, but also highlighted substantial gaps in treatment and persistent socioeconomic disparities in access to care (Crystal et al., Reference Crystal, Sambamoorthi, Walkup and Akincigil2003). Therefore, previous evidence indicates that trends derived from administrative data are shaped by healthcare system characteristics and patterns of service utilisation (Lu et al., Reference Lu, Liu, Wong, Leung, Sze, Kwok, Knapp, Lou, Tse, Ng, Wong, Tang and Lum2021); accordingly, the decline observed in our study likely reflects changes over time in healthcare utilisation, diagnostic practices and recording systems (i.e., under-diagnosis and under-recording), particularly in older adults. Understanding how and what administrative healthcare data represent is essential for correctly interpreting temporal trends in MDD. First, hospitalisations in this age group are predominantly driven by organic conditions, and depressive symptoms are frequently overlooked or attributed to the underlying medical illness, resulting in under-recording in hospital discharge records (Devita et al., Reference Devita, De Salvo, Ravelli, De Rui, Coin, Sergi and Mapelli2022). Second, older adults tend to rely on their general practitioner or private specialists rather than community psychiatric services, whose registry is one of the data sources in our algorithm and represents the only component systematically captured within administrative data flows, as services provided by general practitioners and private specialists are not comprehensively recorded; episodes managed outside the public specialist care system therefore escape capture. Third, depression frequently accompanies dementia syndromes – with depressive symptoms estimated in 37%–41% of individuals with dementia (Asmer et al., Reference Asmer, Kirkham, Newton, Ismail, Elbayoumi, Leung and Seitz2018) – and may be attributed to the neurodegenerative process rather than recognised as a distinct comorbidity (Elser et al., Reference Elser, Horvath-puho, Gradus, Smith, Lash, Glymour, Sorensen and Henderson2023). Fourth, late-life depression often presents with somatic symptoms (as ‘masked depression’) such as fatigue, chronic pain, sleep disturbances and cognitive impairment, with over 50% of cases potentially undiagnosed (Devita et al., Reference Devita, De Salvo, Ravelli, De Rui, Coin, Sergi and Mapelli2022).
Additional factors may contribute to the declining MDD trends over the study period. The progressive growth of the elderly population in Lombardy (person-years at risk: 2,180,117 in 2013 to 2,445,945 in 2023) enlarges the denominator and may attenuate incidence rates even in the absence of proportional increases in new cases. Age-standardised rates partially account for this effect, but cannot fully adjust for all underlying population dynamics. Furthermore, selective survival may also play a role. Individuals reaching advanced old age represent an increasingly selected and biologically resilient subgroup of the original birth cohort, potentially characterised by lower susceptibility to depression (Banack et al., Reference Banack, Kaufman, Wactawski-wende, Troen and Stovitz2019). Consistent with this interpretation, the most pronounced declines in incidence in our study were observed among the oldest-old (≥85 years).
Nonetheless, selective survival is only one of several non-mutually exclusive explanations: with advancing age, depressive symptoms are increasingly under-recorded, attributed to coexisting organic illnesses or to neurodegeneration (diagnostic overshadowing by dementia) and presenting atypically as ‘masked’ somatic depression, while frail older adults are referred less often to specialist psychiatric services and competing mortality progressively reduces the person-time at risk in the older groups.
The COVID-19 pandemic likely affected these trends through reduced access to mental health services and excess mortality among frail older adults, making it difficult to disentangle true epidemiological changes from healthcare-related effects. In Italy, community mental health services were substantially disrupted, with reduced activity and a shift to remote care (Carpiniello et al., Reference Carpiniello, Tusconi, Di Sciascio, Zanalda and Di Giannantonio2020; D’agostino et al., Reference D’agostino, Demartini, Cavallotti and Gambini2020), and register-based evidence confirmed a significant reduction in community mental health service utilisation without a compensatory increase in new depression diagnoses (Prina et al., Reference Prina, Tedeschi, Salazzari, Botte, Ballarin, Rabbi, Imperadore, Roccato, Nicolaou, Ruggeri, Gomez, Lasalvia and Amaddeo2023). At the same time, excess COVID-19 mortality disproportionately affected the frailest elderly, potentially reducing the population at highest risk of depression (Amore et al., Reference Amore, Puppo, Melara, Terracciano, Gentili and Liotta2021). These converging factors make it difficult to disentangle true epidemiological changes from pandemic-related artefacts in 2020–2023 trends.
This study benefits from a large population-based cohort covering the whole Lombardy region, the most populous region in Italy with approximately 10 million residents, a complete longitudinal follow-up over a decade, a multi-source record linkage across four administrative registries, a 10-year wash-out period, and analyses stratified by sex and age. Administrative data provide population-level coverage and long-term follow-up, overcoming limitations of survey-based studies.
However, several limitations should be acknowledged. Temporal stability of case ascertainment cannot be assumed: over the 11-year study period, changes in clinical awareness, diagnostic and coding practices, healthcare service organisation and cultural attitudes towards mental health may have influenced the probability of recording a depressive episode independently of true disease frequency.
In addition, incidence estimates strongly depend on the case definition adopted, and the observed trends may differ under alternative case-definition algorithms. ICD-based coding may lead to misclassification in both directions: non-specific codes may capture conditions not meeting MDD criteria (overestimation), while depressive episodes coded under broader diagnostic categories or not recorded at all may lead to underestimation. Estimates are also sensitive to methodological choices regarding the available historical ascertainment period and rules for distinguishing incident from recurrent episodes. Furthermore, episodes occurring before the available observation period could not be identified and may therefore have resulted in residual left-censoring. Since no validated country-specific reference algorithm is currently available, no single case-identification algorithm can be considered definitive.
Consistent with these methodological challenges, validation studies have demonstrated that ICD-based case definitions for depression achieve high specificity (>94%–99%) but low-to-moderate sensitivity (28%–61%) (Townsend et al., Reference Townsend, Walkup, Crystal and Olfson2012; Fiest et al., Reference Fiest, Jette, Quan, St Germaine-smith, Metcalfe, Patten and Beck2014; Doktorchik et al., Reference Doktorchik, Patten, Eastwood, Peng, Chen, Beck, Jette, Williamson and Quan2019), with hospital discharge records alone showing particularly low sensitivity (28–35%) (Fiest et al., Reference Fiest, Jette, Quan, St Germaine-smith, Metcalfe, Patten and Beck2014). In Italy, a previous study adopted a definition based on ≥180 days of antidepressant dispensing or hospital discharge diagnosis, reflecting the absence of a validated approach for MDD case identification (Zenesini et al., Reference Zenesini, Cascini, Picariello, Profili, Belotti, Maniscalco, Acampora, Gnavi, Francesconi, Vignatelli, Nonino, Bargagli, Tarantino, Salemi, Vanacore and Matranga2025).
Administrative registries are able to capture only cases resulting in a recorded healthcare contact with an MDD diagnostic code within the public healthcare system and therefore do not include a substantial proportion of late-life MDD managed exclusively in primary care or private settings. Studies suggested that depression remains unrecognised by general practitioners in up to two-thirds of older patients (Noyes et al., Reference Noyes, Liu, Lyness and Friedman2011; Kvalbein-Olsen et al., Reference Kvalbein-Olsen, Aakhus, Haavet and Werner2023).
Regarding generalisability, Lombardy’s large population and universal healthcare system can likely allow the representativeness of our findings within Italy. However, differences in healthcare organisation and primary care integration across regions and countries may limit the external validity.
These findings have direct relevance for mental health planning and resource allocation. The substantial gap between the burden of MDD estimated through survey-based instruments and the fraction captured by administrative healthcare registries suggests that a large proportion of older adults with clinically significant MDD remain unrecognised by the public mental health system. From a public health surveillance perspective, relying solely on administrative data to monitor MDD trends among older populations may lead to a misleading picture of declining burden, potentially resulting in the under-allocation of resources for prevention, early detection and treatment of late-life depression. Regional health authorities should consider developing dedicated monitoring systems that combine administrative registries with primary care data and periodic population-based surveys, following models such as the UK Clinical Practice Research Datalink (Herrett et al., Reference Herrett, Gallagher, Bhaskaran, Forbes, Mathur, Van Staa and Smeeth2015) and psychiatric case register linkage systems (Lora et al., Reference Lora, Lesage, Pathare and Levav2017), to inform evidence-based mental health policies for the aging population.
Conclusions
Based on a region-wide population-based study, we documented a substantial decline in recorded MDD diagnoses within the regional public healthcare system among older adults in Lombardy between 2013 and 2023, with differences by sex and age groups. These trends likely reflect the combined effects of several factors, including systematic under-diagnosis, demographic changes, selective survival, evolving healthcare practices, and disruptions to mental health services during the COVID-19 pandemic, rather than a true reduction in the burden of late-life depression. Beyond the epidemiological findings and methodological challenges, our study highlights the high potential of linked administrative healthcare registries for population-based mental health research, as they provide valuable information on clinically diagnosed cases within the healthcare system, while acknowledging that estimates can reflect evolving diagnostic, coding and healthcare practices within healthcare systems, as well as in disease management. Despite these limitations, they provide a foundation for future methodological refinement and integration with complementary data sources. The key message for clinicians and policymakers is that administrative registries, although a powerful population-wide resource for monitoring diagnosed and treated MDD, should not be used in isolation to measure the true burden of late-life depression or to guide resource allocation, as they systematically under-capture an under-recognised condition.
Future research is needed to obtain comparable estimates, integrating administrative data with additional sources such as primary care records and population-based surveys and developing validated algorithms for MDD identification, to reliably inform mental health policies for the ageing population.
Supplementary material
The supplementary material for this article can be found at https://doi.org/10.1017/S204579602610095X.
Availability of data and materials
Restrictions apply to the availability of these data. Data were obtained under a specific contract from the Lombardy Region Data Warehouse, which only provides data in anonymous and aggregated form. All data handling procedures complied with the European General Data Protection Regulation (GDPR) and local privacy laws to protect the confidentiality and integrity of patient information.
Acknowledgements
The authors used artificial intelligence tools for support in language revision. The authors take full responsibility for the content of the manuscript.
Author contributions
P.B., A.A. and A.O. conceived the study. P.B. performed the analyses and contributed to data curation. All authors contributed to the interpretation. P.B., L.B., M.C. and A.A. drafted the manuscript, and all authors critically revised it for important intellectual content. A.O. supervised the study. All authors approved the final version.
Financial support
This research received no specific grant from any funding agency in the public, commercial or not-for-profit sectors.
Competing interests
None declared.
Ethical standards
This study used pseudonymised individual-level administrative healthcare data from the Lombardy Region Data Warehouse, linked through a unique non-identifying code. Researchers had no access to directly identifiable personal information. Data access was granted under a research agreement with the Lombardy Region Welfare Directorate (Direzione Generale Welfare), led by the University of Pavia, in compliance with Regulation (EU) 2016/679 (GDPR) and applicable guidelines and data-protection regulations. As the study involved secondary analysis of pseudonymised administrative data, individual informed consent and additional ethics committee review were not required.




 Open access

