Implications
International developments in ruminant feed evaluation increasingly use dynamic, nutrient-based feed evaluation systems. Feed component-specific fractional passage rates in such systems form one of the most important factors, as they determine the site of degradation and the efficiency of microbial protein synthesis. This study showed that the stable isotope 13C can be used to assess feed component-specific passage behaviour through the gastrointestinal tract of dairy cows. Moreover, results confirm that conventionally used external markers overestimate in vivo situation fractional passage rates.
Introduction
Knowledge on feed-specific fractional passage rates is essential to estimate the extent of rumen degradation and is a prerequisite for many feed evaluation systems (e.g. Agricultural and Food Research Council, Agricultural and Food Research Council (AFRC), 1993; Van Duinkerken et al., Reference Van Duinkerken, Blok, Bannink, Cone, Dijkstra, Van Vuuren and Tamminga2011). Moreover, the fractional rate of passage is a major determinant of microbial protein efficiency (Dijkstra et al., Reference Dijkstra, Kebreab, Mills, Pellikaan, Lopez, Bannink and France2007). Conventional studies on digesta passage dynamics often make use of external markers, for example, rare earth elements, heavy metal mordants/chelates, metal oxides and polyethylene glycol (Faichney, Reference Faichney1975; MacRae, Reference MacRae1975; Udén et al., Reference Udén, Colucci and van Soest1980; Colucci et al., Reference Colucci, MacLeod, Grovum, McMillan and Barney1990; Bosch et al., Reference Bosch, Lammers-Wienhoven, Bangma, Boer and van Adrichem1992; Stefanon et al., Reference Stefanon, Mills and Piasentier1992) or internal markers, for example, indigestible fibre fractions such as rumen indigestible NDF and cellulase indigestible ADF (Tamminga et al., Reference Tamminga, Robinson, Meijs and Boer1989a and Reference Tamminga, Robinson, Vogt and Boer1989b). The general consensus about the criteria for an ideal marker are that a marker should be (1) non-absorbable, (2) neither affect nor be affected by the gastrointestinal tract (GIT) nor by its residing microbial population, (3) physically similar or intimately associated with the fraction it represents and (4) easy to analyse without interfering with other analyses (Faichney, Reference Faichney1975; Owens and Hanson, Reference Owens and Hanson1992). When external markers are used, the assumption is made that they behave identical in terms of passage through the digestive tract as the dietary compound or the nutrient under investigation. Failure results in inaccurate estimates of fractional passage rate (Robinson et al., Reference Robinson, Tamminga and van Vuuren1987; Tamminga et al., Reference Tamminga, Robinson, Vogt and Boer1989b). Internal markers circumvent the latter problems as they are an intrinsic component of the feed or fraction under investigation.
Fractional passage rates in ruminants have been shown to be feed specific and to vary according to diet composition and quality (Bosch et al., Reference Bosch, Lammers-Wienhoven, Bangma, Boer and van Adrichem1992; Rinne et al., Reference Rinne, Huhtanen and Jaakkola1997), forage : concentrate ratio (Colucci et al., Reference Colucci, MacLeod, Grovum, McMillan and Barney1990), forage type (Lund et al., Reference Lund, Weisbjerg and Hvelplund2006) and level of feed intake, the latter among others being governed by stage of lactation (Robinson et al., Reference Robinson, Tamminga and van Vuuren1987; Tamminga et al., Reference Tamminga, Robinson, Vogt and Boer1989b; Colucci et al., Reference Colucci, MacLeod, Grovum, McMillan and Barney1990). Other important factors affecting passage from the rumen are particle density (Ehle and Stern, Reference Ehle and Stern1986; Siciliano-Jones and Murphy, Reference Siciliano-Jones and Murphy1986) and particle size reduction (Balch, Reference Balch1971; Welch, Reference Welch1986; Bayat et al., Reference Bayat, Rinne, Kuoppala, Ahvenjärvi and Huhtanen2011) through the process of comminution, as well as the anatomical and physiological differences between animals, which seem to have a larger influence on the slower moving solid fraction than the faster moving liquid fraction (Udén et al., Reference Udén, Rounsaville, Wiggans and van Soest1982). Stable isotopes (13C, 15N) are markers that behave identically to the dietary fraction under investigation, that is, condition (3) above, and are preferable to external markers where the above-mentioned assumption may not be always true. The potential advantages of using a single, stable isotope as digesta markers have been acknowledged (Boutton, Reference Boutton1991; Svejcar et al., Reference Svejcar, Judkins and Boutton1993; Südekum et al., Reference Südekum, Ziggers, Roos, Sick, Tamminga and Stangassinger1995; Huhtanen and Hristov, Reference Huhtanen and Hristov2001; Sponheimer et al., Reference Sponheimer, Robinson, Roeder, Hammer, Ayliffe, Passey, Cerling, Dearing and Ehleringer2003). Few validation studies, however, have been conducted with isotopes as digesta passage dynamics markers, with only Huhtanen and Hristov (Reference Huhtanen and Hristov2001) validating specific aspects of the use of stable isotopes for this purpose. Udén et al. (Reference Udén, Colucci and van Soest1980) indicated that 14C-labelled cell walls can be used as a single-dose marker, but that corrections for marker loss due to digestion have to be made in order to estimate rate of passage, because digestion occurs at different rates in the GIT. In addition, Smith (Reference Smith1989), Huhtanen and Hristov (Reference Huhtanen and Hristov2001) and Huhtanen et al. (Reference Huhtanen, Ahvenjärvi, Weisbjerg and Nørgaard2006) noted that accurate assessment of particle kinetics using a single 14C-isotope is dependent on the removal of the isotope in the potentially digestible fraction. However, the use of an isotope ratio, such as 13C : 12C, to measure kinetics of digesta passage could circumvent problems associated with the use of a single isotope as a marker, if it could be shown that digestibility affects both isotopes of the ratio to the same degree. When 13C is homogeneously distributed in the fraction under investigation and under the theory that both isotopes are removed from the GIT at a similar rate, indigestible material (marker fraction) can be collected over time to allow determination of the isotope ratio at various time points. The excretion pattern of the 13C : 12C ratio could then be used to determine the passage kinetics of the fraction under investigation. The major benefit of using a stable isotope ratio as an internal marker is that it allows the determination of the fractional passage rate of individual feed components such as cell wall components and/or starch, and also theoretical entities such as dry matter (DM), which cannot be done with external markers.
The main aim of the current study was to evaluate the use of the 13C : 12C ratio as a marker to assess digesta passage kinetics in dairy cattle. A nonlinear multicompartmental model (Dhanoa et al., Reference Dhanoa, Siddons, France and Gale1985) was used to determine fractional outflow rates from the two compartments in the GIT having the longest (viz. rumen) and second longest (viz. large intestine) retention time. An in vivo study was conducted to quantify passage characteristics of DM and NDF in high and low digestible 13C-enriched grass silages through the GIT of dairy cows. In addition, an in vitro study was conducted to investigate the changes in the ratio of 13C : 12C in the DM, NDF and ADL of the high and low digestible 13C-enriched grass silages when incubated with rumen fluid using an in vitro batch culture system.
Material and methods
Preparation of 13C-labelled grass silage
A uniform pasture was selected at the experimental farm of Wageningen University ‘De Ossekampen’ (51°58′N, 5°38′E), which had been established 2 years previously. The pasture was divided into two different sections of about 1.9 ha each. After harvest, one section received 100 kg and the other one 50 kg of N/ha (N applied as calcium ammonium nitrate (CAN)). Thereafter, the respective sections were allowed to regrow for a period of 39 or 81 days until the time of harvest. Accordingly, two contrasting bulk grass silages were made, one with a high digestibility (GSH; 100 kg N/ha, 39 days) and one with a low digestibility (GSL; 50 kg N/ha, 81 days).
Experimental plots of ryegrass (Lolium perenne L) were labelled with 13C under field conditions. The two 13C-labelled grasses were obtained during the regrowth period at preselected experimental plots (area 2.15 m2; 155 × 139 cm) at the above-mentioned pasture sections. The labelling procedure started at 0900 h and lasted for ∼2 h. At the start of a labelling procedure, portable transparent assimilation cages (155 × 139 × 30 cm) were placed on the plots to ensure airtight conditions. 13CO2 was released into the cage by adding 80 ml (2 M) lactic acid to 10 g of [13C]bicarbonate (99 atom%, Mass Trace, Woburn, MA, USA) in steps of 10 ml per 10-min interval. The [13C]bicarbonate was weighed into a 250-ml glass bottle, dissolved in ∼100 ml demineralized water and the bottle was sealed with a rubber stopper provided with an outlet that was connected to the interior of the cage by means of a short plastic tube. To ensure that all 13CO2 was released from the [13C]bicarbonate, an additional 40 ml of lactic acid was added to the bottle. To ascertain that all 13CO2 was expelled from the bottle into the assimilation cage, and thus could possibly be assimilated by the grass, 10 ml of bicarbonate (5 g/100 ml; Merck 6323, Merck KGaA, Darmstadt, Germany) was added every 10 min during a 40-min period. Thereafter, the cages were removed from the plots to allow the grass to assimilate under the normal ambient conditions until the next labelling. Labelling occurred six times during a 39-day regrowth period on the plot with high level of N fertilization and eight times during an 81-day regrowth period on the plot with low N fertilization. Plots were labelled on days with clear skies and sufficient solar radiation for proper assimilation by measuring the level of photosynthetically active radiation, which was empirically set as 500 μmol m−2 s−1. At the end of a regrowth period, either at day 39 or at day 81, the (non-labelled) pasture sections and the 13C grass from the experimental plots were harvested at the same time. The pasture sections (unlabelled grass) were cut using a rotary disk mower (500 series, John Deere, Nijmegen, The Netherlands), whereas the experimental plots with labelled grass were cut by hand at 2 to 3 cm above the ground level. The labelled grass was stored in permeable nylon bags and ensiled for a 6-week period similar to the grass from the unlabelled pasture sections, thus creating one 13C-enriched grass silage of high digestibility and one of low digestibility. Directly after recovering the labelled ensiled products from the bulk silages, they were cut to a length of ∼3 cm, placed in airtight plastic bags and stored at −20°C pending further treatment. Subsamples from the labelled grass silages were taken and analysed for 13C-enrichment, in order to determine the required amount of material to pulse dose in the rumen. The mean (±s.d.) degree of 13C-enrichment (δ 13C v. Vienna Pee Dee Belemnite, PDB) in the DM of low and high digestible silages were 496.7 (±0.92)‰ and 786.6 (±1.18)‰, as compared with −30.0 (±0.13)‰ and −29.4 (±0.19)‰ for the natural level of enrichment of the unlabelled grass silages, respectively.
In vivo study of 13C-passage kinetics
Animals, housing and diets
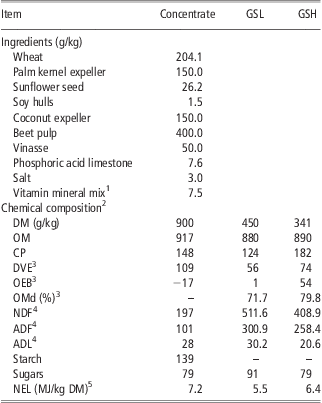
Two Holstein–Friesian dairy cows, in their third lactation, were fitted with a rumen fistula (Type 1C, Bar Diamond Inc., Parma, ID, USA) and used in a cross-over design where cows (1, 2) were randomly assigned to one of the silages (GSH, GSL) with marker (13C-DM, 13C-NDF, Cr-NDF) considered as a nested factor within diet. At the start of the experiment, the animals were 145 ± 6 days in milk (mean ± s.d.), with a BW of 553 ± 23 kg and a production of 21.0 ± 5.0 kg of fat and protein corrected milk per day. The animals received either the GSH or GSL and concentrates in a fixed proportion relative to the total DM (54% and 46%, respectively). DM intake at the start of the experiment was 16.1 ± 0.2 kg/day (mean ± s.d.). The concentrate composition and silage quality is presented in Table 1. The animals were housed in a tie stall and had free access to water and to a mineral lick.
Ingredients and chemical composition of the compound feed and the GSL and GSH
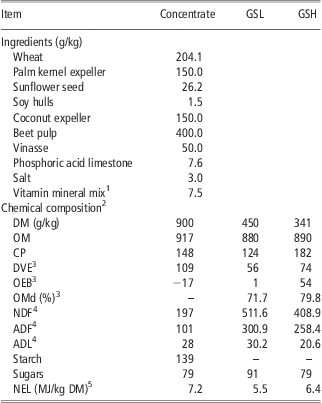
GSL = grass silage of low digestibility; GSH = grass silage of high digestibility; DM = dry matter; OM = organic matter; NIRS = near infrared reflection spectroscopy; NEL = net energy for lactation.
1Mineral premix on the basis of limestone, PRE-MERVO, Utrecht, The Netherlands.
2Units in g/kg of DM unless specified otherwise. Items determined by NIRS unless mentioned otherwise.
3DVE = intestinal digestible protein, OEB = degraded protein balance, OMd = organic matter digestibility coefficient (Tamminga et al., Reference Tamminga, van Straalen, Subnel, Meijer, Steg, Wever and Blok1994).
4NDF analysed according to a modified method of Van Soest et al. (Reference Van Soest, Robertson and Lewis1991) as described by Goelema et al. (Reference Goelema, Spreeuwenberg, Hof, Van Der Poel and Tamminga1998), ADF and ADL analysed as described by Van Soest (Reference Van Soest1973).
5Calculated as described by Van Es (Reference Van Es1975).
Experimental treatments, sampling and analyses
The animals were randomly assigned to one of the two unlabelled silages, GSH or GSL and allowed to adapt for 3 weeks before measurement. The measurements lasted for 1 week and after that, animals were immediately re-allocated to the other diet to start the subsequent adaptation period. At the first day of the measurement period, the animals received a pulse dose of the corresponding 13C-labelled silage (hand cut to a length of ∼3 cm) directly into the rumen. The quantity of the 13C pulse dosed above the natural occurring level of 13C in the silages into the rumen was 677 mg 13C for the GSL (862 g fresh weight; 252 g dry weight) and 705 mg 13C for the GSH (617 g fresh weight; 170 g dry weight), and agrees with amounts reported by Huhtanen and Hristov (Reference Huhtanen and Hristov2001). In addition, the animals received a 100-g pulse dose of chromium-mordanted wheat straw (Cr-NDF) into the rumen. The Cr-NDF was prepared as described by Udén et al. (Reference Udén, Colucci and van Soest1980) and after drying, ground to pass a 0.5-mm screen. Cr-NDF (0.5 mm) was specifically chosen as it was empirically established to give fractional passage rates concurring to the rate constants used in feed evaluation systems as described by Vérité et al. (Reference Vérité, Journet and Jarrige1979), Tamminga et al. (Reference Tamminga, van Straalen, Subnel, Meijer, Steg, Wever and Blok1994) and Tuori et al. (Reference Tuori, Kaustell and Huhtanen1998). Hence, this allowed us to evaluate the kinetics of the novel internal marker (13C : 12C ratio) using the passage kinetics of Cr-NDF as a point of reference, realizing the fact that the difference in marker preparation (i.e. the large contrast in particle size and type of material between the external and internal markers) will show a very different passage behaviour. To achieve complete mixing of the 13C-labelled materials and Cr-NDF at time zero, the total rumen content was evacuated, mixed thoroughly with the markers and quantitatively placed back into the rumen cavity.
Individual faecal samples were quantitatively collected upon defecation from time points − 1 to 98 h after administration of the pulse dosing. Time of defecation and weight of excreted faeces were recorded and a representative sample (300 g) was taken and stored at −20°C pending analysis. Faecal samples for analysis were taken based on defecation time such that samples were equally distributed over time. Samples were freeze dried (FTS, Dura-Dry programmable tray freeze drier, Stone Ridge, NY, USA), ground to pass a 1-mm screen (Wiley mill, T. Peppink & Zn., Machinefabriek, Amsterdam, The Netherlands) and analysed for DM (ISO 6496), Cr and NDF residue. The NDF residue was determined using a modified method of Van Soest et al. (Reference Van Soest, Robertson and Lewis1991) as described by Goelema et al. (Reference Goelema, Spreeuwenberg, Hof, Van Der Poel and Tamminga1998), but omitting the incineration step. Subsamples of faecal material and residual NDF material were pulverized in a bullet mill (5 min at 80 Hz; MM 2000; Retsch, Haan, Germany) and analysed for 13C by combustion isotope ratio mass spectrometry (C-IRMS; Finnigan_MAT CN, Bremen, Germany). The external marker was oxidized by wet-destruction at 350°C for 1 h in an HNO3 (65%, Fluka Chemie GmbH, Buchs, Switzerland) and HClO4 (70% to 72%, Merck KgaA) solution and absorbance of Cr6+ was measured at 357.8 nm in a nitrous oxide acetylene flow using an atomic absorption spectrophotometer (SpectrAA 300, Varian BV, Middelburg, The Netherlands).
Calculations and statistical analyses
Faecal excretion patterns of excess 13C in the DM and NDF fractions were established after correcting the atom percentage 13C (At%13C) for natural enrichment. Excretion patterns were fitted to the nonlinear multicompartmental model as described by Dhanoa et al. (Reference Dhanoa, Siddons, France and Gale1985):
 $${{Y}_t}\: = \:A{{{\rm{e}}}^{{\rm{ - (}}{{K}_{\rm{1}}}\:\times \:t{\rm{)}}}} \,{\rm{exp}}\left[ {{\rm{ - (}}N - {\rm{2)}}\,{{{\rm{e}}}^{{\rm{ - (}}K{\pre}_{{\rm{2}}} - K{\pre}_{{\rm{1}}}{\rm{)}}\:\times \:t}} } \right]$$
where Yt represents the faecal marker concentration at time = t, t is the time since introduction of pulse dose, N denotes the number of compartments, K 1 and K 2 resemble the fractional rate constants for the two compartments in the digestive tract with the longest retention times, most likely representing the rumen and the caecum/large intestine compartments. A forms a scalable parameter dependent on the N, K 1 and K 2. From the parameter estimations on the basis of the multicompartmental model, the transit time (TT, equation (2 )), the total mean retention time (TMRT, equation (3 )) and the moment of peak concentration (PCT, equation (4 )) were calculated:
 $${\rm{TT}}\,({\rm{h)}}\:{\rm{ = }}\:\mathop{\sum}\limits_{i\: = \:3}^{N{\rm{ - 1}}} {{\rm{1/[}}{{K}_{\rm{2}}}\:{\rm{ + }}\:{\rm{(}}i{\rm{\, -\, 2)}}\:\times \:{\rm{(}}{{K}_{\rm{2}}}{\rm{ \,- \,}}{{K}_{\rm{1}}}{\rm{)]}}} $$
 $${\rm{TMRT}}\,({\rm{h)}}\:{\rm{ = }}\:{\rm{1/}}{{K}_{\rm{1}}}\:{\rm{ + }}\:{\rm{1/}}{{K}_{\rm{2}}}\:{\rm{ + }}\:{\rm{TT}}$$
 $${\rm{PCT}}\,({\rm{h)}}\:{\rm{ = }}\:{\rm{\{ ln[(}}N{\rm{ \,- \,2)}}\:\times \:{\rm{(}}{{K}_{\rm{2}}}{\rm{\, -\, }}{{K}_{\rm{1}}}{\rm{)}}\:{\rm{/}}\:{{K}_{\rm{1}}}{\rm{]\} }}\:{\rm{/}}\:{\rm{(}}{{K}_{\rm{2}}}{\rm{\, -\, }}{{K}_{\rm{1}}}{\rm{)}}$$
The TMRT was calculated from the reciprocal of the K 1 and K 2 values and the retention time was associated with the remaining combined compartments. The latter is assumed to be equal to the TT. The TT represents the moment of first appearance of the marker in the faeces and PCT is the time when the excretion curve reaches PCT (in case of Cr) or enrichment (in case of 13C : 12C ratio). After reaching PCT, the level of the 13C : 12C ratio in faeces diminishes and from the descending slope fractional passage from the rumen compartment (K 1) is estimated. Excretion patterns of the 13C : 12C ratio in the NDF fraction did not reach baseline at 96 h post marker administration. This effect is similar to the observations of Alexander et al. (Reference Alexander, Bartley and Meyer1969) and Huhtanen and Hristov (Reference Huhtanen and Hristov2001) who used 14C and 15N as internal marker for NDF fraction, respectively. These results indicate that fractional rate constants could be somewhat underestimated in this case.
Curve fitting to passage traits was done using the nonlinear least squares regression procedure PROC NLIN (Statistical Analysis Systems Statistical software package version 9.1.3; SAS Institute, Cary, NC, USA). Initial values for the iterative procedure were obtained through a grid search and curve fits were normally solved after 12 to 18 iterations. Predicted marker concentrations were compared with the observed values using the root mean square prediction error scaled to the observed mean (mean prediction error (MPE)). The MPE was decomposed into errors due to overall bias, errors due to deviation of the regression slope from unity and errors due to random variation (Bibby and Toutenburg, Reference Bibby and Toutenburg1977).
Passage kinetics estimates obtained from equations (1) to (4) were tested by GLM procedure of SAS using the following model:
 $${{Y}_{ij}}\:{\rm{ = }}\:\mu \:{\rm{ + }}\:{{P}_i}\:{\rm{ + }}\:{{C}_j}\:{\rm{ + }}\:{{S}_k}\:{\rm{ + }}\:M{{{\rm{(}}S{\rm{)}}}_{lk}}\:{\rm{ + }}\:{{e}_{ijkl}}$$
where Yij represents the dependent variable, μ the overall mean, P i the effect of period (i = 1, 2), Cj the effect of cow (j = 1, 2), Sk the effect of silage (k = 1, 2), M(S)kl the effect of marker nested within silage (l = 1, 2, 3) and eijkl the error term. Differences were considered significant at a probability of P < 0.05. Post hoc analyses were carried out using the Tukey test-to-test pairwise comparisons.
In vitro fermentation of 13C-labelled grass silage
Experimental procedure
GSH and GSL samples were freeze dried (FTS, Dura-Dry programmable tray freeze drier), ground to pass a 1-mm screen (Centrifugal Mill, Retsch ZM 100) and used as a substrate in an in vitro batch culture system to determine fermentative degradation at 0, 8, 24, 48 and 72 h. For silage time-point combinations 8, 24, 48 and 72 h, five replicate bottles were incubated; two of these were used to isolate the residual NDF fraction, two were used to isolate the residual lignin fraction and the remaining bottle was used to collect the residual DM fraction. For time point 0 h DM, NDF and ADL fractions were directly determined in the silage material.
Approximately 0.5 g of substrate were weighed into 100-ml serum bottles to which 78 ml of a pre-warmed semi-defined medium were added together with 1 ml of a vitamin-phosphate buffer solution, 4 ml of a bicarbonate buffer solution and 1 ml of a reducing agent. All handlings were done under an oxygen-free CO2 flow to ensure anaerobic conditions. Handling of substrate and preparation of media and buffers were done as described by Williams et al. (Reference Williams, Bosch, Boer, Verstegen and Tamminga2005). Bottles were sealed with butyl rubber stoppers and then inoculated with 5 ml of a rumen liquid mixture.
Inoculation
Rumen liquid was obtained from three Holstein–Friesian dairy cows fitted with rumen fistulae (Type 1C, Bar Diamond Inc.). The animals received low quality hay ad libitum intake supplemented with 1 kg of a standard concentrate per day, containing 7.2 MJ/kg DM of net energy for lactation and 100 g/kg DM of intestinally digestible protein (DVE; Rijnvallei Diervoeder BV, Barneveld, The Netherlands), and had free access to water. After collection, the rumen liquid was directly placed into pre-warmed thermos flasks, which were pre-filled with CO2. In the laboratory, the rumen liquid of animals was pooled, homogenized with a blender for 60 s and strained through two layers of cheesecloth. Again all handlings were done under CO2 to ensure anaerobic conditions.
Sampling and chemical analyses
Directly following inoculation of the in vitro bottles, needles (BD MicrolanceTM 3, No. 20, BD, Drogheda, Ireland) were placed in the rubber stoppers to enable the escape of fermentation gas. Bottles were placed in a pre-warmed incubator at 39°C, and replicate bottles (5 per time point) were retrieved at 8, 24, 48 or 72 h after the start of incubation. The residual substrate at each time point was directly collected by leading the fermentation liquids over pre-weighed, sintered glass filter crucibles (Schott Duran, porosity no. 2, Mainz, Germany). The glass filter crucibles contained ∼5 g of pre-incinerated sea sand (pro analysi, Merck) to improve the filtration process. After filtration, crucibles were directly frozen at −20°C and the DM residue weight was determined after freeze drying to constant weight. Thereafter, the residual NDF matter in two of the replicate crucibles was determined by boiling the residue in neutral detergent following a modified method of Van Soest et al. (Reference Van Soest, Robertson and Lewis1991) as described by Goelema et al. (Reference Goelema, Spreeuwenberg, Hof, Van Der Poel and Tamminga1998), but omitting the incineration step. The residual lignin matter was determined in another two replicate crucibles following the procedure of Van Soest (Reference Van Soest1973), and again omitting incineration. Following the neutral detergent or acid detergent treatments, crucibles were then freeze dried to stable weight, and residual NDF and ADL matter were determined from the weight loss. These residues were analysed for their total carbon content (TC) and for their isotopic enrichment using a combustion isotope ratio mass spectrometer (C-IRMS; Finnigan_MAT CN). In case of the residual NDF matter, the amounts of 13C and 12C were quantified by placing the residual NDF matter and sea sand of individual crucibles quantitatively into a bullet mill (Retsch MM 2000), grinding it for 5 min at 80 Hz and analysing this by C-IRMS. After determining the residual ADL matter, the ligniferous residue, which was precipitated as a fine layer on the sea sand, was isolated from the crucible content and placed into a bullet mill with as little sand as possible and was ground for 5 min at 80 Hz before the determination of the relative level of 13C-enrichment (13C : 12C ratio) in the residual ADL by C-IRMS. The remaining replicate crucibles were used to determine the level of 13C-enrichment in the DM at different time points of in vitro incubation.
Calculations and statistical analyses
The residue remaining after fermentation at successive time points was scaled to the initial substrate weight (∼0.5 g) added to the serum bottles. The absolute amounts of 13C and 12C in the initial substrate and residual materials were quantified from TC and the At%13C. The latter refers to the absolute number of 13C atoms relative to the total number of C atoms:
 $${\rm{At\% }}{\pre}^{{{\rm{13}}}}{\rm{C}}\: = \:\frac{{{\rm{No}}{\rm{.}} \ {\rm{of}} \ {\rm{atoms}} \ {\pre}^{{{\rm{13}}}}{\rm{C}}}}{{{\rm{Total}} \ {\rm{no}}{\rm{.}} \ {\rm{of}} \ {\rm{atoms}} \ {\rm{C}}\,\left( {{\pre}^{{{\rm{12}}}}{\rm{C}}\: + \:{\pre}^{{{\rm{13}}}}{\rm{C}}\: + \:{\pre}^{{{\rm{14}}}}{\rm{C}}} \right)}}\:\times \:{\rm{100\% }}$$
The isotope enrichment is presented in δ 13C, where δ 13C denotes the 13C : 12C ratio in a sample relative to the 13C : 12C ratio of the international PDB standard and expressed per ml (‰ v. Vienna PDB):
 $$\delta {\pre}^{{{\rm{13}}}}{\rm{C}}\: = \:\frac{{\left( {{\pre}^{{{\rm{13}}}}{\rm{C}}\:{\rm{:}}\:{\pre}^{{{\rm{12}}}}{\rm{C}} \ {\rm{of}} \ {\rm{sample}}\:{\rm{ - }}\:{\pre}^{{{\rm{13}}}}{\rm{C}}\:{\rm{:}}\:{\pre}^{{{\rm{12}}}}{\rm{C}} \ {\rm{of}} \ {\rm{standard}}} \right)\:\times \:{\rm{1000}}}}{{{\pre}^{{{\rm{13}}}}{\rm{C}}\:{\rm{:}}\:{\pre}^{{{\rm{12}}}}{\rm{C}} \ {\rm{of}} \ {\rm{standard}}}}$$
The At%13C within the fermentative degraded fractions (i.e. the disappeared substrate at time = t) was derived from the differences between the absolute amount of 13C and total C in the initial substrate (DM) and that of the residual DM or NDF. This results in the At%13C present in the disappeared fraction. Corrections were made for changes in molecular weight inherent to the changes in the level of 13C-enrichment.
The decrease in residual DM and NDF over time was fitted using an exponential equation adopted from Robinson et al. (Reference Robinson, Fadel and Tamminga1986):
 $${{R}_t}\: = \:{{F}_{\rm{r}}}\: + \:{\rm{(100}}\:{\rm{ - }}\:A\: - \:{{F}_{\rm{r}}}{\rm{)}}\:\times \:{\rm{e}}{\pre}^{{\left( {{\rm{ - }}{{K}_{\rm{d}}}\:\times \:t} \right)}}$$
where Rt denotes the residue taken at time = t, F r represents the residual fraction estimated at time t = ∞, A represents the estimated instantaneously disappeared fraction at time = 0 h and K d denotes the fractional rate constant of degradation (/h) of the potentially degradable fraction (100 − A − F r). The same equation was used to describe the disappearance of both 13C and 12C from the batch culture system. Therefore, the quantitative amounts of residual isotope at different time points were determined and expressed relative to the initial amount of isotope weighed in at the start of incubation. Curve fitting was done using the nonlinear least square regression procedure PROC NLIN (SAS Institute Inc., Cary, NC, USA). Initial values for the iterative procedure were obtained through a grid search using Marquardt as the iterative method. Degradation kinetics estimates obtained from equation (8 ) were tested by GLM procedure of SAS using the following model:
 $${{Y}_{ij}}\:{\rm{ = }}\:\mu \:{\rm{ + }}\:{{S}_i}\:{\rm{ + }}\:{{F}_j}\:{\rm{ + }}\:{{T}_k}\:{\rm{ + }}\:{{{\rm{(}}F\:\times \:T{\rm{)}}}_{jk}}\:{\rm{ + }}\:{{{\rm{(}}S\:\times \:F\:\times \:T{\rm{)}}}_{ijk}}\:{\rm{ + }}\:{{e}_{ijk}}$$
where Yij represents the dependent variable, μ represents the mean, Si represents the silage effect (i = 2), Fi refers to the fraction effect (j = 3), Tk represents the time effect (k = 5), (F × T)jk and (S × F × T)ijk refer to the interaction and eijk denotes the error term. The Tukey multiple range test was used for pairwise comparisons with differences considered significant at a probability of P < 0.05.
Results
Passage characteristics of 13C-enriched fractions
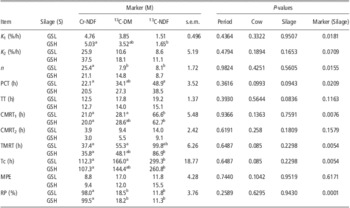
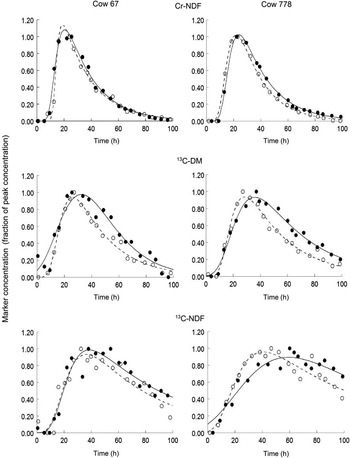
The relative analytical error for At%13C in the present study for the DM and NDF fractions was 0.54 ± 0.22% (mean ± s.e.) and 0.33 ± 0.08%, respectively. Both cows remained healthy throughout the study. The passage characteristics fitted from the in vivo determined faecal excretion patterns of Cr-NDF and the δ 13C-enriched in the DM and NDF fractions of GSH and GSL diets are presented in Table 2. MPE (±s.d.) of all curve fits was 12.4 ± 6.1% of which 95.5 ± 7.0% was related to errors due to random disturbance, 1.6 ± 2.3% to errors of central tendency and 3.0 ± 4.7% to errors due to regression. The MPE did not differ between markers (Cr-NDF, 13C-DM and 13C-NDF) nested within silage type (Table 2, P = 0.617). The mean fractional passage rates (Table 2) did not differ between GSL and GSH for both K 1 (3.37% v. 3.40%/h; P = 0.951) and K 2 (15.1% v. 22.2%/h; P = 0.165). Animals receiving GSL had a 2.6 h delay (P = 0.084) in TT compared with GSH (Table 2). Differences between marker type (Cr-NDF, 13C-DM and 13C-NDF) were clear with a mean value for K 1 decreasing from 4.89%/h (Cr-NDF) to 3.68%/h (13C-DM) and 1.58%/h (13C-NDF; mean values not presented in Table). The faecal excretion patterns of Cr-NDF, 13C-DM and 13C-NDF fractions of the individual cows for the GSH and GSL diets differed considerably (Figure 1). On average, Cr-NDF reached PCT at an earlier point in time (PCT = 21.3 h) than 13C-DM (30.7 h) and 13C-NDF (43.7; mean values not presented in Table 2). Cr-NDF concentration showed a steep increase during the first 20 h after pulse dosing (Figure 1), whereas PCT time showed no difference between GSL and GSH. In contrast, the PCT for 13C-DM in GSL was numerically delayed compared with that of GSH (Table 2), and the increase in 13C-DM before PCT occurred at a higher rate for GSH compared with GSL (Figure 1, Table 2). The retention time in rumen compartment (CMRT1) and total TMRT for 13C-NDF tended to be increased (P ⩽ 0.065) compared with 13C-DM and Cr-NDF. The retention times for the caecum/large intestine compartment (CMRT2) were similar for 13C-DM and 13C-NDF, whereas Cr-NDF gave numerical shorter CMRT2 values compared with the 13C-marked fractions. The recovery of Cr-NDF was close to complete (Table 2), whereas that of the amount of 13C pulse dosed as DM or NDF was considerably lower (P < 0.001).
Rumen passage kinetics of the external marker Cr-NDF and the internal markers 13C-DM and 13C-NDF in cows receiving grass silages of higher (GSH) and lower digestibility (GSL)1

Cr-NDF = chromium-mordanted neutral detergent fibre; 13C-DM = 13C-enriched dry matter; GSL = grass silage of low digestibility; GSH = grass silage of high digestibility.
1Data presented as least square means; K 1, K 2 = fractional passage rate from the compartments with the longest and second longest retention time (%/h); n = number of compartments (Equation 4) ; CMRT1, CMRT2 = 1/K 1, 1/K 2, retention time for the compartment with the longest and second longest retention time (h); PCT = moment when peak concentration is reached; TT = time of first marker appearance or transit time (h); TMRT = CMRT1 + CMRT2+TT; T c = marker total clearance time (h); s.e.m. = standard error of the mean; MPE = mean prediction error; RP = marker recovery percentage (%).
Different superscripts indicate significant differences between markers within silage type (P < 0.05).
Faecal excretion patterns of Cr-NDF (Cr peak at 640 ± 46 mg/kg DM; n = 4), 13C in the DM (peak at 3.21 ± 0.365 δ 13C above natural enrichment; n = 4) and 13C in the NDF (peak at 1.89 ± 0.086 δ 13C above natural enrichment; n = 4) for individual cows receiving a silage of higher digestibility (GSH; observed value (○), model fit (- - - - - -)) v. a silage of lower digestibility (GSL; observed values (●), model fit (———)). Cr-NDF = chromium-mordanted neutral detergent fibre; DM = dry matter.

In vitro substrate degradation and changes in 13C-enrichment
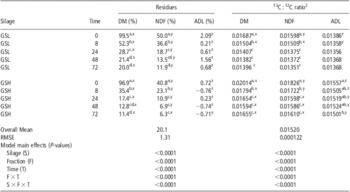
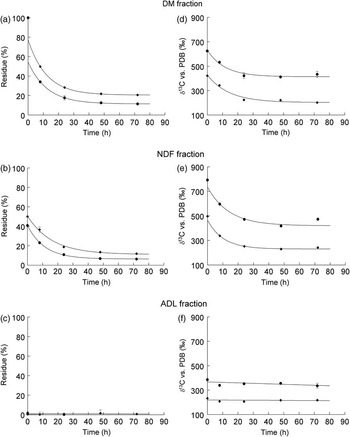
Table 3 summarizes the residues of the DM, NDF and ADL fractions after different time intervals of incubation (visualized in Figure 2a–c), and the level of 13C-enrichment in the different fractions (visualized in Figure 2d–f). The residual DM and NDF fractions showed exponential decreases with time. The model (equation (8 )) fitted well to these data points (R 2 ⩾ 0.996; data not presented). The amounts of residue of ADL fractions were low (Table 3, <21 g/kg DM) and were not affected (P ⩾ 0.999) during prolonged incubation times.
Residues of DM, NDF and ADL fractions and their isotopic ratios at different time points after in vitro incubation with rumen liquid1

DM = dry matter; GSL = grass silage of low digestibility; GSH = grass silage of high digestibility; RMSE = root mean square error.
1LSMean values for the residues (%) calculated as the residual fractions scaled to initial sample weighed in on DM basis.
2LSMean values for enrichment presented as isotopic ratio 13C : 12C in the residual fractions.
abcDifferent superscripts indicate significant difference between time points within silage (P < 0.05).
xyzDifferent superscripts indicate significant difference between fractions within time point (P < 0.05).
Residual DM (a), NDF (b) and ADL (c) fractions and the change in isotopic enrichment within the respective fractions (d, e, f) for silage of higher digestibility (GSH; observed (●), model fit (—)) and silage of lower digestibility (GSL; observed (⧫), model fit (—)), after incubation with rumen liquid at different time points (t = 0, 8, 24, 48, 72 h). DM = dry matter.

The levels of enrichment (13C : 12C ratio, Table 3; δ 13C in Figure 2d–f) in the DM, NDF and ADL showed changes with time, similar to the residues of the corresponding fractions. The overall level of 13C : 12C ratio in the ADL fraction of GSL (0.01367 ± 0.00005; mean ± s.e.m.; n = 10) and GSH (0.01521 ± 0.00010; n = 10) remained unchanged from 8 h of incubation onwards (P ⩾ 0.966; Table 3). Figure 2 shows that the δ 13C-enrichment of the DM and NDF fractions reaches a constant (plateau) level of enrichment from ∼24 h after start of the incubation. This is confirmed by data in Table 3, showing no effect of incubation time on the 13C : 12C ratio for DM (P ⩾ 0.215) and NDF (P ⩾ 0.954) from 24 h onwards. Superimposing Figure 2f on Figure 2d and e showed that the plateau of δ 13C-enrichment in the DM and NDF of GSL did not differ from that in ADL (see also Table 3). In case of GSH, the plateau of enrichment did not differ between the DM and NDF (P ⩾ 0.145), but the fractions were consistently higher enriched compared with the ADL (P ⩽ 0.027).
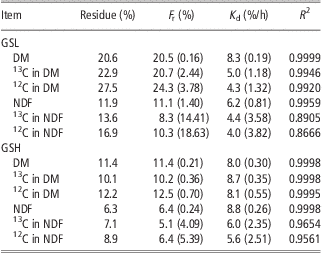
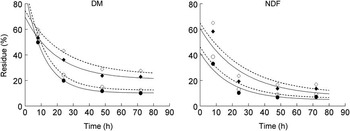
The in vitro degradation characteristics for the DM and NDF fractions of GSH and GSL, and for 13C and 12C in the DM and NDF are summarized in Table 4. The fractional degradation rate (Kd) of the DM fraction did not differ between GSH and GSL (8.0 ± 0.30%/h v. 8.3 ± 0.19%/h), but gave a numerical difference between silages for NDF (GSH = 8.8 ± 0.26%/h v. GSL = 6.2 ± 0.81%/h). The fractional degradation and approximate standard errors presented in Table 4 indicate that Kd-values between 13C and 12C within fractions showed no difference (visualized in Figure 3). The model (equation (8 )) fitted well to the data points as shown by the high coefficients of determination (Table 4, R 2). Only for the 13C and 12C within the NDF fraction of GSL the R 2 were lower as compared with the other fractions.
In vitro degradation characteristics of the DM and NDF fractions and the isotopes (13C, 12C) in the DM and NDF fraction of two grass silages (GSL, GSH)1
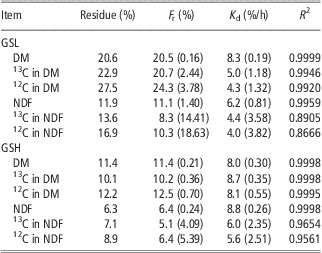
GSL = grass silage of low digestibility; GSH = grass silage of high digestibility.
1Residue = observed residue at t = 72 h; F r = residual fraction estimated at time t = ∞; K d = fractional rate constant of degradation; R 2 = coefficient of determination. Approximate standard errors given in parenthesis.
In vitro degradation characteristics of the relative amounts of residual isotope within the DM and NDF fraction; 13C in silage of higher digestibility (GSH; observed (●), model fit (——)), 13C in silage of lower digestibility (GSL; observed (⧫), model fit (——)), 12C in GSH (observed (○), model fit (- - - -)) and 12C in GSL (observed (◊), model fit (----)), where the residual isotope is expressed as % of the initial amount of isotope weighed in. DM = dry matter.

Discussion
The main objective of this study was to evaluate the use of the 13C : 12C ratio as a marker for assessing total tract digesta passage kinetics in dairy cattle. The in vivo study was conducted to quantify passage characteristics of DM and NDF in a high and low digestible 13C-enriched grass silage through the GIT of dairy cows. The differences in digestibility were obtained by different levels of N fertilization and regrowth period of grass plots. The objective of the in vitro study was to determine the changes in the ratio of 13C : 12C in the undegraded DM, NDF and ADL fractions of the high and low digestible 13C-enriched grass silages when incubated with rumen fluid using an in vitro batch culture system.
Many studies (Faichney, Reference Faichney1975; MacRae, Reference MacRae1975; Udén et al., Reference Udén, Colucci and van Soest1980; Colucci et al., Reference Colucci, MacLeod, Grovum, McMillan and Barney1990; Bosch et al., Reference Bosch, Lammers-Wienhoven, Bangma, Boer and van Adrichem1992; Stefanon et al., Reference Stefanon, Mills and Piasentier1992) have stated that for a marker to accurately determine nutrient digestibility or digesta passage kinetics, it has to be non-absorbable. In theory, this is not necessary because if a marker is absorbed at a known level and endogenous secretions are assumed to occur at a constant rate given the dietary conditions, digestibility or passage rate can still be accurately determined. By this same principle, Jones et al. (Reference Jones, Ludlow, Troughton and Blunt1979) and Coates et al. (Reference Coates, van der Weide and Kerr1991) used the ratio of natural δ 12C and δ 13C-isotopes in the faeces to determine the proportions of C3 and C4 plant material in ruminant diets. On the basis of this principle, in the present study, we used the 13C : 12C ratio in the faecal DM and NDF fraction as a marker to assess the passage kinetics after pulse dosing 13C-enriched material into the rumen. Although most of the dietary 13C and 12C in the DM and NDF fraction would have been digested, in theory, the ratio of 13C : 12C in faecal (undigested) samples is unaffected by the digestive processes, and solely reflects the process of passage as argued below. Although TC of a feed fraction will be affected by the digestive tract and its microbial population, in theory, the ratio between 13C and 12C in the fraction will be unaffected by the processes of fermentation and digestion (enzymatically degradative, absorptive and secretive processes) because they have become intrinsic to the ratio in that specific fraction. After animals are adapted to their diets and no fluctuations occur in diet composition at any moment of intake (e.g. selection between C3 and C4 plant components), the 13C : 12C ratio at any point in the digestive tract will reach a ‘steady-state’ situation. This is nicely illustrated by Coates et al. (Reference Coates, van der Weide and Kerr1991), who observed only mild fluctuations in δ 13C (⩽0.5‰ v. PDB) when animals received C3 and C4 plants alternately every 12 h. Therefore, regular feeding and no allowance of diet selection will result in a stable level of δ 13C in the chyme or faeces. In addition to the endogenous secretions, another important aspect of the internal marker used in the present study is the incorporation of 13C in bacterial biomass and subsequent adherence to the faecal fractions. With respect to the incorporation of 13C into bacterial biomass, the undigested fractions may be differentially loaded with 13C and part of the bacteria will flow at different rates of passage from the rumen depending on the digesta fraction they are associated with. The 13C recycling by bacteria and successive hypothetical contamination of the NDF fraction will be of minor influence. The marker is introduced into the rumen pool at a very high dilution (1.0% to 1.7% (w/w) 13C excess in the 13C rumen pool), thus making the contamination of the 13C : 12C ratio in the NDF by 13C-enriched bacteria negligible. Sørensen et al. (Reference Sørensen, Weisbjerg and Lund2003) observed faecal NDF to vary between 315 and 560 g/kg undigested DM with NDF-N ranging from 136 to 214 g/kg of total undigested N and total N varying between 18 and 38 g/kg faecal DM. Therefore, in case contamination of the NDF fraction that would occur with 13C incorporation by bacteria (as an artefact of the analytical procedure), its effect on the 13C : 12C ratio in the NDF will be negligible. However, with regard to the faecal DM fraction, bacterial 13C recycling may have an influence on its fractional passage. Van Vliet et al. (Reference Van Vliet, Reijs, Bloem, Dijkstra and De Goede2007) quantified microbial biomass in faeces between 1 and 8 g of bacterial C per kg undigested organic matter for a range of dairy cow diets. This suggests that the presence of bacterial matter in the faecal DM is affected by factors such as diet composition and daily feed intake. The differential flow of bacteria compared with that of the DM fraction, in combination with 13C recycling by bacteria can potentially influence the 13C : 12C ratio, and hence explain in part the difference observed between DM and NDF fractional passage.
In order to accurately determine digesta passage kinetics, it needs to be assumed that the digestion of the dietary DM and NDF fractions across the digestive tract remained constant over time, as is true for the secretions from endogenous and microbial origin. This follows from the original axiom of Blaxter et al. (Reference Blaxter, Graham and Wainman1956), who argued that whole tract digestibility or the extent of rumen degradation is a constant estimated from the kinetics parameters for passage and degradation, which forms the basis for models describing the extent of rumen degradation (Dijkstra et al., Reference Dijkstra, France, Neal, Assis, Aroeira and de Campos1996; AFRC, 1998; France et al., Reference France, Dijkstra, Dhanoa, Lopez and Bannink2000). Both enriched silages (GSH and GSL) showed a decrease in δ 13C in the DM and NDF fractions in the residue after in vitro fermentation up to 24 h, after which time the level of enrichment showed no further decline (Figure 2). Twenty-four hours is well before the moment of peak enrichment in the faeces is reached in vivo (between 27 and 34 h; Table 2, Figure 1), and start of the descending part of the marker excretion curve. The fractional passage rate from the rumen compartment is estimated from the descending part of the marker excretion curve. Because the 13C : 12C ratio in the undegraded DM and NDF residues reaches stability at 24 h, this provides evidence that the tracer can be used as a marker to estimate ruminal passage rates.
Several authors have reported on the use of isotopes to study passage kinetics through the digestive tract of South American camelids (Sponheimer et al., Reference Sponheimer, Robinson, Roeder, Hammer, Ayliffe, Passey, Cerling, Dearing and Ehleringer2003) and ruminants using 14C (Alexander et al., Reference Alexander, Bartley and Meyer1969), 13C (Svejcar et al., Reference Svejcar, Boutton and Trent1990; Südekum et al., Reference Südekum, Ziggers, Roos, Sick, Tamminga and Stangassinger1995), or 15N (Huhtanen and Hristov, Reference Huhtanen and Hristov2001). In dairy cows, the latter authors have made an attempt to quantify passage kinetics of the 15N-NDF and 15N-ADF fraction from internally labelled 15N alfalfa. They observed that 15N-NDF fractional passage rates were higher than those of 15N-ADF, which agrees with the differences in rumen outflow rates of indigestible neutral and acid detergent fractions as observed by Tamminga et al. (Reference Tamminga, Robinson, Vogt and Boer1989b) and Huhtanen et al. (Reference Huhtanen, Kaustell and Jaakkola1994). Huhtanen and Hristov (Reference Huhtanen and Hristov2001) associated this difference between NDF and ADF fractional passage with the partial digestion of 15N-NDF in the rumen, whereas digestibility of 15N-ADF was considered negligible. As hypothesized earlier, to our view, this explanation neglects the point that the 14N is digested at a similar rate as the 15N, leaving the 15N : 14N ratio intact. Hence, the difference in fractional passage observed by Huhtanen and Hristov (Reference Huhtanen and Hristov2001) would not be an artefact caused by digestion but actually reflect the difference in passage behaviour of both feed fractions. Sheep receiving a pulse dose with 13C-enriched alfalfa (Svejcar et al., Reference Svejcar, Boutton and Trent1990) showed a similar faecal excretion pattern in δ 13C compared with the curves obtained in the current study, reaching peak enrichment at 32 h after dosing. Alexander et al. (Reference Alexander, Bartley and Meyer1969) pulse dosed one dairy cow with 14C-labelled hay at different stages of maturity and measured faecal excretion patterns in the DM, NDF, ADF, neutral detergent solubles (NDS) and cellulose. Fractional removal rates of NDS were significantly higher compared with those of the DM, NDF, ADF and cellulose, and DM was only numerically higher than the NDF, ADF and cellulose. Similar to our observations, peak 14C activity in faecal excretions of DM (32 to 36 h) and NDF, ADF and cellulose (36 to 54 h) were more delayed for the later maturity stages (bloom and seed) compared with early maturity stage. In their study, Alexander et al. (Reference Alexander, Bartley and Meyer1969) also measured 14C activity in the ruminal bacterial protein fractions. They showed that peak activity in bacterial protein occurred at 3 h post dosing. Theoretically, this could have caused a signal in the faecal fractions as discussed earlier and explain in part the higher fractional rates obtained for the NDS and the DM fraction.
In the current study, the fractional passage rates of 13C-DM from the rumen compartment (K 1, Table 2) were similar for both silages (GSL = 3.85%/h v. GSH, 3.52%/h). Excretion patterns between the two silages seem to differ more for 13C-DM and 13C-NDF than for Cr-NDF (Figure 1), although data in Table 2 only suggest minor effects of silage type. Huhtanen and Hristov (Reference Huhtanen and Hristov2001) observed similar fractional passage rates from the rumen using internally labelled 15N lucerne. In the current trial, the mean fractional passage rate of Cr-NDF (GSL = 4.76%/h v. GSH, 5.03%/h) was only numerically higher than 13C-DM (P ⩾ 0.406) but distinctly higher than 13C-NDF (P ⩽ 0.048). External markers, such as the Cr-NDF used here, are not part of the fraction under investigation (e.g. DM, NDF or starch), and therefore may behave differently with regard to passage, and are maybe only representative for the fraction of feed particles with a size and density similar to that of the marker (Bruining and Bosch, Reference Bruining and Bosch1992). Compared with work conducted with external markers (Colucci et al., Reference Colucci, MacLeod, Grovum, McMillan and Barney1990; Bosch and Bruining, Reference Bosch and Bruining1995; Rinne et al., Reference Rinne, Huhtanen and Jaakkola1997), the 13C-DM and especially the 13C-NDF appear to yield lower fractional passage rates. This indicates that the external marker as used in the current trial (Cr-NDF, ground at 0.5 mm) may overestimate the fractional passage rate of the internal marker (cut at 3 cm), in particular that of the NDF fraction. One factor affecting the rumen outflow of the internal marker would be the time required to reduce particle size and increase particle density in order to allow escape via the reticulo-omasal orifice (Balch, Reference Balch1971; Welch, Reference Welch1986; Zebeli et al., Reference Zebeli, Tafaj, Weber, Dijkstra, Steingass and Drochner2007). An additional factor of influence is the difference in digestibility between markers. Rinne et al. (Reference Rinne, Huhtanen and Jaakkola1997) observed different passage rates for the indigestible and digestible NDF fractions, indicating that the latter was retained selectively in the rumen. As Cr-NDF is inert and does not undergo fermentative processes, its passage rate could give an overestimation.
In addition, the 13C : 12C ratio associated with the NDF fraction had a considerable but only numerical lower fractional rate of passage from the rumen than for the DM fraction (Table 2; P ⩽ 0.263), and PCT for NDF was numerically delayed (P = 0.371) compared with DM. Thus, when one determines the 13C : 12C ratio in components, it is possible to determine the fractional passage rate for each component that is enriched, provided that the components do not change into another component. This shows that using 13C as an internal marker allows discrimination between the passage behaviour of the DM and NDF fractions, which agrees with the observations of Alexander et al. (Reference Alexander, Bartley and Meyer1969).
Huhtanen and Hristov (Reference Huhtanen and Hristov2001) also observed that 15N-NDF fractional passage rates were higher than those of 15N-ADF. Studies by Tamminga et al. (Reference Tamminga, Robinson, Vogt and Boer1989b), Stefanon et al. (Reference Stefanon, Mills and Piasentier1992) and Huhtanen et al. (Reference Huhtanen, Kaustell and Jaakkola1994) using external markers in conjunction to internal markers have also shown that different feed fractions and markers differ in fractional passage rates from the rumen of cows. Using different cell wall components as internal markers, Tamminga et al. (Reference Tamminga, Robinson, Vogt and Boer1989b) and Huhtanen et al. (Reference Huhtanen, Kaustell and Jaakkola1994) observed considerable differences in rumen fractional outflow rates between indigestible neutral and acid detergent fractions. In contrast, Stefanon et al. (Reference Stefanon, Mills and Piasentier1992) found no differences between cutins and lignin. The aforementioned studies showed that external markers yield higher rates of ruminal passage and are likely to overestimate the fractional passage rate of the feed component under investigation.
As a result of the lower K 1-values of the 13C-NDF compared with 13C-DM, a compartmental retention time (CMRT1) of 62 h was obtained, which was twofold to threefold longer than values reported by Huhtanen and Hristov (Reference Huhtanen and Hristov2001), using 15N-NDF and 15N-ADF. The value for K 2, that is, describing fractional passage from the compartment with the second longest retention time (i.e. the caecum/large intestine), was comparable with observations made by the latter authors, but TT was 1.5 to 2 times longer and PCT was reached at a later time (especially in case of 13C-NDF). Our observations of the CMRT1 for NDF agree with those of the rumen digestible NDF fraction and cellulose digestible ADF fractions reported by Tamminga et al. (Reference Tamminga, Robinson, Vogt and Boer1989b), and with the retention times of the digestible and indigestible NDF fractions observed by Rinne et al. (Reference Rinne, Huhtanen and Jaakkola1997), in studies where dairy cows were receiving grass hay or silage with added concentrates. In both aforementioned studies, the fractional passage rates for the different feed fractions were determined by scaling daily faecal output to the rumen pool size.
When quantifying the amounts of 13C and 12C present in the residues at given time points (derived from Table 3), and determination of the corresponding fractional degradation rates or 13C and 12C (Figure 3 and Table 4) provide further support that discrimination between the C-isotopes at different time points of incubation is negligible. The Kd-values and corresponding approximate standard errors (Table 4) suggest that the fractional degradation rates for 12C and 13C do not differ between isotopes within the DM or NDF fraction. Thus, degradation shows no differences between disappearance of 13C and 12C in the DM or NDF fractions. This implies that degradation has no effect on the integrity of the 13C : 12C ratio of the undegraded residues, and as such adheres to the earlier mentioned criteria for an ideal marker; ‘neither affect nor be affected by the GIT nor by its residing microbial population’. The origin of the decline in δ 13C observed in the current in vitro study can be explained by the relative increase of the ADL fraction remaining in the residues of NDF and DM at increasing incubation times. In contrast to cellulose and hemi-cellulose, ADL is resistant to microbial degradation, which results in an increased proportion of ADL in the residue at prolonged incubation times. Although the ADL residue fractions presented in Table 3 show numerical variations (P ⩾ 0.999), this can be attributed to the sequence of handlings during analyses (in vitro incubation, filtration, boiling in reagent, filtration), and hence ADL can be considered resistant to microbial degradation. The ADL content for GSL and GSH was 30 and 21 g/kg DM, respectively (Table 1). Combining this data with the decreasing NDF fraction during in vitro incubation shows that the proportion of ADL in the NDF residue increased from about 5% to 6% (t = 0 h) to 24% to 30% (t = 72 h). As ADL has a lower δ 13C-enrichment compared with NDF and DM (Table 3), this explained the decline in δ 13C during the first 24 h of incubation.
The current study was specifically designed to evaluate passage kinetics of the undigested 13C-enriched fractions of two silages differing in digestibility. By first principle, the undigested 13C-enriched fractions used in the present study to evaluate passage kinetics meet the four previously mentioned criteria for the use of a marker. The enrichment as measured in fractions of faecal material (undigested DM and NDF), and using the internal marker (13C : 12C ratio) in the faecal fractions prevents absorbability to become a confounding factor. Although the feed DM and NDF fractions can be affected by digestive processes, the undigested faecal NDF fractions measured in the present study are by definition not affected by the GIT or its microorganisms. Moreover, the marker forms an integral component of the fraction under investigation (DM and NDF) and can be analysed without interfering in other analyses. Important additional criteria specific to the internal marker used in the present study are: (1) the distribution of the label in the fraction under investigation, (2) incorporation of 13C in bacterial biomass and subsequent adherence to the faecal fractions and (3) the degradability of the labelled DM and NDF fraction in the feed; the latter two being discussed earlier.
To ensure a uniform distribution of the isotope over the different plant fractions, it is of importance to label the plants frequently during the growing period. Svejcar et al. (Reference Svejcar, Judkins and Boutton1993) enriched alfalfa with 13C for 1 day and harvested the material after 30 days of regrowth. Subsequent rumen incubations showed an increase in δ 13C-enrichment between time t = 0 (δ 13C 15.2 ‰) and t = 11 h (δ 13C 18.0 ‰), followed by a gradual decrease in enrichment at t = 48 and 72 h. Svejcar et al. (Reference Svejcar, Judkins and Boutton1993) explained this pattern in isotopic enrichment by the differential labelling of the alfalfa relative to the time of harvest. Smith and Erdman (Reference Smith and Erdman1986) reported that a labelling regime of four times during the regrowth period was adequate to uniformly distribute the radio isotope 14C over the different plant morphological parts and between the structural and non-structural plant components of alfalfa. In order to reach uniformity of marker distribution, we labelled the grass frequently; six times for GSH and eight times for GSL. The labelling was also more evenly divided throughout the regrowth period, thus trying to circumvent the effects of differential labelling of carbohydrates with regard to different fractions such as NDF and ADL. As discussed earlier, we observed no differences between the degradation kinetic estimations (Table 4, Figure 3) of 12C and 13C in the DM and NDF fraction. This indicates that both 13C and 12C are evenly incorporated into the structural carbohydrate fractions. Hence, our strategy to label grass frequently and evenly divided across the regrowth period under field conditions resulted in an even distribution of 13C throughout the structural carbohydrate fractions.
Conclusions
The in vitro study showed that the 13C : 12C ratio in residual DM and NDF fractions of both silages remained stable from 24 h of incubation onwards. In addition, quantification of the amounts of 13C and 12C present in the residues at successive incubation time points and determination of the corresponding fractional degradation rates, gives further support that discrimination between C isotopes is very small and as such negligible. The fractional degradation rates for 12C are within the same confidence limits as 13C. From this, it is concluded that fermentative degradation has no influence on 13C : 12C ratio of the residue. In the in vivo trial, faecal marker excretion reached its PCT time after about 30 h. Fractional rate constants describing the particle passage from the rumen are estimated from the descending slope of faecal excretion curves. Therefore, this means that the 13C : 12C ratio in DM and NDF of these silages can be used as a marker to estimate passage kinetics from the rumen. 13C-NDF had a considerable longer rumen and total tract retention time than 13C-DM. Our results suggest that the use of 13C as an internal marker appears to be a promising tool in studying feed and feed component-specific passage kinetics in ruminants. As long as the signal of the 13C : 12C ratio in the undigested fractions is strong enough and remains constant throughout digestion time, this approach can be used to determine passage and digestion from dietary DM, NDF and/or other cell wall and non-cell wall components. Depending on the site of sampling in the GIT, it may be required to correct for microbial contamination as some of the 13C marker will be incorporated by the microbes. The incomplete recovery of the 13C in the faecal DM and NDF shows that the fractions under investigation undergo fermentative and digestive processes. This suggests that 13C can be a tool for investigating and quantifying the in vivo relationship between fractional passage and degradation.
Acknowledgements
Part of this work was co-financed by the Dutch Commodity Board of Feedstuffs, which is gratefully acknowledged. The authors acknowledge contributions of the late Drs H. Boer and G. Hof. Drs M. Clauss, D.P. Poppi, and an unknown reviewer are highly acknowledged for their critical views and valuable suggestions to the manuscript. Contributions of Ms J. Cerqueira Lopes, Ms S. Hemmer, Mr F. Jorna, Mr R. Oomen, Mr M. Roordink and Mr S. Uiterwaal, as part of their undergraduate course, are highly appreciated.