1. INTRODUCTION
Laser ablation has a wide field of applications (Godwal et al., Reference Godwal, Taschuk, Lui, Tsui and Fedosejevs2008; Hafeez et al., Reference Hafeez, Shaikh and Baig2008; Lebo et al., Reference Lebo, Lebo, Batani, Dezulian, Benocci, Jafer and Krousky2008; Ozaki et al., Reference Ozaki, Bom and Ganeev2008) and many materials are investigated. We restrict the current research to Zinc oxide (ZnO), which is a very promising material for different technological applications because of its unique optical and electronic properties (Özgur et al., Reference Özgür, Alivov, Liu, Teke, Reshchikov, Doğan, Avrutin, Cho and Morkoç2005). In particular, the wide band gap (3.37 eV) makes it an excellent visible transparent, ultraviolet absorbent material (Chen et al., Reference Chen, Bagnall and Yao2000). Recently, there has been much interest in the growth and optical characteristics of ZnO films for ultraviolet and blue light emitting device applications (Look et al., Reference Look, Claflin, Alivov and Park2004). ZnO films generally exhibit n-type conductivity that can further be improved and stabilized by doping with Aluminum (Al) or Gallium (Ga) (Norton et al., Reference Norton, Heo, Ivill, Ip, Pearton, Chisholm and Steiner2004), while p-type conductivity can be achieved by doping with Phosphorus (P) (Yu et al., Reference Yu, Gong and Wu2005), or Arsenic (As) (Yuen et al., Reference Yuen, Yu, Leong, Lau, Pita, Yang and Chen2007). The high conductivity, together with broad optical transparency, has prompted extensive investigations of ZnO films as transparent electrodes for flat-panel displays (Lee et al., Reference Lee, Lee, Lyu, Zhang, Ruh and Lee2002), thin film transistors (Hoffman et al., Reference Hoffman, Norris and Wager2003), gas sensors (Xu et al., Reference Xu, Liu, Cui, Li and Jiang2006), and solar cells (Gonzalez-Valls & Lira-Cantu, Reference Gonzalez-Valls and Lira-Cantu2009). ZnO films can be grown by radio-frequency sputtering (Özgur et al., Reference Özgür, Teke, Liu, Cho, Morkoç and Everitt2004), metal organic chemical vapor deposition (Ive et al., Reference Ive, Ben-Yaacov, Murai, Asamizu, Van de Walle, Mishra, Den Baars and Speck2007), spray pyrolysis (Alver et al., Reference Alver, Kılınç, Bacaksız, Küçükömeroğlu, Nezir, Mutlu and Aslan2007), molecular beam epitaxy (Ogata et al., Reference Ogata, Koike, Sasa, Inoue and Yano2009), and pulsed laser deposition (Claeyssens et al., Reference Claeyssens, Freeman, Allan, Sun, Ashfold and Harding2005; Kawakami et al., Reference Kawakami, Hartanto, Nakata and Okada2003). In contrast to the extensive literature relating to ZnO films produced by pulsed laser deposition, relatively little effort has been directed toward characterization of the ablation plume from which such films are produced (Claeyssens et al., Reference Claeyssens, Cheesman, Henley and Ashfold2002; Namba et al., Reference Namba, Nozu, Takiyama and Oda2006; Ozerov et al., Reference Ozerov, Bulgakov, Nelson, Castell and Marine2005; Ohshima et al., Reference Ohshima, Thareja, Yamagata, Ikegami and Ebihara2001), and its effect on the properties of ZnO thin films, With the aim to investigate the laser-induced plasma and the probable role of gas-phase reactions in ZnO formation, a detailed study of the dynamics of the chemical species produced by laser ablation of ZnO targets in an oxygen environment has been undertaken. The properties of the created plume are investigated by acquiring its emission spectra at different positions from the target surface in presence of oxygen gas pressures in the range of 10−5 mbar to 102 mbar. Analysis of these data provides information on the nature of the ejected particles, their density, and temperature in the vicinity of the target surface. An attempt is made to correlate the characteristics of the ZnO thin films deposited by laser ablation with the properties of laser induced plasma.
2. EXPERIMENTAL SETUP
Detailed experimental setup for the recording of plasma emission spectra and spatio-temporal variations of emitted species is mentioned elsewhere (Shukla & Khare, Reference Shukla and Khare2009). Briefly, a second harmonic of Nd:YAG laser (~240 mJ/pulse) with 8 ns pulse width was used to ablate sintered ZnO pellets in O2 ambient. The emitted ZnO plasma was imaged on a monochromator (SPEX 750M) fitted with photomultiplier tube, interfaced with computer and recorded in the wavelength range of 300–850 nm. This data was used to estimate the electron temperature and density as a function of the background gas pressure and distance from the target surface. The laser ablated ZnO plasma, consisting of ions and neutrals of Zn and O, expands in the background of oxygen, undergoes the reaction dynamics, and is finally deposited onto ultrasonically cleaned Si(100) substrates placed 3 cm apart from the ZnO target. All the films were deposited at room temperature and in O2 ambient, for a deposition time of 30 min. To find the correlation between the quality of thin films with the deposition parameters, ZnO thin films were subjected to X-ray diffractometer (Seifert), scanning electron microscope (Leo 1430 vp), energy dispersive analysis (Oxford Instruments), and Photoluminescence spectrometer (Themo-spectronic Aminco Bowman Series 2) with Xe lamp as excitation source.
3. EMISSION SPECTROSCOPY AND CALCULATION OF PLASMA PARAMETERS
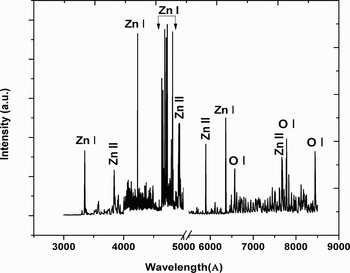
Figure 1 shows the wavelength dispersed emission spectrum of the plume accompanying the ablation of the ZnO target in 0.1 mbar O2 pressure and recorded at a distance of 5 mm from the target surface. The strong emission lines of Zn I, Zn II, and O I were identified and marked in Figure 1. These lines were used to estimate the electron number density and electron temperature, the two important parameters to understand the dynamics of laser induced plasma. The electron number density is estimated from the full width at half maximum, Δλ1/2, of the stark broadened lines, given by Eq. (1) (Griem, Reference Griem1964),
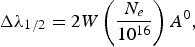
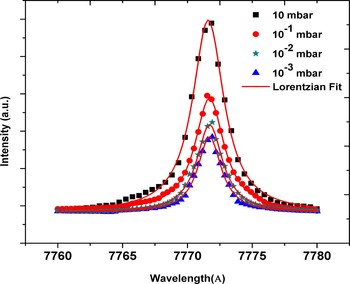
where N e is the electron density in cm−3, and W is the electron impact parameter that is independent of electron density, but at the same time a slowly varying functions of electron temperature. The emission line of O I at 777.19 nm was used for the calculations of the electron density. Since the value of electron impact parameter W is not temperature sensitive (it varies less than 30% in the range of 5000 K to 10,000 K based on the data listed in NIST, 2005), its value at 8000 K has been used for electron density calculations (Griem, Reference Griem1964). Figure 2 shows the broadened spectral profiles of O I (777.1 nm) line at different ambient pressures measured at a distance of 5 mm from the target surface, and fitted with Lorentzian profile.
Emission spectra of laser ablated ZnO plasma in 0.1 mbar oxygen ambient at a distance of 5 mm from the target surface.

(Color online) Stark broadened profile of O I (777.1 nm) spectral line at different pressures.

The electron temperature was estimated by using Saha-Boltzmann equation (Griem, Reference Griem1964; Bekefi, Reference Bekefi1976),

where the primed symbols represent the lines of ions with higher ionization stage and unprimed symbols represent that of successive lower stage, f is the oscillator strength, g is the statistical weight, a 0 is the Bohr radius, E H is the ionization energy of the hydrogen atom, E is the excitation energy, and ΔE ∞ is the correction to the ionization energy E ∞ of the lower ionization stage due to plasma interactions. For temperature calculations, the line intensities corresponding to emission lines of 481.0 and 491.16 nm, respectively, of Zn I and Zn II have been used. The optical data required for the above calculations were taken from the literature and standard database (Griem, Reference Griem1964; NIST, xxxx).
4. RESULTS AND DISCUSSION
4.1. Investigations of the ZnO target
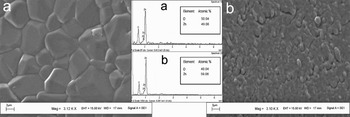
The sintered polycrystalline disk shaped pellet was used as the target in the present work. The surface of the pellet was insulating and pale yellow in color. After laser irradiation in 10−5 mbar O2 pressure, the ZnO target surface became gray in color and conducting, both within the focal region as well as its immediate surroundings. Figure 3 shows the scanning electron microscope images of the (1) virgin ZnO target surface and (2) ZnO target surface in the surroundings of the focal region after laser irradiation. Scanning electron microscope images clearly show that crystalline structure of ZnO target surface changed into ripples and semi spherical droplet like structure upon laser irradiation due to local heating, melting, and ablation of photoexcited region. From Energy Dispersive X-ray analysis, it was observed that the laser irradiated ZnO target surface exhibit a Zn:O ratio that is higher than that in the virgin ZnO target, suggesting formation of a Zn-rich top layer upon irradiation, probably due to back-deposition of sputtered zinc from the ablation plume itself. This observation suggests the requirement of optimum background gas pressure of O2 during the pulsed laser deposition of crystalline and stoichiometric ZnO thin films in order to interact with, and compensate for, the excess Zn in the laser ablated plume.
SEM and EDX spectra of (a) virgin ZnO target (b) ablated ZnO target in the surroundings of the focal region.

4.2. Spatial and Pressure Dependence of the Plasma Parameters
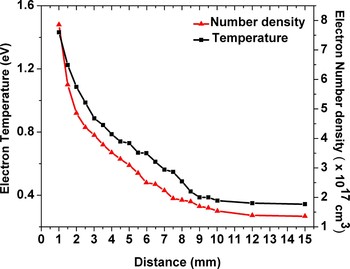
The line shape analysis of different species was performed as a function of distance from the target surface and the background pressure for the estimation of plasma parameters. The estimation of electron temperature and electron density of the plasma plume was carried out for distances up to 10 mm from the target surface. The spatial dependence of electron temperature and electron density of the plume at 10−1 mbar O2 pressure is shown in Figure 4. The temperature and density of electrons exhibited a decreasing behavior with distance. With increasing distance from the target surface, the electron temperature falls down exponentially (Harilal et al., Reference Harilal, O'Shay, Tao and Tillack2006; Ying et al., Reference Ying, Xia, Sun, Zhao, Ma, Liu, Li and Hou2003) from 1.43 eV at 1 mm to 0.36 eV at 10 mm. Beyond 10 mm distance, the electron temperature is almost constant. Electron density decreases from 5.4 × 1017 cm−3 to 1.1 × 1017 cm−3 over a distance of 10 mm from the target surface, and there after it is nearly stabilized. Initially, when the laser pulse strikes a solid surface, ions and excited neutral atoms are emitted during the laser pulse. The free electrons in the rapidly expanding plasma, in the initial phase, grow by multiphoton ionization. When a high electron concentration approaches a critical electron density, the further growth is slowed down by the onset of electron-ion recombination process, along with the rapid cooling of plasma due to expansion.
(Color online) Variation of electron temperature and electron number density with distance at 10−1 mbar O2 pressure.

At larger distances, the free expansion of the plasma plume is curtailed because of the presence of surrounding gas as well as adiabatic cooling (Zel'dovich & Raizer, Reference Zel'dovich and Raizer1966; Trusso et al., Reference Trusso, Barletta, Barreca, Fazio and Neri2005; Fazio et al., Reference Fazio, Neri, Ossi, Santo and Trusso2009) resulting into redistribution of kinetic and thermal energy and particle flux (Beilis, Reference Beilis2007; Arnold et al., Reference Arnold, Gruber and Heitz1999), which finally stabilizes the electron temperature and the electron density to certain extent beyond 8–10 mm distance from the target, as shown in Figure 4.
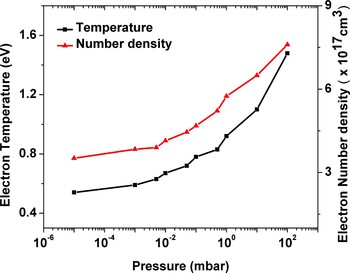
Figure 5 shows the variation of electron density and electron temperature with ambient pressure at 5 mm distance from target surface. Under vacuum and at low background pressures (<10−2 mbar), the expansion (as well as cooling) of the plasma is like a free expansion. Hence, little away from the target, the electron temperature and density are small compared to corresponding values at relatively higher pressures in the range of 1 mbar–100 mbar. At higher pressures, plasma expansion is suppressed due to the presence of high O2 pressure. Thus, the electron temperature and density decreases at lower background pressures, slightly away from the target surface as shown in Figure 5.
(Color online) Variation of electron temperature and electron number density with O2 pressure at a distance of 5 mm from the target.

The integrated emission intensity of Zn II (491.1 nm), Zn I (636.6 nm), and O I line (777.1 nm) at 0.1 mbar O2 pressure as a function of distance from the target surface is shown in the Figure 6. The integrated yield was obtained by integrating the area under the emission profile of the particular lines under consideration. This gives a measure of the amount of excited species within the plume, arriving at a given point. The integrated intensity of O I emission generated during the ZnO ablation shows steady increase up to 12 mm distance from the target, and then a monotonic decrease with further increase in distance. This is due to the increase in the excitation of oxygen atoms as well as dissociation of oxygen molecules by the collisions with the particles in the plume in the neighborhood of the target surface. While in the later stage, due to plasma expansion, the collision probability decreases, hence release of oxygen atoms reduce and results in to small O I intensity. As shown in Figure 6, intensity of Zn II ions increases initially with distance from the target surface due to dissociation of ZnO molecules at high electron temperatures. With further expansion, at larger distances (>5 mm), reduction in plasma temperature and density favors the recombination of Zn II ions with electron to form Zn neutrals. Therefore, the intensity of Zn II emissions start decreasing beyond 5 mm distance where that of Zn I continues to increase until ~10 mm, and then falls down due to the further expansion and probably formation of ZnO back. Due to high density of Zn ions near the target surface, ZnO thin films with 1:1 stoichiometry cannot be obtained at very small target to substrate distances. This is also confirmed by target composition measurements after laser irradiation shown in Figure 3.
(Color online) Variation of Zn I, Zn II and O I integrated intensities with distance at 10−1 mbar O2 pressure.

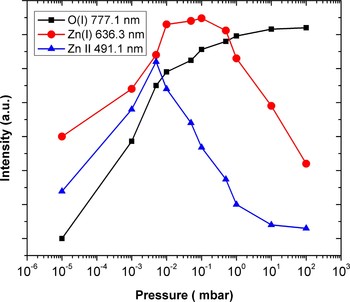
Figure 7 shows the variation of Zn I, Zn II, and O I integrated intensity with O2 pressure at 10 mm distance from the target surface. It can be observed that the increase in oxygen pressure increases the emission intensity of O I line. In the absence of ambient gas, oxygen line intensities were found to be very small and insensitive to distance variations. Increase in oxygen pressure enhances the emission line intensities of the neutral Zn and neutral oxygen, while the emission line intensities of Zn ions decrease after 5 × 10⁻² mbar O2 pressure. This could be attributed to the fact that increase in pressure will decrease the mean free path of particles in the plume, thereby increasing the probability of collision of Zn ions with electrons in the plume. This enhances the rate of electron-ion recombination, leading to the increase in the number of excited neutral zinc atoms. Zn I line intensity was found to exhibit a steady behavior in the pressure range of 5 × 10⁻² mbar to 5 × 10⁻¹ mbar. In the same pressure range, sharp decrease in Zn ions intensity can be observed. This indicates that recombinative generation of excited Zn neutrals efficiently compensates for their loss due to plasma expansion in this pressure range. Also at very low O2 pressures (<10−3 mbar) intensity of Zn ions is large and intensity of oxygen neutrals is very small (Fig. 7), indicating stochiometric ZnO can not be obtained at very low ambient pressures, in agreement with the previous observations of other researcher's (Claeyssens et al., Reference Claeyssens, Cheesman, Henley and Ashfold2002).
(Color online) Variation of Zn I, Zn II and O I integrated intensities with O2 pressure at 10 mm from the target surface.

4.3. PLD of ZnO Thin Films and Correlation with Plasma Parameters
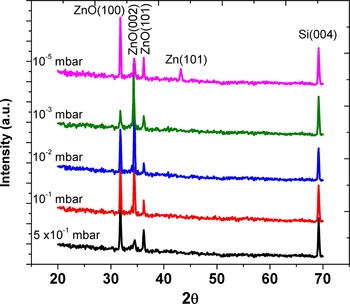
Figure 8 shows X-ray diffraction spectra of ZnO thin films deposited on to Si (100) substrates at different O2 pressures ranging from 10−5 mbar to 10 mbar, at a distance of 3 cm from the target using pulsed laser deposition technique. It has been observed that at high O2 pressures (>10−1 mbar), deposition of polycrystalline ZnO films take place with relatively low c-axis orientation. With decrease in O2 pressure intensity of ZnO (002) peak increases and at 10−3 mbar O2 pressure highest ZnO (002) peak intensity can be observed, indicating deposition of highly c-axis oriented ZnO films. At very low O2 pressures (~10−5 mbar), metallic Zn peaks has been also observed. This behavior indicates Zn rich nature of plume at low O2 pressures that was also confirmed by spectroscopic measurements as discussed earlier.
(Color online) XRD spectra of ZnO thin films deposited at different O2 pressures.

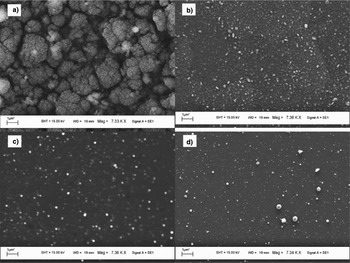
Figure 9 shows scanning electron microscope images of ZnO thin films deposited at different O2 ambient pressures in the range of 10−5 mbar to 10−1 mbar. The average grain size increases at high O2 pressures (≥10−1mbar) as well as very low O2 pressures (<10−3 mbar). This behavior can be attributed to clustering of vapor phase particles at high O2 pressure and high atom energies at very low O2 pressures (Shukla & Khare, Reference Shukla and Khare2009). Thus, an optimum value of O2 pressure in the range of 10−3 mbar to 10−1 mbar has been suggested to make smooth cluster free ZnO films.
SEM images ZnO thin films deposited at (a) 5 × 10⁻¹ mbar, (b) 10−2 mbar, (c) 10−3 mbar, and (d) 10−5 mbar O2 pressure.

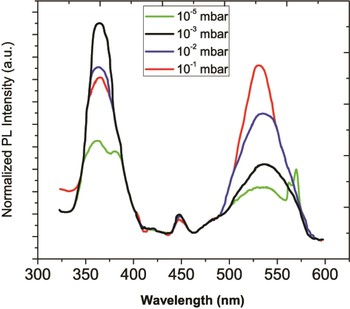
Figure 10 shows the PL spectra of the ZnO films deposited at different ambient pressures. The excitation wavelength used was 300 nm from Xe lamp source. It can be observed that with increasing O2 pressure, there was a considerable increase in defect related green band emission as compared to band edge ultraviolet emission. The excess oxygen at high pressures (confirmed by increased intensity of O I line) may replace zinc atoms in the crystal lattice and form a defect state known as OZn. Also, for ZnO films deposited at low O2 pressures, band edge ultraviolet emission intensity decreases, most probably because of Zn-rich nature of deposited films and formation of metallic Zn as confirmed by X-ray diffraction measurements shown in Figure 8.
(Color online) PL spectra of ZnO thin films deposited at different O2 pressures.

The steady behavior of electron density, electron temperature and integral intensities of Zn and Zn ions, and high oxygen line intensities above 10 mm distance from the target surface suggest that high quality ZnO thin films can be expected when substrate is placed beyond this distance. The reports show that stoichiometric and crystalline films are formed at a few centimeters away from the target surface (Ohtomo & Tsukazaki, Reference Ohtomo and Tsukazaki2005). Even at relatively low laser intensities, near the threshold for ablation, it has been observed that the ablated materials are significantly ionized (Hansen et al., Reference Hansen, Schou and Lunney1997; Kasperczuk et al., Reference Kasperczuk, Pisarczyk, Borodziuk, Ullischmied, Krousky, Masek, Pfeifer, Rohlena, Skala and Pisarczyk2007; Thareja & Sharma, Reference Thareja and Sharma2006), and the ions in the plasma plume can have energies ranging up to several hundred eV (Hansen & Schou, Reference Hansen and Schou1998). Hence, at small target to substrate separation, there is a chance of sputtering from the substrate by these highly energetic particles and thereby affecting the quality of the thin film. Therefore, for proper nucleation and adherence, and thereby for the formation of crystalline thin films, larger target to substrate distance and heating of substrate are suggested.
5. CONCLUSION
In this paper, we have reported optical emission spectroscopic investigations of ZnO plasma during pulsed laser deposition of ZnO thin films in O2 ambient. The dependence on electron temperature and electron number density for ZnO plasma as a function of distance from the target surface and ambient O 2 pressure was studied. Structural and optical characterizations of ZnO thin films revealed that at very low O2 pressures deposition of non-stochiometric and polycrystalline thin films with Zn clusters takes place supporting the observations from spectroscopic measurements. Increase in OZn defect band intensity and decrease in ZnO (002) peak intensity at high O2 pressures (>10−1 mbar) and large grain sizes indicated deposition of non-stochiometric and poor-quality poly crystalline ZnO thin films. An optimum value of O2 pressure in the range of 10−3 mbar to 10−1 mbar and target substrate distance more than 20 mm has been suggested to make smooth cluster free stochiometric ZnO films.
ACKNOWLEDGMENT
This work is partially supported by Department of Science and Technology (DST) India, Project No. SR/S2/HEP-19/2008.