Introduction
A variety of experimental and simulation techniques have been used to investigate the structure of glasses and glass-forming liquids. Such studies have aimed to make a connection between the atomic-scale glass or liquid structure and macroscopic properties such as viscosity, fragility, and optical characteristics. Much of this research has concentrated on commercially important systems, such as silicates and borosilicates, while less conventional glass systems have received considerably less attention. One such class of glasses form over narrow compositional ranges in nitrate, sulfate, and carbonate systems, where the process of vitrification itself remains poorly understood. Certain compositions in these dominantly ionic systems can form so-called fragile liquids even though the glass-forming ability is generally assumed to be poor because of a supercooled liquid structure that is temperature-dependent and is expected to change during the process of glass formation. The absence of covalent network structures may also play a role [Reference Angell1].
In a series of related studies on the structure of molten salts, including nitrates, sulfates, and carbonates, combining high-energy X-ray diffraction experiments and molecular dynamics simulations indicate that the structure and dynamics of molten salt systems are influenced by the emergence of secondary length scales, implying some linkage between the anionic groups [Reference Wilding, Wilson, Alderman, Benmore, Weber, Parise, Tamalonis and Skinner2, Reference Wilding, Wilson, Ribeiro, Benmore, Weber, Alderman, Tamalonis and Parise3, Reference Wilson, Ribeiro, Wilding, Benmore, Weber, Alderman, Tamalonis and Parise4]. In the case of carbonates, networks and other complex structures are formed from the molecular anion, the extent of which depends on temperature [Reference Wilding, Wilson, Alderman, Benmore, Weber, Parise, Tamalonis and Skinner2, Reference Wilson, Ribeiro, Wilding, Benmore, Weber, Alderman, Tamalonis and Parise4]. Properties such as diffusion and, by extension, viscosity are dependent on the length of these carbonate network chains. These studies have shown how the structures within carbonates and other molten salt liquids differ from those assumed from ionic liquid behavior. Significantly, it has been shown that the experimentally observed configurations for carbonates are best reproduced by simulations that allow molecular anions to be treated as flexible rather than rigid structures with the carbon atom moving out of the planar trigonal geometry, allowing a second C–O bond length to emerge as the carbon atom forms a weak linkage to oxygen atoms of other carbonate groups, i.e., a network. Unfortunately, the ionic melt systems studied so far are not glass-forming under practically accessible cooling rates, so there is currently no direct link between the emergence of the secondary length scale and the formation of a glass-forming mechanism. While the rapid crystallization kinetics in most carbonate liquids limit the degree of supercooling of carbonate melts and largely prevent vitrification, there are a few carbonate compositions that are known to form glass [Reference Genge, Jones and Price5] which can be used to evaluate the development and extent of the proposed low-dimensional structures. In addition, a biogenic form of amorphous calcium carbonate (ACC) also provides a useful structural comparison [Reference Sen, Kaseman, Colas, Jacob and Clark6]. In this contribution, we present combined thermochemical and NMR spectroscopic studies of one such carbonate glass composition in the K2CO3–MgCO3 system to determine which mechanism might be responsible for its glass-forming ability.
The formation of glass in the system K2CO3–MgCO3 was reported by Eitel and Skaliks in 1929 [Reference Eitel and Skaliks7]; although this was a passing observation and has, with a few exceptions [Reference Genge, Jones and Price8, Reference Genge, Price and Jones9, Reference Dobson, Jones, Rabe, Sekine, Kurita, Taniguchi, Kondo, Kato, Shimomura and Urakawa10], received little attention since. Glass in this system can be quenched successfully above a deep eutectic region at a molar K2CO3/MgCO3 ratio of ∼55:45 and at a pressure of ∼50 MPa [Reference Ragone, Datta, Roy and Tuttle11, Reference Datta, Roy, Faile and Tuttle12]. The elevated pressure is believed to prevent the carbonate from decomposing. Carbonates, along with other ionic glass formers, such as sulfates [Reference Forland and Weyl13, Reference MacFarlane14] and nitrates [Reference van Uitert and Grodkiewicz15], lack conventional network-formers such as silicate tetrahedra, and there is considerable speculation about how these exotic glasses form. In theory, the ionic nature of the carbonate anion should be dictated by the electronic structure in which all the “bonding” oxygen orbitals are incorporated into C–O pπ and sσ bonds, leaving none for covalent interactions. As such, they should not form the covalently bonded polymerized network usually associated with glass formation [Reference Jones, Genge, Carmody, Hazen, Jones and Baross16]. Spectroscopic studies of the K2CO3–MgCO3 glass [Reference Genge, Jones and Price8, Reference Genge, Price and Jones9, Reference Sharma and Simons17] indicate the presence of two structurally distinct populations of carbonate anions. Genge et al. [Reference Genge, Jones and Price8] suggest that the more symmetrical units form a flexible network that comprises carbonate anions with bridging, strongly interacting metal cations (here Mg2+), while nonbridging species (here K+) modify the network and are associated with distorted carbonate groups. It has also been suggested that glass formation in sulfate and nitrate systems requires the presence of two different cations with different field strengths and different degrees of polarization [Reference Forland and Weyl13, Reference MacFarlane14, Reference van Uitert and Grodkiewicz15]. Our proposed structure of K2CO3–MgCO3 glass is significantly more complicated than simple ionic molten salt models would predict and is also defined by the flexibility of the molecular anion.
As has been demonstrated for alkali carbonate and nitrate liquids, molecular dynamics simulations using the flexible anion approach provide a means for exploring parameter space, for example, in the case of Na2CO3, we are able to identify the development of complicated, low dimensional structures that have temperature dependence. Since carbonate liquids are important agents of geochemical transport and have a substantive role in deep Earth processes, pressure is an important state variable and in part motivates this study. High pressure and high temperature studies of carbonate and indeed other liquids are challenging, and it is common to use glasses to evaluate the influence of pressure. Carbonate glass is therefore suitable for such an ambient temperature, high pressure study, and the 55K2CO3–45MgCO3 glass is the focus of a related ultra-high–pressure study using energy-dispersive diffraction techniques and requires an understanding of the structure and structure-dependent properties of the glass at ambient pressure. There are significant changes within the glass structure with increasing pressure, and based on the success of the combined HEXRD and MD modeling of carbonate liquids and other molten salts using a flexible anion approach [Reference Wilding, Wilson, Alderman, Benmore, Weber, Parise, Tamalonis and Skinner2, Reference Wilding, Wilson, Ribeiro, Benmore, Weber, Alderman, Tamalonis and Parise3, Reference Wilson, Ribeiro, Wilding, Benmore, Weber, Alderman, Tamalonis and Parise4], we can identify the structural trends by simulating the liquid structures at different densities. The trigonal geometry of the carbonate anion is imposed using harmonic springs that act between O–O and C–O pairs. This flexibility is clearly important in determining the observed ‘liquid’ structure and reproduces the pressure-dependent changes; and although the changes in the diffraction pattern are dominated by K–K, K–O, and O–O atom pairs, these changes are themselves indicative of associated changes in the underlying structure of the carbonate anions. The relationship between the K+ cations and the carbonate anions is characterized by structures that result from the strong electrostatic interactions between the oxygen ions in the carbonates and K+ cations, which result in preferential formation of close CO3 pairs and the emergence of a second C–O length-scale at 2.4 Å with increasing pressure. This represents the development of the CO3+1 structure which is heading toward CO4, but the flexible carbon forms a weaker, longer bond with oxygen of another group. The pressure-induced linkage in 55K2CO3–45MgCO3 glass represents the development of a carbonate ‘network’ similar to that observed in Na2CO3 melts at ambient pressure and has profound implications for melt properties such as viscosity. The simulations suggest a relatively little change in the partial contributions from the Mg2+ cations in either the reciprocal or real space: the Mg–O partial functions remain effectively independent of pressure. This is inconsistent with the model of Genge et al. (1995) [Reference Genge, Jones and Price8] which has a modified polymerized network with Mg2+ acting as a “bridging species” and K+ ions act as a “modifier species”.
The formation of glass in this system is not well understood, and the underlying structural information and accompanying simulation indicate that the flexibility of the carbonate anion is a key in controlling the glass-forming ability. In this study, we examine further the energetic and structural basis for glass formation in this system by determining the heat of formation of the glass using solution calorimetry, accompanied by 13C NMR and infrared spectroscopy studies that reveal the local environment of carbon and the degree of distortion of the carbonate anion. These experimental data are combined with the molecular dynamics simulations.
Results and discussion
Infrared spectroscopy
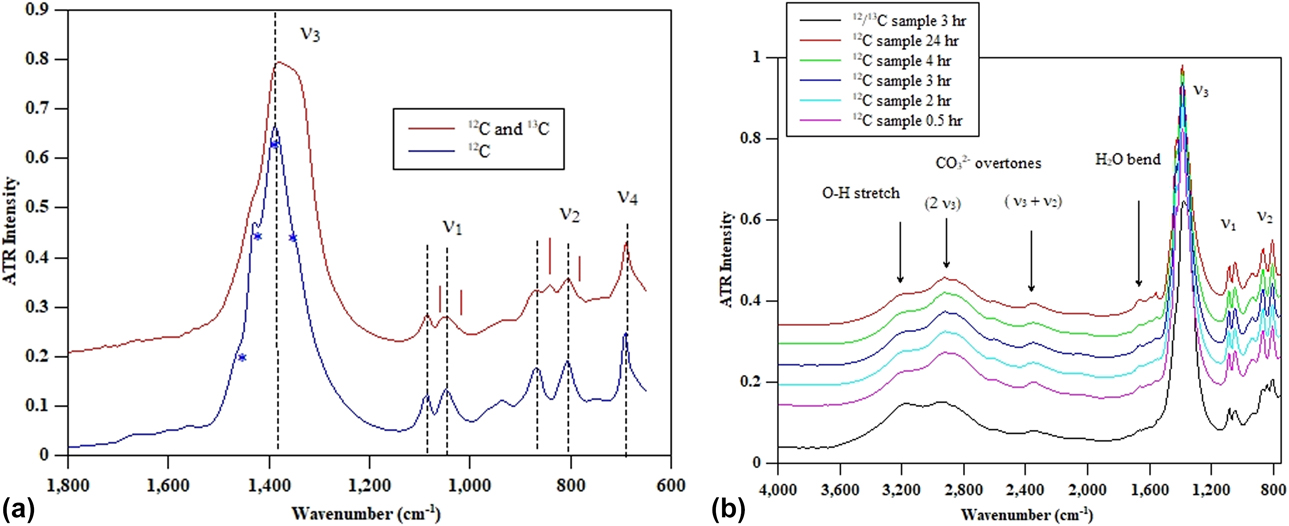
Attenuated total reflectance (ATR) infrared spectroscopy data were collected on two glass samples synthesized using high pressure techniques. One sample was made using reagent grade K2CO3 and magnesite as starting materials, and the second sample was 13C enriched and made using the K213CO3 starting material (5 wt% of the sample is 13C). These spectra are shown in Fig. 1. The use of ATR allows better resolved and more complete absorbance spectra for the fundamental internal vibrational mode of the carbonate groups, compared with that of Genge et al. [Reference Genge, Jones and Price5], allowing a better assignment of peaks. There are clearly two distinct ν1 symmetric stretching and two ν2 out-of-plane bending peaks. This strongly suggests that there are two distinct carbonate groups present. The degeneracy of the two ν3a and ν3b asymmetric stretch modes appears to be lifted to produce doublets, with the two carbonate types then producing 4 peaks.
(a) FTIR absorbance spectra taken using micro-ATR. The 12C sample has two peaks assigned to ν1 symmetric stretching at 1049 and 1088 cm−1 and two peaks assigned to ν2 out-of-plane bending at 806 and 870 cm−1. Only one ν4 in-plane bend peak is seen at 691 cm−1, but the detector response may have cut off a second peak at a lower wavenumber. The ν3 asymmetric stretch is more complex, but can be fitted with 4 peaks representing two doublets. ν3 are approximately at 1340, 1377, 1395, and 1431 cm−1. In the upper spectra, the approximate magnitude of the isotopic shift related to 13C is indicated by vertical ticks. The 13C peaks are marked with an asterisk. (b) The glasses do not change their water content in the first 24 h. However, it should be noted that they eventually turn to a white powder within 3–4 weeks. The peak at 3200 cm−1 is assumed to represent O–H stretching, but has a lower frequency than observed in silicate glasses.
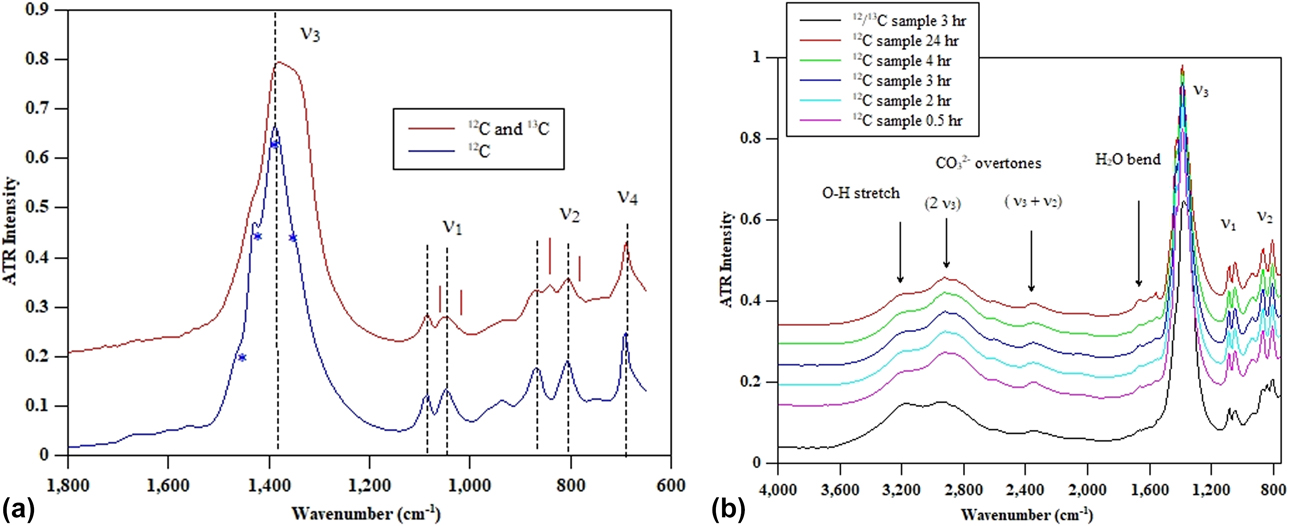
The lifting of degeneracy implies some distortion with the 3 oxygen atoms of the carbonate groups experiencing different environments for both the carbonates. The ν4 in-plane bend region is cut off by the detector, but the Raman spectrum for this glass shows a complex peak envelope in the 680- to 720-cm−1 region.
Deterioration of glass due to the presence of water introduced during high pressure synthesis is a persistent problem, and these glasses are known to be hygroscopic, and the presence of O–H at high frequencies has been reported by Genge et al. In Fig. 1(b), the progressive hydration of the glass is shown for both 12C- and 13C-enriched samples. Note that for the 13C sample (for NMR), there is more water present possibly because the starting materials may not have been perfectly dried. While water is undoubtedly present, there is no evidence that the water content changes over the course of 24 h. Over the course of several weeks, the samples deteriorated, even when stored in a desiccator, and the appearance changes from that of the transparent pristine glass to an opaque white powder. However, we assume for the calorimetry, NMR, and diffraction experiments that although there is water introduced during the high pressure synthesis, the degree of hydration does not change over the course of measurement.
Thermochemistry
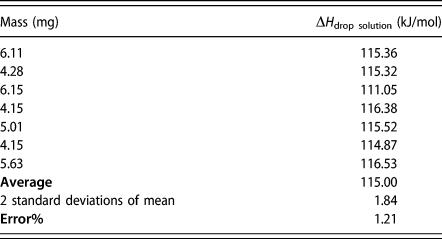
The calorimetric data are summarized in Table I. The average heat of solution for seven pellets of the 0.55K2CO3·0.45MgCO3 glass is 115.00 ± 1.21 kJ/mol. To calculate the enthalpy of formation of the glass, not only is the heat of drop solution for the glass samples required but also the heat of drop solution of the component oxides. These values are obtained from literature, and the following thermochemical cycle is used to calculate the enthalpy of formation of the 0.55K2CO3–0.45MgCO3 glass. The measured heat of drop solution (kJ/mol) obtained from the calorimetry experiment is associated with the following reaction:
 $$\eqalign{0.55{{\rm{K}}_2}{\rm{C}}{{\rm{O}}_3} \cdot 0.45{\rm{MgC}}{{\rm{O}}_3}_{\left( {{\rm{s}},298\;{\rm{K}}} \right)} \to 0.57{{\rm{K}}_{\rm{2}}}{{\rm{O}}_{\left( {{\rm{sol}},975\;{\rm{K}}} \right)}} \cr+ 0.43{\rm{Mg}}{{\rm{O}}_{\left( {{\rm{sol}},975\;{\rm{K}}} \right)}} + {\rm{C}}{{\rm{O}}_2}_{\left( {{\rm{g}},975\;{\rm{K}}} \right)}\quad ,$$
 $$\Delta {H_{{\rm{drop}}\;{\rm{solution}},975\;{\rm{K}}}} = \Delta {H_1} = 115.00\; \pm \;1.21\;\left( {{{{\rm{kJ}}} / {{\rm{mol}}}}} \right)\quad .$$
Enthalpy of drop solution of 0.55K2CO3–0.45MgCO3 glass at 975 K.

The values for the heat of drop solution of K2O and MgO [Reference Navrotsky18, Reference Sahu, Boatner and Navrotsky19] are
 $$\eqalign{{{\rm{K}}_{\rm{2}}}{{\rm{O}}_{\left( {{\rm{s}},298\;{\rm{K}}} \right)}} \to {{\rm{K}}_{\rm{2}}}{{\rm{O}}_{\left( {{\rm{sol}},975\;{\rm{K}}} \right)}} = - 319.60\; \pm \;4.70 \cr= \Delta {H_2}\;\left( {{{{\rm{kJ}}} / {{\rm{mol}}}}} \right)\quad ,$$
 $$\eqalign{{\rm{Mg}}{{\rm{O}}_{\left( {{\rm{s}},298\;{\rm{K}}} \right)}} \to {\rm{Mg}}{{\rm{O}}_{\left( {{\rm{sol}},975\;{\rm{K}}} \right)}} = - 5.34\; \pm \;0.26 \cr= \Delta {H_3}\;\left( {{{{\rm{kJ}}} / {{\rm{mol}}}}} \right)\quad .$$
The value for CO2 gas is obtained from tabulated heat capacity values [Reference Shivaramaiah and Navrotsky20],
 $${\rm{C}}{{\rm{O}}_2}_{\left( {{\rm{g}},298\;{\rm{K}}} \right)} \to {\rm{C}}{{\rm{O}}_2}_{\left( {{\rm{g}},975\;{\rm{K}}} \right)} = 32.07 = \Delta {H_4}\;\left( {{{{\rm{kJ}}} / {{\rm{mol}}}}} \right)\quad .$$
So the enthalpy of formation of the 0.55K2CO3·0.45MgCO3 glass from oxides is calculated from
 $$\eqalign{\Delta {H_{{\rm{f,298}}\;{\rm{K}}}} = - \Delta {H_1} + \left( {0.55\Delta {H_2} + 0.45\Delta {H_3} + \Delta {H_4}} \right) \cr= - 261.12\; \pm \;3.02\;\left( {{{{\rm{kJ}}} / {{\rm{mol}}}}} \right)\quad .$$
This value can be compared with the enthalpy of formation of the end-member carbonates determined from the following thermochemical cycle using the literature values for the enthalpy of formation of carbonates [Reference Chai and Navrotsky21, Reference Kiseleva, Navrotsky, Belitsky and Fursenko22, Reference Navrotsky, Putnam, Winbo and Rosen23].
 $$\eqalign{{{\rm{K}}_{\rm{2}}}{\rm{O}} + {\rm{C}}{{\rm{O}}_2}_{\left( {{\rm{g,298}}\;{\rm{K}}} \right)} \to {{\rm{K}}_{\rm{2}}}{\rm{C}}{{\rm{O}}_3}_{\left( {{\rm{s,298}}\;{\rm{K}}} \right)} = - 396.02\; \pm \;1.56 \cr= \Delta {H_5}\;\left( {{{{\rm{kJ}}} / {{\rm{mol}}}}} \right)\quad ,$$
 $$\eqalign{{\rm{MgO}} + {\rm{C}}{{\rm{O}}_2}_{\left( {{\rm{g,298}}\;{\rm{K}}} \right)} \to {\rm{MgC}}{{\rm{O}}_3}_{\left( {{\rm{s,298}}\;{\rm{K}}} \right)} = - 117.04\; \pm \;0.94 \cr= \Delta {H_6}\;\left( {{{{\rm{kJ}}} / {{\rm{mol}}}}} \right)\quad ,$$
 $$\eqalign{\Delta {H_{\left( {{\rm{f}},298\;{\rm{K}}} \right)}} = 0.55\Delta {H_5} + 0.45\Delta {H_6} \cr= - 270.06\; \pm \;1.81\;\left( {{{{\rm{kJ}}} / {{\rm{mol}}}}} \right)\quad .$$
These results indicate that the glass is only slightly metastable in enthalpy by +9.36 ± 1.95 kJ/mol relative to the end-members. This destabilization, which can be considered an effective vitrification enthalpy is rather small compared with typical heats of vitrification of other materials, although no data are available for potassium and magnesium carbonates, which are not glass-forming. This small enthalpy is consistent with the relative ease of glass formation in this composition and the absence of vitrification in the end-members. The configurational entropy arising from the mixing of K+ and Mg2+ ions in the glass may be sufficient to stabilize the glass under these synthesis conditions. For one mole of carbonate there are 1.55 moles of cations, and assuming random mixing, the configurational entropy is given as follows.
 $$\eqalign{{S_{{\rm{conf}}}} = - 1.55R\left( {x\;\ln \;x + \left( {1 - x} \right)\ln \left( {1 - x} \right)} \right) \cr= 7.76\left( {{{\rm{J}} / {{\rm{mol}}\;{\rm{K}}}}} \right) \quad,$$
where x is the mole fraction of potassium ions equal to 1.10/1.55 = 0.71. At the synthesis temperature of 1053 K, the TΔS term (TS conf) would be 8.2 kJ/mol which is enough to compensate the enthalpic instability obtained by calorimetry. Thus we conclude that the glass may indeed be stable in free energy compared with a mixture of the crystalline end-members. We noted that the calculated configurational entropy represents a maximum value for random mixing, so the actual configurational entropy contribution may be somewhat smaller.
However the distortions of the carbonate polyhedra may also contribute to the enthalpy and entropy terms. The main point of the aforementioned argument is that the energetic destabilization of the ternary carbonate glass relative to binary crystalline carbonate end-members is very small and can be compensated by entropy terms arising from several types of disorder. Such thermodynamic behavior is not uncommon in ternary oxide systems showing strong acid–base interactions. For example, a glass of diopside (CaMgSi2O6) composition is stable in both enthalpy and free energy relative to a mixture of crystalline CaO, MgO, and 2SiO2), but crystalline diopside is even more stable [Reference Tarina, Navrotsky and Gan24, Reference Navrotsky, Maniar and Oestrike25, Reference Hon, Weill, Kasper and Navrotsky26]). A crystalline ternary carbonate phase K2Mg(CO3)ternary and its hydrated forms have been reported in early studies [Reference Golubkova, Merlini and Schmidt27, Reference Shatskiy, Litasov, Palyanov and Ohtani28, Reference Shatskiy, Borzdov, Litasov, Sharygin, Palyanov and Ohtani29, Reference Shatskiy, Sharygin, Gavryushkin, Litasov, Borzdov, Shcherbakova, Higo, Funakoshi, Palyanov and Ohtani30], but there appear to be only limited thermodynamic data for such materials [Reference Alekseev, Barinova, Rogacheva and Kulinich31]. Thus, we cannot make a direct comparison of the thermodynamics of the ternary glass and corresponding crystalline ternary carbonates.
It is apparent on the basis of the ATR and also the NMR measurements (see below) that some water is present in the glass sample. This water is structurally bound and introduced during the synthesis. The heat of solution measurements could therefore be influenced by water. The influence of ∼10 mol% water on the thermodynamic cycle outlined earlier, also determined from heat capacity measurements, would make the glass even less energetically stable and would increase the effective heat of vitrification term from +9.36 to +30.87 ± 1.95 kJ/mol and would increase the magnitude of the TΔS term.
NMR spectroscopy
The 13C MAS-NMR spectra for the carbonate glass [Fig. 2(a)] show a broad, nearly symmetrical center band at 168.7 ppm, with a FWHM of 4.7 ppm. This chemical shift is typical for alkali and alkaline earth carbonates [Reference Papenguth, Kirkpatrick, Montez and Sandberg32, Reference Marc Michel, MacDonald, Feng, Phillips, Ehm, Tarabrella, Parise and Reeder33, Reference Michel, McDonald, Feng, Phillips, Ehm, Tarabrella, Parise and Reeder34] and is slightly less than values typically published for end-member crystalline K2CO3 at 170.7 ppm or MgCO3 at 169.9 ppm, the 4.7 ppm FWHM being significantly greater than either at 0.3 and 0.5, respectively [Reference Sevelsted, Herfort and Skibsted35, Reference Moore, Surface, Brenner, Wang, Skemer, Conradi and Hayes36]. The large peak width indicates the presence of a significant degree of disorder, consistent with an absence of any crystalline phase, and is greater than that for additive-free ACC [Reference Marc Michel, MacDonald, Feng, Phillips, Ehm, Tarabrella, Parise and Reeder33, Reference Michel, McDonald, Feng, Phillips, Ehm, Tarabrella, Parise and Reeder34, Reference Nebel, Neumann, Mayer and Epple37]. This peak breadth corresponds to a broad distribution of chemical shifts in the glass that spans the chemical shift range for carbonate groups. The width is similar to distorted ‘network carbonate’ dissolved in fully polymerized silicate glasses on the SiO2–NaAlO2 join (4–6 ppm) (see Kohn et al. 1991; Brooker et al. 1999 [Reference Kohn, Brooker and Dupree38, Reference Brooker, Kohn, Holloway, McMillan and Carroll39]). The 55K2CO3–45MgCO3 spectrum is otherwise consistent with that expected from triangular carbonate anions, but it does not provide any further detail on the degree of distortion of the carbonate anions anticipated from the molecular dynamics simulation of this composition.
13C MAS-NMR spectra of 13C-labeled 0.55K2CO3·0.45MgCO3 glass acquired at 100.56 MHz (9.4 T) and spinning rates of (a) 10.3 kHz and (b and c) 1.5 kHz. Spectra in (a and b) were taken by direct 13C excitation (DE) with 4.5 μs pulses separated by a 30-s relaxation delay for (a) 800 and (b) 280 acquisitions, and in (c) by standard 1H → 13C cross-polarization (CP) with a 2-ms contact time and 2-s relaxation delay, for 800 scans. Inset shows center bands at an expanded scale.

More information on the distortion of the carbonate anions can potentially be extracted by determining the anisotropy and asymmetry of the chemical shift tensor. In a conventional solid state MAS-NMR experiment, the chemical shift tensor is intentionally averaged by rapid sample rotation to yield the high resolution isotropic line shape shown in Fig. 2(a). Slower rotation MAS techniques yield a complex spinning sideband pattern [Fig. 2(b)], from which the principal axis values of the chemical shift tensor δxx = 214 ± 2 ppm, δyy = 175 ± 1 ppm, and δzz = 117 ± 1 ppm were determined. The mean of the principal tensor values corresponds to the isotropic chemical shift δiso = (δxx + δyy + δzz)/3 and the position of the peak in the MAS-NMR spectrum at high spinning rate [Fig. 2(a)]. From these principal values can be calculated the anisotropy Δ = |δzz − δiso| = 52 ± 1 ppm, which provides a measure of the departure from cubic symmetry, and the asymmetry η = (δyy − δxx)/(δzz − δiso) = 0.75 ± 0.04 as the departure from axial symmetry (0 ≤ η ≤ 1).
Owing to the hygroscopic nature of the starting materials, we used standard CP-MAS and rotational-echo double-resonance (REDOR) methods to ascertain whether hydration of the glass exhibited any direct effect on the 13C chemical shift tensor values. Observation of reasonably strong CP-MAS intensity [Fig. 2(c)] and a slow build-up of REDOR dephasing, with a REDOR fraction asymptotically reaching 0.95 by about 20 ms (Fig. S1; Supplementary material), indicate that essentially all carbonate groups occur in proximity to H with mainly moderate to weak C–H dipolar coupling. However, the spinning sideband patterns obtained by CP-MAS, by REDOR difference at short dephasing time (1 ms; representing C proximal to H), and with REDOR dephasing at long dephasing time (6 ms; representing C distal to H) showed no systematic differences [Fig. 2(c); Fig. S2, Supplementary material]. The CSA parameters obtained from these spectra are within uncertainty of the values given earlier from spectra obtained by direct-excitation. This result indicates that although the glass contains H, the average chemical shift tensor for the carbonate groups is unrelated to proximity to H. The 13C-detected 1H NMR spectrum (Fig. S3; Supplementary material) is dominated by the signal from rigid structural water, with a smaller peak for hydroxyl groups, and a minor signal for hydrogen carbonate. The presence of minor hydrogen carbonate is also evident in the 13C CP/MAS spectrum as a small shoulder near 162 ppm (Fig. 2, inset).
A previous study of the CSA parameters for ACC has been used to investigate the degree of distortion of the carbonate anion [Reference Sen, Kaseman, Colas, Jacob and Clark6] and compared with crystalline carbonates, the ACC is never anhydrous, and water may play a role in controlling the degree of carbonate distortion. It was found that values for the asymmetry parameter, η, show a strong relationship with the axial distortion of the carbonate group expressed as the difference between the longest and shortest C–O bond lengths (σ). In contrast, a very little variation in the anisotropy is found for carbonate groups in crystalline phases and ACC, which fall in the range 45–55 ppm. The anisotropy for 0.55K2CO3·0.45MgCO3 glass (52 ppm) falls well within this range and is similar to that observed for ACC (49.3 ppm). These observations suggest limited departure of the carbonate group from planar geometry. The value for the asymmetry determined for the 0.55K2CO3·0.45MgCO3 glass (0.75) is significantly larger than any previously reported values, including those for hydromagnesite (0.55) and ACC (0.50) that are influenced by significant hydrogen bonding interactions. Extrapolation of the relationship between η and σ suggested by Sen et al. [Reference Sen, Kaseman, Colas, Jacob and Clark6], yields a value of σ ≈ 0.054 Å for the 0.55K2CO3·0.45MgCO3 glass. This significant value for σ inferred from the large value observed η supports the simulation approach we have used in allowing the anion to be flexible. We did note, however, that this estimate arises from an average CSA that represents the sum of what is likely to be wide spread in the distribution of values among carbonate anions in the glass as indicated by the large range of chemical shifts represented by the breadth of the isotropic peak shape.
Simulation and EDXED
Ambient pressure
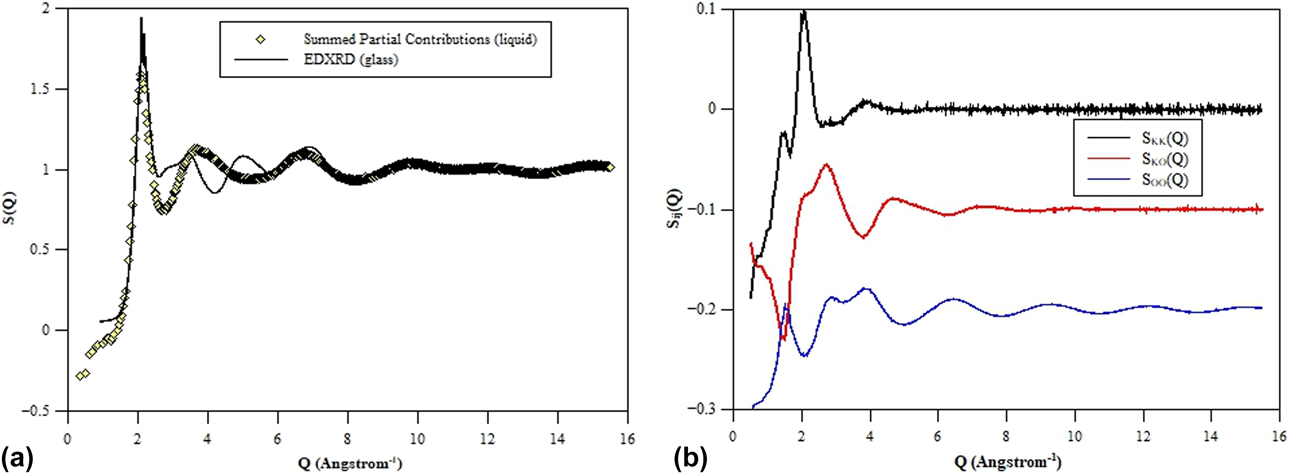
The structure of the ambient pressure glass has been studied as part of a broader investigation into the behavior of carbonate liquids at high pressure. Simulation of the ambient pressure liquid has been carried out using the flexible anion approach outlined earlier, which has successfully modeled the changes in the carbonate liquid structure with high pressure. Figure 3 shows the X-ray total structure factor obtained from EDXRD compared with that obtained from computer simulation. The figure also shows the X-ray weighted contributions from selected partial structure factors which sum to form the total scattering function. The agreement between the experimental and simulated total scattering functions is reasonable, both at low and high Q, the latter being dominated by the well-defined C–O and O–O nearest-neighbor length-scales arising from the carbonate anions. The agreement at intermediate Q is poor, with the oscillations over this Q-range arising from a complex superposition of all ten partial structure factors. As a result, the detailed structure in this Q-range is highly sensitive to subtle variations either in the structure factors or in the weightings used to recombine them to form the total functions. For example, relatively small changes in the X-ray form factors [Reference Su and Coppens40] (which weight the partial structure factor contributions to the total scattering function) lead to large changes in S(Q) in this intermediate Q-range. In the present work we make standard corrections in considering the presence of oxygen anions and apply standard tabulated form factors for carbon and potassium and magnesium cations. It is possible that the highly correlated nature of the carbon and oxygen atoms (in forming the carbonate anions) requires a detailed re-evaluation of the appropriate form factors. In addition, our modeling focus has, to date, been on the liquid state (as part of a broader study of a range of molecular systems combined with high temperature levitation experiments). It is entirely possible that (even relatively small) changes in the structure on vitrification may alter the balance of weightings of the partial structure factors and improve agreement with experiment. However, generating effective glass structures from simulation models is a well-known and significant problem in condensed matter simulation and will be the focus of future work.
Energy dispersive (collected at sector 16 APS) for 55% K2CO3–45% MgCO3 glass compared with the summed partial contributions for the simulated liquids of the same composition (top); the lower panel shows the individual partial contributions with X-ray weighting (Ashcroft–Langreth) fo K–K, K–O, and O–O which dominate the X-ray scattering pattern. There is a considerable mismatch between the experiment and simulation. This could result from the difference between the fully relaxed liquid and the vitreous form of this carbonate.

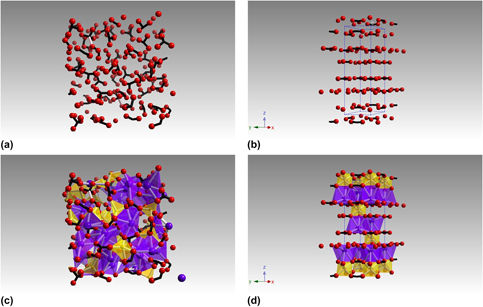
The ambient pressure liquid structure is shown in a molecular dynamics snapshot in Fig. 4. The figure illustrates the distortions of the carbonate anions away from the ideal trigonal planar configuration (4a). Note that there is no evidence that the carbonates form chains or the other complex structures as observed in simulation models for Na2CO3. There is, however, clear evidence that the additional C–O length scale is beginning to develop even at ambient pressure. As a result, the ambient pressure structure shows isolated, distorted carbonate anions with different C–O bond lengths consistent with the in-plane distortion identified by the NMR measurements. The flexibility of the carbonate anion, which allows the carbon atom to move out of the plane of the three oxygen atoms, appears limited at ambient pressure, consistent with the NMR data that suggests this deviation from the planar geometry is within the range of that for crystalline carbonates.
Molecular dynamics snapshots of the 55% K2CO3–45% MgCO3 liquid at 1800 K showing the distribution of the carbonate anions. C–O bonds are shown in black (a) with some longer C–O bond lengths (shown in gray) and formation of the CO3+1 configuration apparent even at ambient pressure. This is compared with the rhombohedral crystal structure of K2Mg(CO3)2 [Reference Hesse and Simons41] (b) with the unit cell illustrated; the rigid, triangular carbonate anions form planes perpendicular to the c-axis. In the lower figure, potassium and magnesium atoms are also shown (c); the structure is dominated by the strong interaction between the large, blue potassium cations and the distorted carbonate. The coordinate polyhedra of potassium and magnesium are shown for the ambient pressure crystal structure.

The ambient pressure crystal structure of synthetic K2Mg(CO3)2, determined by Hesse and Simons [Reference Hesse and Simons41] is shown for comparison in Fig. 4. The ambient structure is rhombohedral  $\left( {R\bar{3}m} \right)$ with planar, CO3 units arranged in the a–b plane. Magnesium octahedra are corner-shared with the carbonate and edge-shared with alternate KO9 coordinate polyhedra. This structure contrasts with that obtained from the simulation of the liquid, wherein the carbonate is more distorted, and both magnesium and potassium cations occur in irregular channels or percolation domains.
Application of pressure
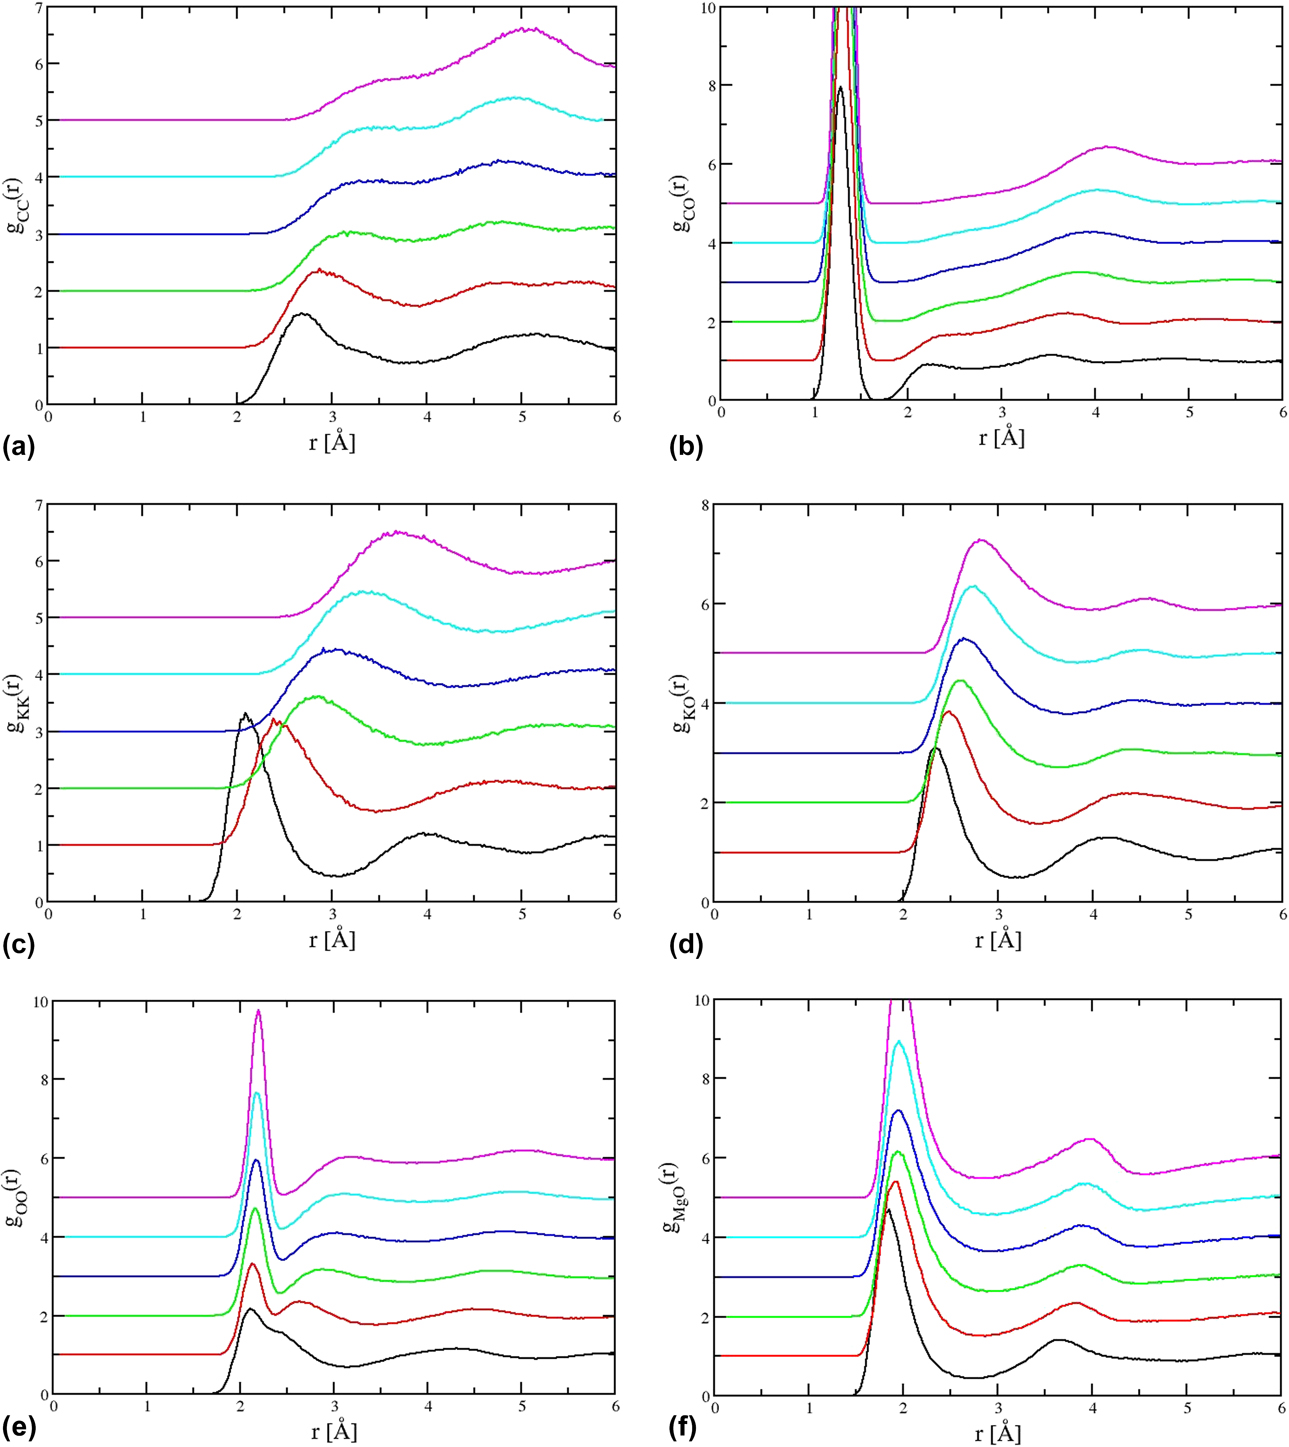
In previous interpretations of this carbonate glass structure, magnesium is assumed to act as a bridging species and to form a network with the carbonate anions. A motivation for that interpretation was the combination of larger formal ion charge and smaller ionic radius which make the magnesium cation significantly more polarizing than the potassium cation. Although the ambient pressure structure does show magnesium adopting this role, both magnesium and potassium could be argued to adopt a bridging role, at the very least in a sense that they form strong Coulombic interactions with the carbonate anions. Although magnesium clearly has an important role in stabilizing the glass, the greatest changes in response to the application of pressure are observed in the relationship between the potassium and oxygen ions. To highlight these changes, Fig. 5 shows the (unweighted) partial pair distribution functions for six selected ion pairs. On application of pressure, the Mg–O pair distribution function appears relatively invariant with the nearest-neighbor length-scale shortening slightly (consistent with a simple increase in density). The C–C, O–O, and C–O pair distribution functions show significant changes consistent with the greater emergence of the second C–O near-neighbor lengths-scale indicated earlier. The most dramatic changes are observed in the K–O pair distribution function. At ambient pressure, the nearest-neighbor distribution is relatively broad and at a relatively long range, indicative of the potassium cation acting more as a network modifier than a network-former. As the pressure increases the nearest-neighbor length-scale shifts to a significantly lower range (from r KO ∼ 3.4 Å to ∼2 Å) indicative of the change in the role of the potassium cation to act as a network-former, moderating the change in structure observed for the carbonate anions. More important, however, is that these contributions reflect underlying changes in the carbonate anion, and it is the flexibility of this anion that determines the response of this system to pressure [Reference Sahu, Boatner and Navrotsky19]. The flexibility in the anion results in the changes to the O–O and K–O contributions that result in the dramatic, pressure-induced changes in the diffraction pattern which accompany the emergence of a second C–O length scale. The complex relationship between the K+ cations and the oxygen atoms in the carbonate determines the high pressure response, while changes in the magnesium atom pair contributions are limited.
Six of the partial radial distribution functions to illustrate the response of the K2CO3–MgCO3 liquids to pressure. The curves are generated by the simulations at six different densities (pressures) with the lowest densities the topmost curves. The emergence of the second C–O length scale seen at high pressure in the C–O (a) and C–C (b) partial contributions. The changes in K–K (c), K–O (d) and O–O (e) partial contribution represent the changes in the potassium sub-density and strong interaction between the oxygen atoms in the carbonate anion and the potassium cations. The Mg–O partial contribution (f) changes little with pressure.
The simulated liquid structure can be compared with those of double carbonates [Reference Golubkova, Merlini and Schmidt27] at elevated pressures. The K2Mg(CO3)2 crystal transforms from a rhombohedral  $\left( {R\bar{3}m} \right)$ structure into a monoclinic polymorph with pressure [Reference Golubkova, Merlini and Schmidt27, Reference Shatskiy, Sharygin, Gavryushkin, Litasov, Borzdov, Shcherbakova, Higo, Funakoshi, Palyanov and Ohtani30]: in this case, the carbonate anion remains rigid with limited change in the C–O distances, in contrast to the glass. The response to pressure of the crystalline double carbonates reflects the anisotropy of compression along a- and c-axes since the polyhedron of the larger cation is more compressible than that of magnesium. In liquid, it is the distortion of the carbonate anion that influences the response to pressure and also the formation of the glass. The structure of this glass is therefore more similar to that proposed for aqueous calcium carbonate where there is strong interaction between H2O molecules and the distorted carbonate units in close proximity, stabilizing the structure against crystallization [Reference Genge, Jones and Price5]. In the K–Mg carbonate glass, it appears that the magnesium cations form strong interactions with the carbonate anions across the whole pressure range (consistent with the expected strong electrostatic interactions), in a manner which can be considered network-forming. However, the role of the potassium cations is more interesting as this appears to change from being largely network-modifying at low pressure to network-forming at high pressure.
Conclusions
In this study, we have determined the enthalpy of formation of a rare carbonate glass by high temperature oxide calorimetry. This completely glassy sample has an enthalpy of formation from the oxides of −261.12 ± 3.02 kJ/mol. The glass is energetically metastable with respect to a mixture of the crystalline end-members by only +9.36 ± 1.95 kJ/mol, and this small contribution to the free energy is balanced by the configurational entropy of K–Mg mixing, providing the ternary glass possible stability with respect to the binary crystalline end-members. Further entropic stabilization may arise from carbonate group distortions and disorder confirmed by analysis of the 13C MAS NMR spectra, collected for a similarly prepared glass sample. The results show an asymmetry parameter (η), a measure of departure from axial symmetry, to be larger than for any alkali or alkaline earth carbonate, indicating that the carbonate anion is distorted, with an average difference in the C–O bond length of about 0.06 Å. However, the anisotropy shows that the deviation from planar geometry falls within the range of crystalline carbonates. Molecular dynamics simulations for the equivalent liquids using the flexible anion approach also show distorted carbonate units with the carbon atom moving slightly out of plane but not forming the higher coordinate CO3+1 configurations proposed for high pressure versions of this glass. The ambient pressure glass sample has distorted carbonate anions that are isolated and do not form networks but show a complex relationship with the potassium cations. The interaction between the potassium cations and the oxygen atoms from the carbonate define the glass structure at low pressure, and the same flexibility of the carbonate anion dictates the high pressure response. The ambient pressure glass is superficially similar in structure to amorphous hydrated calcium carbonate, where the structure is defined by distorted carbonate anions in close proximity to a hydrogen-bonded network.
Experimental details
Glasses were prepared using a starting mixture of 55 mol% K2CO3 and 45 mol% MgCO3, which is the ratio at the eutectic region (at ∼730 K) on the binary join [Reference Ragone, Datta, Roy and Tuttle11]. Reagent grade K2CO3, or for ATR and NMR measurements, 98% 13C labeled K213CO3 (MSD isotopes) were dried at 673 K. The MgCO3 was in the form of a natural, optically clear magnesite crystal from Brumado, Brazil (virtually water-free as confirmed by FTIR) which was ground into fine powder immediately prior to the experiment. The mixture was loaded into 3.8-mm length Au capsules which were welded shut and placed into a Tuttle-type cold-seal bomb with a rapid quench rod extension [Reference Ihinger42]. Experiments were conducted at 1050 K, 0.1 GPa for ∼10–15 h and then quenched (>200 °C/s). The resulting glass was removed from the Au capsule, mostly as a single solid slug, representing the central part of the quenched melt.
IR spectra were collected using a ThermoNicolet i10 FTIR (Thermo Nicolet Corporation, Madison, Wisconsin) spectrometer fitted with a Ge-tipped ATR head. 128 scans were collected at a resolution of 8 cm−1 using a MCT detector and a KBr beamsplitter in the absorbance mode. The sample was polished using dry alumina grit coated sheets (to a 1 μm finish), and the collection area was approximately a 30-μm square.
The enthalpy of drop solution of the carbonate glass was determined by high temperature oxide melt solution calorimetry. These experiments used a custom-built, Tian–Calvet isoperibol calorimeters at the Peter A. Rock Thermochemistry Laboratory at UC Davis and followed the standard practice reviewed in several recent publications [Reference Navrotsky18, Reference Navrotsky43, Reference Navrotsky44]. In these experiments, a series of small pellets of the carbonate glass (∼5 mg) are dropped from room temperature into a molten oxide solvent. In this case, the solvent was sodium molybdate (3Na2O–4MoO3) contained in a large platinum crucible which is contained in a silica glass crucible and outer silica glass liner. For these experiments, the entire glass assembly is flushed with oxygen at 43 mL/min. Oxygen is bubbled, at 4.5 mL/min, through the solvent using a platinum-tipped silica tube; this not only mixes the solvent to ensure complete dissolution of the sample and evolve the CO2 but can also be used to control the oxidation state.
The individual pellets are dropped from room temperature into the solvent at 975 K with the heat flow resulting from the drop measured as a change in voltage in the calorimeter thermopile. Each measurement comprises a 10 min-collection of the initial calorimeter baseline and the return to the sample baseline following the drop solution measurement. The overall reaction time was 28–30 min. The integral of the voltage change is converted to the reaction enthalpy by using a calibration factor determined by dropping pellets of known heat contents (α-Al2O3).
Solid-state NMR spectra were acquired at Stony Brook University with a 400 MHz (9.4 T) A Varian Inova spectrometer operating at 100.56 MHz and a 500 MHz Varian Infinity plus spectrometer at 125.68 MHz were used. A set of small pellets of the 13C-labeled 0.55K2CO3:0.45MgCO3 glass was loaded directly into a 3.2 mm rotor assembly and sealed with an air-tight press-fit cap. The direct-excitation 13C MAS-NMR (Magic Angle Spinning) spectra were acquired with standard single-pulse methods with 4.5 μs 80° pulses and a 30-s relaxation delay at spinning rates that varied from 1.5 to 10.3 kHz. The T 1 spin-lattice relaxation time was estimated to be 10 s by bracketing the null point in a series of inversion-recovery experiments. Additional abbreviated acquisition spectra at a longer (50 s) relaxation delay were acquired before and after each spectrum but showed no evidence of spectral changes that could indicate the onset of crystallization during the NMR experiments. The average 13C chemical shift tensor values were estimated from analysis of the spinning sideband intensities for a spectrum acquired at a 1.5-kHz spinning rate according to the method of Herzfeld and Berger [Reference Herzfeld and Berger45] as implemented in “HBA” software [Reference Eichele46]. To assess potential hydration of glass, additional spectra were acquired by 1H → 13C cross-polarization MAS (CP-MAS) methods at contact time ranging from 0.2 to 10 ms and spinning rates of 1.5 and 8.0 kHz and by 13C[1H] REDOR methods. A two-dimensional 13C[1H] CP heteronuclear correlation spectrum was acquired at a spinning rate of 8.0 kHz and a contact time of 2 ms, as 64 hypercomplex points in t1 at a 10-μs interval (100 kHz 1H spectral width). Linear prediction methods were used to complete the signal decay in t1 to mitigate truncation artifacts. From these data, 13C-detected 1H NMR spectra were obtained as a 1-dimensional cross-sections extracted at the 13C peak position. The chemical shifts were referenced to those of tetramethylsilane via secondary referencing to adamantane (38.6 ppm for the methylene 13C, 2.0 ppm for 1H).
In the previous work, molecular dynamics simulations have been performed on carbonate liquids using a potential developed by Tissen and Janssen, of the Born–Huggins–Mayer form [Reference Tissen, Janssen and Vandereerden47]. The trigonal geometry of the carbonate anion is imposed by employing harmonic springs that act between C–O and O–O pairs. In later studies [Reference Wilding, Wilson, Ribeiro, Benmore, Weber, Alderman, Tamalonis and Parise3, Reference Wilson, Ribeiro, Wilding, Benmore, Weber, Alderman, Tamalonis and Parise4], we developed an approach that allows both flexibility of the molecular anion and fluctuation of the internal charge distribution [Reference Costa and Ribeiro48, Reference Ribeiro49, Reference Ribeiro50, Reference Ribeiro51]. In the simulations carried out here, we fix the charge distribution on the anion. The simulations have been carried out at a fixed temperature (of T = 1800 K) and constant volume. F x(Q) was generated by combining the partial (Ashcroft–Langreth) structure factors (of which there are ten for the four component system). These were calculated directly from the Fourier components of the ion densities,  ${S_{\alpha ,\beta }} = \left\langle {A_\alpha ^*\left( Q \right){A_\beta }\left( Q \right)} \right\rangle$, where
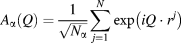 ${A_\alpha }\left( Q \right) = {1 \over {\sqrt {{N_\alpha }} }}\mathop \sum \limits_{j = 1}^N \exp \left( {iQ \cdot {r^j}} \right)$. Total X-ray structure factors were constructed from weighted sums of these partial structure factors using X-ray form factors taken from standard sources [Reference Cromer and Mann52].
The energy-dispersive X-ray diffraction data were collected at HPCAT, sector 16, at the Advanced Photon Source (APS), Argonne National Laboratory. The total X-ray structure factor was obtained using the multi-angle energy-dispersive technique which uses a focused, white X-ray beam with 7 × 7_m size. Scattering data were collected on a Ge solid state detector (Canberra) at 2 theta angles of 3.14°, 4.14°, 5.14° ,7.14°, 9.14°, 12.15°, 16.15°, 22.15°, 28.14°, and 31.32°. This detector was calibrated using gold peaks at ambient pressure conditions. The total exposure for each pressure point was obtained by normalizing each detector pattern to the white X-ray beam with further corrections using the optimization techniques described by Shen et al. [Reference Shen, Prakapenka, Rivers and Sutton53] and Kono et al. [Reference Kono, Kenney-Benson, Hummer, Ohfuji, Park, Shen, Wang, Kavner and Manning54]. The energy-dispersive patterns for each detector were rescaled and merged to form a Faber–Ziman type total structure factor. In this study, we eliminated the data from the 3.14° detector bank since these clearly showed crystalline peaks from the sample assembly. The scattering intensity in the 31.32° detector bank was very low, and these latter data were also eliminated from the subsequent normalization. The individual segments were smoothed by an error-weighted spline and scaled to the energy of the primary X-ray beam in the highest angle segment.
Supplementary material
To view supplementary material for this article, please visit https://doi.org/10.1557/jmr.2019.250.
Acknowledgments
M.C.W. and P.A.B. would like to acknowledge the funding support from the EPSRC under grant EP/R036225/1. M.W. is grateful for the support from the EPSRC Centre for Doctoral Training, Theory and Modeling in Chemical Sciences, under grant EP/L015722/1. R.A.B. was funded by the NERC Thematic Grant consortium NE/M000419/1. The diffraction study was performed at HPCAT (Sector 16) of the Advanced Photon Source (APS). The Advanced Photon Source is a US DOE Office of Science User facility, operated for the DOE Office of Science by Argonne National Laboratory under contract DE-AC02-06CH11357. Calorimetry at UC Davis was supported by the U.S. Department of Energy, Office of Science, Office of Basic Energy Sciences, Chemical Sciences, Geosciences, and Biosciences Division under Award DE-FG02ER1474.