INTRODUCTION
Extreme weather events due to climate change might affect agriculture severely (Padgham Reference Padgham2009). With the increase in world population, climate change will greatly affect food security (Cline Reference Cline2007; Schmidhuber & Tubiello Reference Schmidhuber and Tubiello2007). People in the tropics and especially in developing countries, are expected to experience the worst adverse effects of climate change (Cline Reference Cline2007; Schmidhuber & Tubiello Reference Schmidhuber and Tubiello2007; Stern Reference Stern2007; Padgham Reference Padgham2009). Many studies across the globe indicate that wheat will be severely affected by climate change (Anwar et al. Reference Anwar, O'Leary, McNeil, Hossain and Nelson2007; Asseng et al. Reference Asseng, Foster and Turner2011; Trnka et al. Reference Trnka, Rötter, Ruiz-Ramos, Kersebaum, Olesen, Žalud and Semenov2014). In a separate simulation study for effects of temperature on wheat, Asseng et al. (Reference Asseng, Ewert, Martre, Rötter, Lobell, Cammarano, Kimball, Ottman, Wall, White, Reynolds, Alderman, Prasad, Aggarwal, Anothai, Basso, Biernath, Challinor, De Sanctis, Doltra, Fereres, Garcia-Vila, Gayler, Hoogenboom, Hunt, Izaurralde, Jabloun, Jones, Kersebaum, Koehler, Müller, Naresh Kumar, Nendel, O'Leary, Olesen, Palosuo, Priesack, Eyshi Rezaei, Ruane, Semenov, Shcherbak, Stöckle, Stratonovitch, Streck, Supit, Tao, Thorburn, Waha, Wang, Wallach, Wolf, Zhao and Zhu2014) reported that a 1 °C rise in temperature might reduce wheat yield by 6%. Similar studies in India reported a decrease in wheat yield by 7% for a 1 °C increase in minimum temperatures even during the baseline period (Rao et al. Reference Rao, Chowdary, Sandeep, Pramod and Rao2015). Decreased wheat yield has also been projected in some arid and semi-arid regions where growing periods are shortened due to high temperatures (Ludwig & Asseng Reference Ludwig and Asseng2006). This underscores wheat sensitivity to elevated temperatures. Global wheat production under conventional management is expected to reduce unless adaptation measures (such as increased fertilizer and irrigation) are in place (Balkovič et al. Reference Balkovič, Van Der Velde, Skalský, Xiong, Folberth, Khabarov, Smirnov, Mueller and Obersteiner2014).
Climate extremes, e.g. changes in rainfall characteristics is one of the most limiting factors for wheat yield in medium to low rainfall areas (Luo et al. Reference Luo, Bellotti, Williams and Bryan2005; Ludwig & Asseng Reference Ludwig and Asseng2006). In Ethiopia, the crop is grown under rainfed conditions but rainfall, especially in the semi-arid highlands of Ethiopia, has been reported to be variable and short (Araya et al. Reference Araya, Keesstra and Stroosnijder2010b , Reference Araya, Stroosnijder, Habtu, Keesstra, Berhe and Hadgu2012). The northern part of the country has been affected by frequent occurrence of drought over recent decades (Araya & Stroosnijder Reference Araya and Stroosnijder2011; Araya et al. Reference Araya, Stroosnijder, Habtu, Keesstra, Berhe and Hadgu2012). According to Deressa (Reference Deressa2006), climate change, especially changes in rainfall patterns and increased temperatures, is expected to have a significant negative impact on farming activities. In the coming decades, climate conditions are expected to worsen, which will increase the vulnerability of humans to extreme weather (You & Ringler Reference You and Ringler2010).
Crop models could be used to analyse the impacts of unfavorable climate variability and change on crop yields (Jones et al. Reference Jones, Hoogenboom, Porter, Boote, Batchelor, Hunt, Wilkens, Singh, Gijsman and Ritchie2003; Keating et al. Reference Keating, Carberry, Hammer, Probert, Robertson, Holzworth, Huth, Hargreaves, Meinke, Hochman, McLean, Verburg, Snow, Dimes, Silburn, Wang, Brown, Bristow, Asseng, Chapman, McCown, Freebairn and Smith2003; Cooper et al. Reference Cooper, Dimes, Roa, Shapiro and Twomlow2008) and simultaneously simulate and understand many different climate change impacts and adaptation scenarios, which reduces unnecessary cost of field experimentation (such as for testing adaptation practices) (Burke et al. Reference Burke, Lobell and Guarino2009). In addition, assessment of yield status under the present and future climate could enable policy makers to understand future food supply and demand in order to estimate likely food shortages.
Following calibration and validation of the Agricultural Production Systems sIMulator (APSIM), three separate climate change scenarios were devised to understand the impacts of interactions of climate change and adaptation factors on wheat yield. The first scenario deals with the response of cultivar(s) to climate change and adaptation, the second scenario explores the response of wheat to various plausible levels of CO2 in combination with possible changes in temperature and rainfall under optimal and sub-optimal fertilizer conditions and the third scenario was formulated to evaluate the impacts of elevated temperature and changes in rainfall with and without adaptation through integration of climate simulation with multi-global climate models (GCMs) and surveyed field data for approximately 200 wheat growing smallholder farmers in Northern Ethiopia.
The objectives of the current study were to: (1) calibrate and evaluate the APSIM-wheat model for simulating impacts of climate change on wheat yield, (2) explore the response of wheat cultivars to possible changes in climate and CO2 under optimal and sub-optimal fertilizer application and (3) assess the impact of climate change and adaptation practices on wheat yield based on integration of climate simulated with multi-GCMs (for short- and mid-term period) and surveyed farmer data for the Hintalo-Wajrat areas of Northern Ethiopia.
MATERIALS AND METHODS
Experimental sites and data
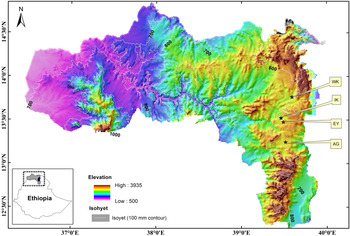
Wheat field experiments were carried out during the 2011 cropping season at Wukro (13°46′E, 39°35′N, 1980 m a.s.l) and Hintalo-Wajrat (13°15′E, 39°30′N, 2200 m a.s.l.), and in 2012/13 at Mekelle, at Endayesus (13°28′E, 39° 28′N, 2212 m a.s.l.) and Industrial Kebele (13°31′E, 39°28′N, 2050 m a.s.l.) experimental sites, northern Ethiopia. A map of the study sites is presented in Fig. 1.
Map of the study area inserted in Tigray region of Ethiopia. IK and EY are the experimental sites in the Mekelle area (MU), AG is the experimental and survey site at Hintalo-Wajrat and WK is the experimental site at Wukro, Northern Ethiopia. Colour online.

The soil texture for Endayesus and Industrial Kebele, Wukro and Hintalo-Wajrat sites were sandy clay loam, clay, sandy loam and clay, respectively. The estimated total available soil water for Endayesus, Industrial Kebele, Wukro and Hintalo-Wajrat sites were 120, 150, 120 and 150 mm/m, respectively. Soil pH, organic carbon (OC), organic matter (OM) and total nitrogen (TN) for Endayesus and Industrial Kebele sites were 6·75 and 7·98, 7 and 24·5 g OC/kg, 12·1 and 24·9 g OM/kg and 0·8 and 1·5 g TN/kg, respectively. The corresponding values for Hintalo-Wajrat were pH 8, 18 g OC/kg, 30·6 g OM/kg and 1·4 g TN/kg. No chemical analysis data were available for Wukro.
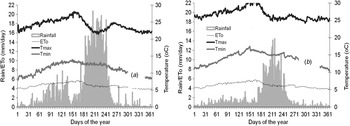
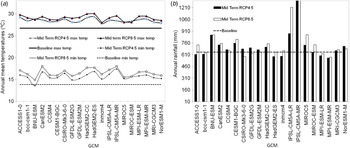
Long-term climate data (1980–2009) of the experimental and survey sites including daily maximum and minimum temperature, rainfall and solar radiation were obtained from the National Meteorological Agency. Daily climate data (1980–2009) of temperature, evapotranspiration and rainfall for MU and Hintalo-Wajrat sites are presented in Fig. 2(a) and (b). The Endayesus and Industrial Kebele experimental sites were represented by the Mekelle weather station, located approximately 5 and 15 km south of the two sites, respectively, whereas the Hintalo-Wajrat and Wukro experimental site were represented by the Adigudom and Wukro weather stations, which are found approximately 5 and 10 km north of the Hintalo-Wajrat and Wukro experimental sites, respectively. Reference evapotranspiration for all sites was calculated using the Hargreaves equation (Allen et al. Reference Allen, Pereira, Raes and Smith1998). The future climate data (including daily rainfall, daily max and min temperatures) of the survey site (in the Hintalo-Wajrat area) was projected under two Representative Concentration Pathways (RCP8·5 and RCP4·5) for two 30-year terms (short term, 2010–2039 and mid-term, 2040–2069) using 20 GCMs. Climate data were entered in a matched case survey data import spreadsheet from the Agricultural Model Intercomparison and Improvement Project (AgMIP). The projected average of mean annual rainfall and mean daily maximum and minimum temperatures for the short- and mid-term scenarios, simulated based on 20 GCM together with respective variables for the baseline scenario, are presented in Fig. 3(a) and (b).
Long-term (1980–2009) mean daily rainfall, mean reference evapotranspiration and temperature data of (a) Mekelle and (b) Hintalo-Wajrat (Adigudom) sites, Northern Ethiopia.

Annual mean (a) temperatures (mean max. and min. temp.) and (b) rainfall as simulated based on 20 CMIP5 GCMs for baseline, short- and mid-term scenarios for Hintalo-Wajrat (Adigudom) area, Northern Ethiopia.

Experimental setup
The wheat experiment comprised two fertilizer levels (zero fertilizer and optimal fertilizer (64 kg N/ha and 46 kg P/ha) under rainfed conditions. The design was a randomized complete block design with three replicates. Plot size was 2·5 × 4 m2: spacing between plots was 1 m and that between blocks was 1·5 m. Information on phenology (days to emergence, days to flowering and days to maturity) and yield of the wheat cultivar (HAR-2501) was collected from the four sites during the experimental period (Wukro and Hintalo-Wajrat in 2011; Endayesus and Industrial Kebele in 2012 and 2013).
Survey site and data
The household and field survey was carried out in 2012 in the Hintalo-Wajrat area (Adigudom), 37 km south of Mekelle city, Northern Ethiopia. The survey data included soils, crop and crop management information such as planting date, planting depth, harvest date, planting density, cultivar and yield. Crop data were obtained using a structured interview from about 200 farmers in the study site, whereas soil information was obtained from samples of representative profiles in the sites. Soil fertility management practices such as timing and amount of N fertilization added were obtained from interviews. Since the soil at the experimental sites was mainly homogenous, mean values of the soil characteristics were used as model data input.
Model calibration
The wheat model in APSIM v7·4 was calibrated based on the available climate, soil and crop information at the experimental sites. During the calibration processes, soil, climate and management data for the experimental sites were entered into the model. Tests were carried out in the model to find suitable cultivars that matched the experimental cultivar in terms of yield and phenology. The 2013 cropping season rainfed experiment under optimal fertility condition was used for calibration (Table 2).
Model evaluation
Model evaluation was carried out using experimental data (rainfed with optimal fertilizer application). The observed days to emergence, days to flowering and days to maturity obtained at the experimental sites were compared with the respective predicted data for growing seasons 2011 and 2012. Performance of the model was assessed using goodness-of-fit statistical tests (Eqns (1), (2) and (3)). These statistics, such as R 2, index of agreement (IA), percent of deviation from the mean (D) and root mean square error (RMSE), were used when evaluating the model: R 2 was used to test the strength of the agreement between the predicted and observed data, while IA was applied to assess the agreement between the simulated and observed values. Index of agreement was estimated based on Eqn (1):
 $$IA = 1{\rm -} \displaystyle{{\sum\limits_{i = 1}^n {{(P_i - O_i)}^2}} \over {\sum\limits_{i = 1}^n {{( \vert P_i - O_{\rm m} \vert + \vert O_i - O_{\rm m} \vert )}^2}}} $$
where IA = 1 indicates excellent agreement between the predicted and observed data, O i and P i are observed and predicted values, O m is the mean values of O i , (Willmott Reference Willmott1982).
Errors that could occur due to insufficient model simulation performance and the deviations of the predicted from the observed values were quantified based on RMSE (Eqn (2)) and D (Eqn (3)), respectively:
 $$RMSE = \sqrt {\displaystyle{{\sum\limits_{i = 1}^n {{\left( {P_i - O_i} \right)}^2}} \over n}} $$
 $$D = \left[ {\displaystyle{{P_i - O_i} \over {O_i}}} \right] \times 100$$
where n is number of observations, P i the predicted values and O i the observed values.
After gaining confidence in the performance of the model, the response of wheat to changed climate and adaptations were studied. In addition, further climate change impact and adaptation assessments were conducted using multi-GCMs and surveyed data based on the AgMIP technique (AgMIP 2012).
Model setups and climate change scenarios
Assessing the response of wheat cultivars to temperature and rainfall changes
A baseline climate (1980–2009) that includes daily minimum and maximum temperatures, rainfall and radiation was created in APSIM. The climate control component (tool) in APSIM was used to make incremental changes in temperature and/or rainfall relative to the baseline data. Three levels of temperature (1, 3 and 5 °C) and three levels of change in rainfall (0, –10 and +10%) on two different wheat cultivars with different maturity dates were used to capture the interaction effects of change in temperature and rainfall on growth and development of wheat. An early maturing wheat cultivar, sufi, was selected in the APSIM model and found to be earlier compared with the experimental cultivar. Initial soil water content and sowing window were set between 45–55% and 5–25 July, respectively; the model was set to sow when 25 mm rain was received in 7 days. The performances of the cultivars were then tested by exposing them to interactions of altered temperature and rainfall.
Assessing the response of wheat to carbon dioxide in combination with changes in temperature and rainfall under optimal and sub-optimal fertilizer conditions
As in the above section, the climate control component in APSIM was used to modify the baseline climate and CO2. The main aim of this analysis was to assess and understand the response of wheat to combinations of change in CO2, temperature and rainfall under optimal and sub-optimal fertilizer management conditions. In this analysis, a CO2 level of 350 ppm was assumed as the baseline. Additions of 100, 220 and 450 ppm (i.e. 450, 570 and 800 ppm) and temperature increments of +1, +3 and +5 °C relative to the baseline as well as changes in rainfall of 0, +10% and –10% over the baseline data were used for demonstrating interaction effects of climate variables on yield performance of wheat. The optimal (64 kg/ha N) and sub-optimal (16 kg/ha N) fertilizer rates were based on regional recommendation (‘optimal’) and average present fertilizer use practices, respectively.
Assessing impacts of climate change on future wheat yield based on multi-global climate models and field survey data under baseline carbon dioxide with present and improved management
Wheat yield under baseline CO2 with present management practices was simulated based on 20 GCMs for the short- and mid-term periods. The following management modifications were made before running the model. Plant population was assumed to be 300 plants/m2, matching actual observations at the site. The sowing window was set based on certain criteria (see below) and the model was able to simulate the date of sowing. The sowing criteria used were 25 mm rain in 5 days for the baseline scenario; 30 mm rain in 5 days for the short-term and mid-term scenarios. According to the survey, 5–25 July was the most common sowing time for wheat at the study site and hence the sowing window was set accordingly. Planting depth (3–5 cm) and row spacing (20 cm) were assumed to be similar across the study area.
According to the survey, the quantities of fertilizer and OM application vary from farmer to farmer. For the historical scenario, the majority of fertilizer users apply all of the fertilizer at sowing. However, for the future scenario, technology and farmers’ knowledge was assumed to change; hence the timing of fertilizer application was split into two, with half of the total fertilizer applied at sowing and the other half 40 days after sowing. Some unmeasured initial soil conditions were generalized based on information obtained from other similar nearby sites, such as initial nitrate (NO3) and ammonium (NH4) concentrations, which were 0·1 and 0·01 ppm, respectively. Initial inorganic soil N over the profile was assumed as 10 kg/ha and initial surface residue from previous crop was assumed as 500 kg/ha. The N content of initial surface residue was assumed to be 8 g/kg and initial percent of available water was set at 50%.
The Agricultural Model Intercomparison and Improvement Project has introduced three multi-model friendly spreadsheet files: one that can be used to store surveyed information (Survey Import file), another that supplies model data input based on regional or site-specific assumptions (Field Overlay file) and a model data input file that supports performance of artificial experimentation and scenario analysis (Seasonal Strategy file) with multiple seasons (AgMIP 2012). The Survey Data Import, Field Overlay and Seasonal Strategy Data input files were properly completed (survey information from 200 farmers including management, crop, soil and climate (20 GCM) data) and model-ready input files were then created using the ‘QUick And Dirty [File Translation] User Interface’ (QuadUI) tool (AgMIP 2012) and finally translated into a readable output file using the ‘AgMIP Crop Model Output User Interface’ (ACMOUI) tool (AgMIP 2012).
In addition, the impacts of climate change on future wheat yield based on baseline CO2 with improved and present management along with the above-mentioned survey data and initial conditions was assessed for the mid-term period based on 5 GCMs (A = Australian Community Climate and Earth-System Simulator 1·0 (ACCESS1·0), B = Beijing Climate Center Climate System Model 1·1 (BCC-CSM1·1), C = Beijing Normal University Earth System Model (BNU-ESM), E = Community Climate System Model 4 (CCSM4) and K = Hadley Centre Global Environment Model version 2 (HadGEM2-ES)). Optimal planting (15 June–05 July) and optimal fertilizer rate (64 kg/ha N) were predetermined by the sensitivity analysis and field survey and then used as climate change adaptation setup in the current study (Table 1). The APSIM-wheat model was then run as a function of climate, soil characteristics and management practices to simulate wheat yield under future climate scenarios.
Baseline management v. climate change adaptation practices (management inputs) and the dominant wheat cultivar in Hintalo-Wajrat area of Northern Ethiopia

RESULTS
Model calibration and evaluation
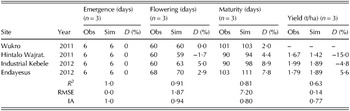
Results showed that in the model, the selected cultivar Kutuko was similar to the experimental cultivar (HAR-2501). For example, some of the results of the experiment, such as phenology, were similar to the phenology of Kutuko. Table 2 shows the model calibration data set (for days to emergence, flowering and maturity and yield) and their respective simulated values for wheat cultivar (HAR-2501) at EY site, whereas the statistical evaluation of the observed against the simulated days to emergence, flowering, maturity and yield for experimental wheat cultivar (HAR-2501) at Wukro and Hintalo-Wajrat (in 2011) and Industrial Kebele and MU-E (in 2012) are presented in Table 3.
Experimental observations used as model calibration data set and their respective simulated values for wheat cultivar (HAR-2501) at Endayesus (Northern Ethiopia) during the cropping season in 2013

D, percentage of deviation; Obs, observed; Sim, simulated.
Statistical evaluation of observed against simulated days to emergence, flowering, maturity and yield for experimental wheat cultivar (HAR-2501) at four experimental sites in Northern Ethiopia during the cropping season in 2011 and 2012

Obs, observed; Sim, simulated; D, percentage of deviation from the mean; RMSE, root mean square of error; IA, index of agreement.
Overall, there was an excellent relationship between observed and simulated days to emergence (R 2 = 1; IA = 1; RMSE = 0; D = 0). The statistical regression of observed v. simulated days to flowering showed a strong relationship (R 2 = 0·91) (Table 3). The deviation of observed from simulated values ranged between –1·7 and 2·9%, IA between simulated and observed values was 0·9 and the RMSE value was approximately 2 days (Table 3). Furthermore, the statistical comparison between the simulated and observed days to maturity (Table 3) also produced satisfactory goodness-of-fit indicators (R 2 = 0·81; IA = 0·80; RMSE = 6·0 days; D = 2 to 8·9%). Yield was well simulated with R 2, RMSE, IA and D of 0·63, 0·14 t/ha, 0·77 and –15 to 5·6%, respectively (Table 3).
Climate change scenario runs and analysis
Response of wheat cultivars to temperature and rainfall changes
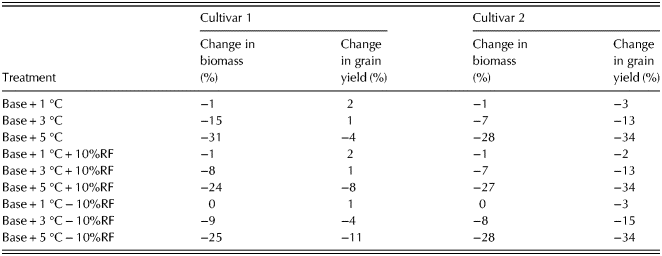
Yield and biomass were reduced when wheat was exposed to elevated temperatures (5 °C) (Table 4). Adoption of different cultivars could have considerable advantages under a warmer future climate because the early-maturing cultivar has shown slightly better yield performance under the future climate in this agro-ecology compared with the experimental cultivar (data not shown). However, yields in the current analysis did not vary significantly among the cultivars due to impacts of climate change (Table 4).
Response of wheat cultivars to rainfall and temperature changes (with unchanged CO2 ) relative to the baseline climate (1980–2009) under optimal fertility (64 kg/ha N) conditions for Hintalo-Wajrat (Adigudom) area, Northern Ethiopia

Cultivar 1, HAR-2501; Cultivar 2, ‘sufi’ short maturing cultivar in APSIM; Base, historical (1980–2009); RF, rainfall. Note that baseline CO2 (350 ppm) was used for this analysis.
Response of wheat to combinations of change in carbon dioxide, temperature and rainfall under sub-optimal and optimal fertilizer conditions
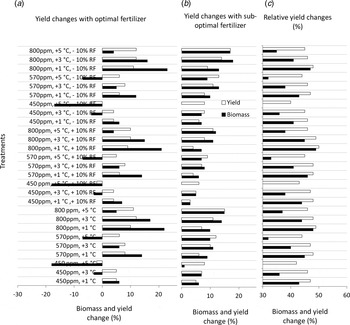
Considering scenarios where CO2 will increase by 100, 220 or 450 ppm and temperature will increase by 1 or 5 °C and no changes in rainfall over their respective baseline data (under sub-optimal fertilizer application condition (16 kg/ha of N), wheat yield is predicted to increase by 5–15%. A 10% increase or decrease in rainfall in combination with the above CO2 and temperature changes resulted in a 6–17% increase in wheat yield relative to the baseline (Fig. 4(b)). The lowest and highest yield increments corresponded to interaction with the lowest and highest CO2 concentration levels.
The effect of various combinations of climate change treatments on yield and biomass of optimally fertilized wheat compared with the corresponding biomass and yield under baseline climate with optimal fertilizer (64 kg/ha N) (a); The effect of various combinations of climate change treatments on yield and biomass of sub-optimally fertilized wheat compared with the corresponding biomass and yield under baseline climate with baseline fertilizer (16 kg/ha N) (b); The effect of various combinations of climate change treatments on yield and biomass change due to application of optimal (64 kg/ha N) relative to sub-optimal fertilizer (16 kg/ha N) (c).

Similarly, considerable yield gains were projected with all increased CO2 concentration levels (by 100, 220 or 450 ppm) and temperature (by 1 or 5 °C) under optimal fertilizer (64 kg/ha N) when compared with yield under the baseline climate with the same fertilizer level. Simulated wheat yield under the corresponding temperature and CO2 combinations increased by 2–12%. The lowest yield increase corresponded to interactions of the highest increase in temperature (5 °C) and lowest increase in CO2 (100 ppm) relative to the baseline. Unlike temperature, higher CO2 levels consistently increased yield. However, changes of ±10% in rainfall under the corresponding temperatures and CO2 levels caused no substantial yield changes. Thus, a change in rainfall of ±10% has less effect on yield compared with temperature and CO2 (Fig. 4(a) and (b)).
Assuming that temperature and CO2 levels will increase relative to the baseline (+1 or 5 °C and +100, 220 or 450 ppm, respectively), wheat yield with optimum fertilizer will increase substantially (by 42–49%) compared with wheat grown under similar climate conditions with sub-optimal N. In both cases, the highest and lowest yield in the range correspond to the low (1 °C) and high (5 °C) temperature treatment interactions, respectively. Generally, biomass and yield showed considerable increases under elevated CO2 level with optimal fertilizer management although elevated temperature had a yield reducing impact. Yield did not change substantially when rainfall was increased or decreased by 10% (Fig. 4(c)).
Impacts of climate change on future wheat yield when simulated based on multi-global climate models and field survey data under baseline carbon dioxide with present and improved management
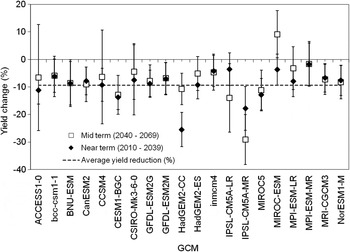
Wheat yield simulation as a function of the multi-GCM outputs showed similarities in terms of trend. Overall, future yield will reduce from the baseline when CO2 is not considered in the simulation (Fig. 5). In such cases, results showed that yield simulations for short- and mid-term were reduced compared with the baseline scenario. However, the extent of yield reduction slightly varied from GCM to GCM. In the current study, yield reduction without effects of CO2 for the short-term was between 2 and 27% (Fig. 5) with an average of 10% (Fig. 5, Table 5). Similarly, yield reductions between 2 and 29% (Fig. 5) were observed for the mid-term period, with an average reduction of 8% (Fig. 5, Table 5). Overall, the model projected little difference in yield between the short-term and mid-term period when CO2 was not considered (Table 5).
Yield changes as simulated based on 20 GCMs using APSIM for short (near)- (2010–2039) and mid-term (2040–2069) periods (under baseline CO2 and baseline management) when compared with baseline (1980–2009) yield.

The impact of climate change with and without adaptation measures on yield of wheat in Hintalo-Wajrat (Adigudom) area of Northern Ethiopia

RCP, representative concentration pathways; baseline yield = 1·15 t/ha. Values in bracket are standard deviations.
* Simulation based on 20-global climate model (GCM) under baseline management.
† Simulation based on 5-GCM with climate change adaptation; note that yield changes are relative to the baseline.
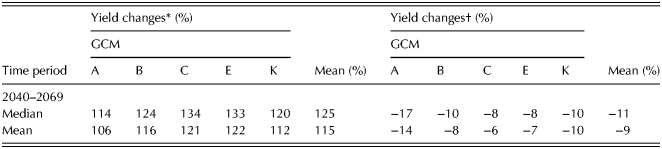
Yield simulation based on baseline CO2 under improved management showed a considerable increase when compared with that of present management (Table 6). Wheat yield with climate change adaptation (simulated based on five selected GCM) during the mid-term scenario showed an average increase of 124% over that without adaptation measures and an increase of up to 115% compared with the baseline yield (Table 6).
Yield changes (%) relative to the baseline under with and without climate change adaptation for the mid-term period under RCP8·5 for Hintalo – Wajrat (Adigudom) area of Northern Ethiopia

GCM, global climate models; A to K are GCMs (A’ = ‘ACCESS1-0’, ‘B’ = ‘bcc-csm1-1’, ‘C’ = ‘BNU-ESM’, ‘E’ = ‘CCSM4’, ‘K’ = ‘HadGEM2-ES’).
* With climate change adaptation.
† Without climate change adaptation.
DISCUSSION
The current study showed that wheat yield may reduce substantially when exposed to temperatures up to 5 °C above the baseline. In agreement with the current findings, other reports have also indicated that the rise in temperature is expected to have a negative impact on crop growth (Wheeler et al. Reference Wheeler, Craufurd, Ellis, Porter and Vara Prasad2000; Ainsworth & Long Reference Ainsworth and Long2005; Cheng et al. Reference Cheng, Sakai, Yagi and Hasegawa2009; Asseng et al. Reference Asseng, Foster and Turner2011; Lobell et al. Reference Lobell, Bänziger, Magorokosho and Vivek2011). One major reasons for the decrease in wheat yield with an increase in temperature in the current study is likely to be due to a reduced length of crop growth period (not shown), which otherwise could have accumulated more biomass from an extended growing period. Some reports have also indicated that elevated temperature between booting (Zadoks growth stage (GS) 40–49), Zadoks et al. Reference Zadoks, Chang and Konzak1974) and anthesis (GS 60–69) reduces yield through reducing grain number and grain weight (Lizana & Calderini Reference Lizana and Calderini2013). Increased temperature (above 30 °C) after anthesis has also been reported to reduce starch concentration (Liu et al. Reference Liu, Guo, Jiang, Pu, Feng, Zhu, Peng, Kuang and Little2011). Other separate simulation studies for effects of temperature on Australian wheat also found significant yield decreases due to quicker leaf senescence, shortening of the grain filling period and increased frequency of high temperature events, above 34 °C, during grain filling (Asseng et al. Reference Asseng, Foster and Turner2011). Early studies also indicated that reduced crop reproductive and grain filling periods and reduced total crop growing period might reduce crop yield (Sofield et al. Reference Sofield, Evans, Wardlaw, Bieleski, Ferguson and Cresswell1974, Reference Sofield, Evans, Cook and Wardlaw1977; Chowdhury & Wardlaw Reference Chowdhury and Wardlaw1978; Goudriaan & Unsworth Reference Goudriaan, Unsworth and Kimball1990). Increased temperatures could possibly increase crop evapotranspiration, which might substantially cause crop water stress and eventually reduce yield. Lalic et al. (Reference Lalic, Eitzinger, Mihailovic, Thaler and Jancic2013) reported that increase of evapotranspiration and drought stress might reduce yield under a changed climate.
According to Anwar et al. (Reference Anwar, O'Leary, McNeil, Hossain and Nelson2007), elevated temperatures in Australia would significantly reduce wheat yield, by 29%, under the projected future climate and might not be compensated by the positive effects of elevated CO2. Trnka et al. (Reference Trnka, Rötter, Ruiz-Ramos, Kersebaum, Olesen, Žalud and Semenov2014) also reported negative impacts of adverse agro-climatic extremes under future European wheat production. However, the sensitivity of wheat to interaction effects of elevated CO2 and temperature levels in the current study showed that negative impacts of elevated temperature (up to 5 °C) in this agro-ecology could be partly compensated by positive impacts of increased CO2 levels.
There was no substantial difference between wheat yield simulated based on RCP scenarios (RCP8·5 and RCP4·5) of the same GCM. Wheat yield was projected to reduce when CO2 was assumed to remain the same as the baseline. Similar studies for some parts of Europe indicated that wheat yield reduced when CO2 concentration was assumed to remain the same as in the baseline (Lalic et al. Reference Lalic, Eitzinger, Mihailovic, Thaler and Jancic2013). In China, climate change without increased CO2 fertilization was projected to reduce wheat yield by up to 10 and 20% by 2080 under B2 and A2 scenarios, respectively (Erda et al. Reference Erda, Wei, Hui, Yinlong, Yue, Liping and Liyong2005). Luo et al. (Reference Luo, Bellotti, Williams and Bryan2005) reported that CO2 had the least impact in determining the fate of future wheat yield compared with rainfall and temperature. In the current study, the model projected little difference in yield between the short-term and mid-term period when CO2 is not considered. Probably the interactions among different factors during the short- and mid-term might be within the ranges under which wheat could be affected by similar effects of higher temperature for this agro-ecology.
Ludwig & Asseng (Reference Ludwig and Asseng2006) indicated that increased CO2 has positive impacts on wheat yield. Other studies reported that the effects of CO2 fertilization vary with water supply and climatic conditions (Ewert et al. Reference Ewert, Rodriguez, Jamieson, Semenov, Mitchell, Goudriaan, Porter, Kimball, Pinter, Manderscheid, Weigel, Fangmeier, Fereres and Villalobos2002). Ewert et al. (Reference Ewert, Rodriguez, Jamieson, Semenov, Mitchell, Goudriaan, Porter, Kimball, Pinter, Manderscheid, Weigel, Fangmeier, Fereres and Villalobos2002) showed that wheat yield increased by 30–65% due to doubling of CO2 with relatively higher effects on yield during drought years. Amthor (Reference Amthor2001) also reported that doubling CO2 increased wheat yield by 31% under optimal nutrient and water availability; however, increased temperature and elevated CO2 resulted in net negative effects (warming counteracted the positive compensating effect of CO2 fertilization). Elevated CO2 slightly improved yield of wheat under water stressed conditions (Amthor Reference Amthor2001).
In the current study, biomass and yield showed considerable increases under elevated CO2 level with optimal fertilizer management conditions, although elevated temperature had a yield-reducing impact regardless of the slight change in rainfall amount. However, results showed that the negative effects of an increase in temperature were compensated when wheat was exposed to elevated CO2. Similar studies in other areas also indicated substantial increase in yield due to CO2 fertilization (Erda et al. Reference Erda, Wei, Hui, Yinlong, Yue, Liping and Liyong2005; Zhang et al. Reference Zhang, Feng, Wang, Wang and Xu2013). Ko et al. (Reference Ko, Ahuja, Kimball, Anapalli, Ma, Green, Ruane, Wall, Pinter and Bader2010) reported that effects of elevated CO2 could be counteracted by elevated temperature while a slight change in precipitation might not cause significant yield changes. Although the magnitude and quantities of compensation differ, the effects of elevated temperature were reported to be mitigated by positive effects of CO2 on wheat yield (Anwar et al. Reference Anwar, O'Leary, McNeil, Hossain and Nelson2007).
Future wheat yields in the semi-arid parts of Northern Ethiopia might be more severely affected by shortage of soil water, especially if the cultivar does not fit with the length of the rainy period. Long dry spells after the mid-season stage (after the cessation of rainfall) was reported to have negative impacts on crop yield (Araya et al. Reference Araya, Habtu, Hadgu, Kebede and Dejene2010a , Reference Araya, Keesstra and Stroosnijder b , Reference Araya, Stroosnijder, Habtu, Keesstra, Berhe and Hadgu2012; Araya & Stroosnijder Reference Araya and Stroosnijder2011).
In the current study, a 10% increase in rainfall did not result in substantial yield change, but in general a 10% decrease did show a tendency to enhance yield. The reason for the slightly better yield when rainfall was decreased by 10% under elevated CO2 might be due to increased photosynthetic efficiency (IPCC 2001; Tao & Zhang Reference Tao and Zhang2013) or reduced stomata conductance, reduced transpiration (increaed water use efficiency) (Amthor Reference Amthor2001; Baldocchi & Wong Reference Baldocchi and Wong2006; Leakey et al. Reference Leakey, Uribelarrea, Ainsworth, Naidu, Rogers, Ort and Long2006; Karl et al. Reference Karl, Melillo and Peterson2009; Ko et al. Reference Ko, Ahuja, Kimball, Anapalli, Ma, Green, Ruane, Wall, Pinter and Bader2010). Although interaction effects of changed climate on wheat yield are non-linear, for areas experiencing moisture deficit, the negative effects of reduced rainfall up to a certain level can be compensated for by positive roles of other interacting factors (Ludwig & Asseng Reference Ludwig and Asseng2006).
Although the magnitude of yield losses due to climate change for the different cultivars assessed were similar (when assessed relative to their corresponding baseline yields), slightly better yield could be obtained from early maturing compared with late or medium maturing cultivars, due to better synchronization of their growth duration to the rainy period. Simulations with early maturing cultivars in combination with optimal planting date and fertilizer application have slightly improved wheat yield. However, the inclusion of cultivar characteristics alone as a climate change adaptation strategy might not result in substantial yield changes under raised temperatures. Although early maturing cultivars might lead to slightly improved yield under rainfed agriculture in semi-arid regions (where the rainy period is too short) they might not be able to produce the desired yield level (potential yield) because they may also be severely affected by other aspects of future climate change. In the current study, the negative impact of climatic change was observed to have similarities in terms of yield changes. Overall, yield for the cultivars under consideration is likely to be moderately reduced if climate change adaptation practices are not used.
In the current study, assuming other factors constant, an increase in temperature under optimal N supply is expected to reduce wheat yield. However, many studies have shown the good performance of wheat under the baseline climate with higher N levels (Mandal et al. Reference Mandal, Hati, Misra, Bandyopadhyay and Mohanty2005; Kibe et al. Reference Kibe, Singh and Kalra2006).
According to Downing (Reference Downing1993), changes to some agronomic practices such as choice of crop/variety, irrigation, soil and water conservation, time of planting, etc. may offset the impacts of climate change. In the current study, the effects of some of these selected management practices that could be easily implemented by local farmers (such as use of optimal planting date, cultivar and fertilizer) were tested and have improved the overall performance of wheat during the mid-term period. This implies that wheat yield reduced by changed temperature could be compensated by application of adequate fertilizer or use of optimal planting dates and other adaptations strategies. Similarly, Balkovič et al. (Reference Balkovič, Van Der Velde, Skalský, Xiong, Folberth, Khabarov, Smirnov, Mueller and Obersteiner2014) reported that future global wheat production can be improved by about 35% through use of better fertilization and could be further improved by 50% through combined use of irrigation and fertilizer application. Similar studies also indicated that there could be positive interaction effects of climatic factors on wheat yield if agronomic practices such as N and water management (Erda et al. Reference Erda, Wei, Hui, Yinlong, Yue, Liping and Liyong2005; Xiao & Tao Reference Xiao and Tao2014), reduced tillage and hedgerows are properly used under future climate change conditions (Thaler et al. Reference Thaler, Eitzinger, Trnka and Dubrovsky2012). Therefore, wheat yield might not be severely affected by the impacts of climate change if adaptation measures such as optimal planting date together with optimal fertilizer are applied.
CONCLUSION
The APSIM model was well calibrated and evaluated to simulate the experimental yield. This was reflected by the satisfactory statistical measures of agreement for simulated phenology and yield of the experimental cultivar. Therefore, the APSIM-wheat model was able to simulate yield of surveyed wheat cultivar under past, current and future climate conditions taking into account soil and crop characteristics and management practices.
Regardless of cultivar, increased temperature by up to 5 °C compared with the baseline substantially reduced the days to maturity (not shown), yield and biomass of wheat. The percent of yield changes due to impacts of climate change did not substantially vary among cultivars although slightly better yields were simulated for the early maturing cultivar.
Assuming temperatures will increase by 1–5 °C and CO2 will increase by 100–450 ppm, and no change in rainfall relative to their respective baseline data (under sub-optimal fertilizer), wheat yield is likely to increase by up to 15%. A 10% increase in rainfall, with the respective increase in CO2 and temperature, will result in an increase in wheat yield by a maximum of 17%. Furthermore, assuming the corresponding increase in the levels of CO2 (100–450 ppm) and temperature (1–5 °C) relative to their baseline data, wheat yield will increase by up to 12% when compared with yield under the baseline climate with optimal fertilizer (64 kg/ha N) level.
Similarly, increased temperatures (1–5 °C) and CO2, (100–450 ppm) with unchanged rainfall relative to their baseline, under optimal fertilizer (64 kg/ha N), caused an increase in wheat yield by at least 42% when compared with wheat grown under sub-optimal N (16 kg/ha N). Similar changes to CO2 and temperature under optimal fertilizer increased wheat yield by at least 43 and 40%, relative to the corresponding sub-optimal fertilizer when rainfall changed by ±10%, respectively. A combination of optimal fertilizer and planting date could further enhance yield by more than 100% in the short- and mid-term period compared with yield simulated based on the baseline climate and present fertilizer management.
Wheat yield over the short term (2010–2039) and mid-term (2040–2069) showed slight reduction (by up to 11%) when compared with the baseline data when yield compensating factors (such as elevated CO2 and other adaptation measures) are not considered.
Generally, a change of ±10% in rainfall had little impact, whereas yield showed substantial increment under the elevated CO2 treatments with optimal fertilizer management. Elevated temperature had a yield reducing impact, however, the negative effects of increase in temperature was compensated when wheat was exposed to elevated CO2.
More research should be done to understand the response of wheat to more climate change adaptation strategies. Recommendations include assessing the response of wheat to CO2 changes in relation to changes in rainfall and temperature under the future climate for different agro-ecologies in the region.
The authors express sincere appreciation to the Agricultural Model Intercomparison and Improvement Project (AgMIP), Rockefeller Foundation project, the Regional Universities Forum for capacity Building in Agriculture (RUFORUM) and the Brazilian National Council for Scientific and Technological Development and for supporting the research financially. AgMIP also deserves appreciation for providing technical and software support.