1. Introduction
Extensive research has been conducted for over half a century to investigate the phenomena of shock wave diffraction, focusing and interactions on various bodies. The pioneering studies by Whitham (Reference Whitham1959), Skews (Reference Skews1967) and Glass (Reference Glass1967), along with the works of Bazhenova, Gvozdeva & Zhilin (Reference Bazhenova, Gvozdeva and Zhilin1980), Hillier et al. (Reference Hillier and Graham1986), Sun & Takayama (Reference Sun and Takayama2003) and Gnani et al. (Reference Gnani, Lo, Zare-Behtash and Kontis2015), have contributed significantly to the understanding of these phenomena. The theoretical framework for predicting shock structures, as they diffract around corners of various bodies, along with the fundamental physical principles governing shock wave diffraction, has been studied extensively and remains well established to this day.
There can be circumstances in which expansion waves diffract over various bodies. The practical relevance of such expansion wave interactions includes scenarios such as sudden rupture of pressure vessels, flow leakage from high-pressure tanks, rapid depressurisation in quench bombs, and quenching of the nozzle plumes for ramjet/rocket-fired artillery shells due to expansion fan interaction in the near-field of the gun muzzle. Another important area where such a phenomenon finds application is in the use of driver inserts (Petersen & Hanson Reference Petersen and Hanson2001; Hong et al. Reference Hong, Pang, Vasu, Davidson and Hanson2009) to achieve long, constant-pressure test times in shock tubes. It was reported that the presence of a body in the driver section increases the test time significantly at the region behind the reflected shock in the driven section. The precise reason for this phenomenon is still unknown, and has not yet been thoroughly investigated. In summary, while the flow characteristics in shock wave diffraction have been studied extensively and well documented, the corresponding diffraction involving expansion waves with various bodies has been comparatively less explored and published. Only a limited number of studies, by Mahomed & Skews (Reference Mahomed and Skews2014), Skews & Paton (Reference Skews and Paton2017) and Whalley & Skews (Reference Whalley and Skews2018), have addressed expansion wave dynamics over various flow configurations to an extent.
Mahomed & Skews (Reference Mahomed and Skews2014) conducted the first fundamental research on the expansion wave diffraction process by experimentally and numerically investigating the expansion wave over the
 $90^\circ$
corner (a forward-facing step with respect to the induced flow). They reported that as the flow establishes around the corner, a shear layer develops and encloses a separation bubble with a vortex core. It was highlighted that the vortex remains attached to the wall, unlike the one developed due to the shock diffraction, where the shear layer rolls up into a vortex and propagates away from the wall. Another significant finding from the numerical results was the observation that as the expansion wave advances across the corner, a reflected compression wave propagates back into the flow. Under optimal conditions, this compression wave coalesced into a shock wave. Nevertheless, the experiment was unable to capture the shock wave that was generated as a result of expansion fan diffraction around the corner. In addition, the experiments revealed turbulent flow characteristics, which were not present in the simulation. Many of these observed flow features of the expansion wave diffraction were not studied thoroughly, and the disparities between simulation and experiment necessitate further investigation.
Skews & Paton (Reference Skews and Paton2017) extended the previous research by including a concave wedge and a two-dimensional cylindrical cavity to investigate the characteristics of shock wave development during the diffraction of expansion waves. This study revealed that a plane expansion wave encountering a change in surface slope in two dimensions could generate embedded shocks near the bodies, and proposed two potential mechanisms for its generation: (i) the coalescence of the compression waves into a shock wave; or (ii) the generation of transonic or supersonic flow in localised regions when a plane expansion wave encounters a change in surface slope. However, the shock wave was not captured in the experimental studies due to difficulties in visualising the flow field in the driver section of the shock tube. Subsequently, Whalley & Skews (Reference Whalley and Skews2018) specifically investigated the propagation and reflection of expansion waves within a cavity. They explored what happens to the flow field when an expansion wave from an upstream tube enters a cavity, and the focusing effect that arises. Different cavity configurations and expansion wave pressure ratios were investigated. Shock waves were observed to form within the cavity when the induced flow encountered a concave surface or a compression corner at the exit of the cavity in the shock tube.
Notwithstanding the investigations conducted in the above studies, the visualisation of the shock waves formed due to the diffracted expansion waves is not verified experimentally. The existence of such shock waves in the flow field is an intriguing aspect of the expansion wave diffraction problem. As such, these shocks can create increased peak pressure loads during the diffraction process. This phenomenon becomes particularly hazardous when a high-pressure combustible gas storage tank is rapidly depressurised, generating expansion waves that travel inwards and interact with various structural components present in the tank. When expansion waves encounter different body configurations, such as obstacles or boundaries, the resulting interactions can cause the generation of intense forces and temperatures. Therefore, understanding this phenomenon in detail is of utmost importance to ensure safety and mitigate potential risks.
Apart from the aforementioned studies, expansion wave diffraction has received little attention, particularly when the expansion waves collide directly with bodies of various configurations. It can also be understood from the above studies that the flow pattern and evolution of shocks in the expansion wave diffraction problem have not been clearly observed or explained due to visualisation limitations and the complexity of the flow field. Hence the current study investigates expansion wave diffraction, its associated flow features, and shock wave development using both experimental and numerical techniques. It also aims to fill the gap in the existing research on the diffraction of expansion waves over different geometries. Thus the primary goal of this research is to investigate and analyse the complex flow patterns and fundamental principles governing the diffraction of expansion waves.
The diffraction behaviour of an expansion wave is governed primarily by two key factors: (i) the shape of the body over which the expansion wave is diffracting; and (ii) the strength of the expansion wave. The strength of an expansion wave interacting with a body can be quantified using two parameters: the diaphragm rupture pressure ratio (DPR), and the distance of the diffracting body from the diaphragm location (DL). For a fixed driver length, DL serves as an indirect measure of the length of the diffracting body. Having identified the geometry and DPRs as the key parameters that influence expansion wave diffraction, we focused our attention on studying the effects of these two aspects. Specifically, we examined:
-
(i) the shape of the diffracting body, which includes a bluff body, a wedge, and an ogive;
-
(ii) the DPRs for the three configurations, which ranged from 2.5 to 20.0.
Through extensive numerical simulations and experimental results, we hope to gain a better understanding of the prominent features of the expansion wave diffraction process as the geometry and DPRs vary.
2. Methodology
2.1. Experimental methodology – shock tube
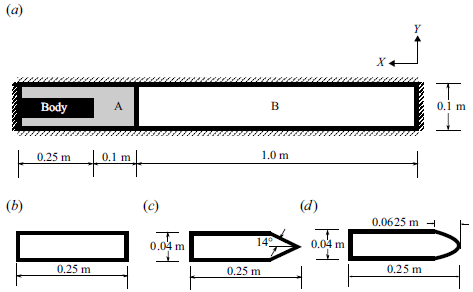
A closed-ended shock tube is specially designed for the current study in the ballistics and high-speed flow lab at IIT Madras, as shown in figure 1(a). The rectangular shock tube with cross-section
 $0.1\,\mathrm{m}\times 0.05\,\mathrm{m}$
consists of two sections: the driver (high-pressure) and the driven (low-pressure) sections of lengths
 $0.35 \,\mathrm{m}$
and
 $1\,\mathrm{m}$
, respectively. Based on the required DPR (
 $P_4/P_1$
), they are separated by aluminium diaphragms of varying thicknesses, corresponding to different DPRs. The driver section of the shock tube is equipped to mount bodies of various configurations, and is also provided with a quartz glass window for visualisation. The models used in the experiments, shown in figure 1(b), are two-dimensional bodies, i.e. extending to the side walls of the driver tube. The driven section length is designed so that the reflected shock wave does not interact with the body in the driver section before the process of expansion wave diffraction is completed. Compressed air is fed into the driver section through a pressure regulating valve, while the driven section is maintained at atmospheric conditions for all cases.
(a) Shock tube facility at the ballistics and high-speed flows laboratory at IIT Madras, designed to study expansion wave diffraction. (b) Schematic of various models used in the driver section.

At the driver section, a 17 bar piezo-resistive kulite sensor is flush mounted to measure the absolute pressure (
 $P_4$
). Two piezoelectric PCB pressure sensors are placed in the driven section at distance
 $0.4\,\mathrm{m}$
from each other, as shown in figure 1(a) for the measurement of shock speed (
 $M_S$
) in the driven section. A time-resolved Z-type schlieren set-up, with a Cavilux high-speed laser as a light source, at pulse width
 $10\,\mathrm{ns}$
, and a high-speed camera (i-SPEED 726), is used to visualise the flow field. Capturing the expansion waves in a shock tube experiment is often quite challenging owing to the extremely small time scale phenomena and the weak nature of expansion waves. The pulsed laser light source of
 $10\,\mathrm{ns}$
pulse width should help in resolving the diffraction of the expansion wave and the ensuing flow field in the driver section. Experimental and numerical studies have been conducted at various DPRs. In all the experimental cases, the bodies are kept at a particular DL, while the DPRs are varied to generate expansion waves of different strengths.
2.2. Numerical methodology
An in-house two-dimensional shock-capturing finite volume code is used to simulate expansion fan diffraction over various bodies. The finite volume code uses a high-order, high-resolution shock-capturing TENO scheme developed by Fu (Reference Fu2019). The TENO reconstruction is preferred over the other types of WENO schemes due to its ENO-like property in identifying the shock and other discontinuities in the stencil and thus choosing between a low dissipative scheme or a high dissipative scheme for the final flux reconstruction. This property of the TENO scheme makes it more robust and attractive to use in the simulations of various flows that involve shock waves and other discontinuities in the flow field. The high dissipative solver used in the present simulations to calculate the flux is an approximate Riemann solver HLLC developed by Toro (Reference Toro2019). The time marching is carried out using a classical Runge–Kutta method (RK-4). The TENO reconstruction is added to the previously validated solver that was used in the works of Reshma et al. (Reference Thara Reshma, Vinoth, Rajesh and Ben-Dor2021) and Paramanantham, Janakiram & Gopalapillai (Reference Paramanantham, Janakiram and Gopalapillai2022).
Schematic of (a) the computational domain with the bluff body at the driver section and three different model configurations: (b) bluff body , (c) wedge and (d) ogive body, used for the current study. Regions A and B are the high-pressure
 $P_4$
(driver) and low-pressure
 $P_1$
(driven) sections, respectively.

The computational domain and the different diffracting bodies placed in the driver section for the present study are shown in figure 2. In the computational domain, the regions A and B denote the driver and driven sections, respectively. The bodies of interest, i.e. the bluff body (a backward-facing step), the wedge (
 $14^\circ$
half wedge angle) and the ogive body, are placed at the far end of the driver section. The length of the diffracting bodies is fixed to be
 $0.25\,\mathrm{m}$
, irrespective of the shape of the body, to maintain the DL distance from the apex at
 $0.1\,\mathrm{m}$
. All sides of the shock tube and the diffracting body are considered inviscid walls. The driver and the driven sections are initialised with the high- and low-pressure air, respectively, based on the desired DPR. The temperature of the air is initialised at a value 300 K across the entire domain. A grid independence study is performed to obtain the grid-independent solution, and the optimal grid size for the time step
 ${\rm d}t = 1.0\times 10^{-6}\,\mathrm{s}$
is determined (see Appendix A for the details).
The numerical schlieren values are derived from the computational results and generated based on the absolute value of the density gradient calculated using (2.1).
 \begin{align} |\nabla {\rho }| = \sqrt {\left (\frac {\partial \rho }{\partial x}\right )^2 +\left (\frac {\partial \rho }{\partial y}\right )^2}, \end{align}
They are subsequently used to compare with the experimental schlieren images. To visualise the smallest and the largest gradients in the flow field, the density gradient is normalised based on the works of Quirk (Reference Quirk1994, Reference Quirk1998), with the normalisation of the density gradient as
 \begin{align} S (x,y) = \beta \exp {\left (-\dfrac {\kappa\, |\nabla {\rho }|}{|\nabla {\rho }|_{{max}}}\right )^2}, \end{align}
where
 $|\nabla {\rho }|_{{max}}$
denotes the maximum value of the density gradient over the entire flow field, and
 $\beta$
,
 $\kappa$
are two adjustable parameters. The shade of grey representing the zero gradient is determined by the parameter
 $\beta$
, which typically takes value 0.8. On the other hand, the parameter
 $\kappa$
controls the amplification of small gradients, and a recommended value of 15 is used to get the optimal results.
3. Results and discussion
This section focuses on investigating the characteristics of the induced flow and other associated flow structures in the driver section as the expansion waves diffract over different bodies, namely the bluff, wedge and ogive bodies.
3.1. Bluff body
The earlier work of Mahomed & Skews (Reference Mahomed and Skews2014) focused mainly on the expansion wave diffraction as it passes over a sharp corner (i.e. forward-facing step). In contrast to previous studies, the present research focuses on the head-on collision of the expansion wave with the bluff body, resulting in a flow that resembles the flow over a backward-facing step.
To examine the effect of the expansion wave diffraction on the bluff body, we have selected DL
 $0.1\,\mathrm{m}$
and DPR 11.30. The choice of the DPR is based on previous studies (Mahomed & Skews Reference Mahomed and Skews2014; Skews & Paton Reference Skews and Paton2017), which have shown that a DPR value greater than 10.4 results in generation of shock waves in the induced flow field due to the expansion wave diffraction. Nevertheless, as mentioned in § 1, the prior studies were not able to capture these shock waves experimentally. One additional consideration in selecting DPR 11.30 is that for DPR values greater than 10.4, the tail of the expansion wave will move towards the driven section (refer to figure 26 in Appendix A). As a result, the expansion wave diffraction will persist until the shock wave in the driven section reflects at the driven tube end and reaches the bluff body. This will ensure continuously expanding flow for the entire test duration, and possibly result in interesting flow phenomena. The results obtained from the shock tube experiment for the bluff body, at DPR 11.30, are compared against those of the numerical simulations. Figure 3 presents the combined schlieren images of the bluff body at different time instants, obtained from both experiment and numerical simulations. The reference time (i.e.
 ${t} = 0\,\mathrm{s}$
) is taken to be the instant when the diaphragm ruptures. Figure 3 shows that the numerical simulation accurately predicts the overall flow characteristics in the induced flow as the expansion wave diffracts, as well as the formation and propagation of vortical structures and the shock waves in the diffracted region, which closely correspond to the observations made in the experiments. Since the numerical results agree very well qualitatively with the experimental results, numerical simulations are used further to investigate the flow physics of the expansion wave diffraction problem.
Combined schlieren images from the experiment (on the top) and the numerical simulation (on the bottom, inverted fashion) for the bluff body, with DPR 11.30.

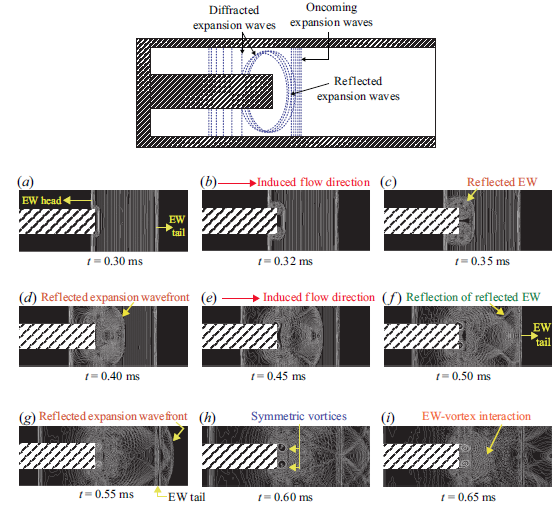
A schematic diagram and the edge-detected time-resolved numerical schlieren images during the initial phase of the expansion wave diffraction process are shown in figure 4. The schematic shows the diffracted waves travelling towards the driver section, and the waves reflected from the bluff body along with the oncoming waves from the DL, as part of the expansion fan diffraction process. At
 $t = 0.3\,\mathrm{ms}$
, the expansion waves are seen to reflect from the edge of the bluff body and also diffract around the corners. Owing to the two-dimensional nature of the bluff body, the reflected waves are cylindrical around the corners. It should be noted that the tail of the expansion wave is moving towards the driven section as the DPR is marginally higher than 10.4 (refer to figure 26 in Appendix A). After
 $t = 0.4\,\mathrm{ms}$
, the reflected expansion waves reflect from the top and bottom walls of the shock tube. Eventually, the reflected expansion wavefront moves towards the driven section and catches up with the tail of the oncoming expansion wave (figure 4
d–f). During this time period, as the induced flow passes over the sharp corner into the sudden expansion region, it curls up to create a pair of symmetric vortices that grow progressively in time. These vortices interact with the oncoming expansion waves, as shown in figure 4(g–i).
Schematic diagram of expansion wave (EW) diffraction pattern for the bluff body, and numerical schlieren images with canny edge detection algorithm for DPR 11.30.

Expansion wave diffraction over a bluff body for DPR 11.30 (numerical schlieren pictures).

Mach number–pressure ratio variation along the
 $x$
direction at
 $y$
location
 $0.085\,\mathrm{m}$
from the bottom wall of the shock tube for a time instant
 $t= 1.25\,\mathrm{ms}$
(figure 5
g).

Normalised velocity profile in the
 $y$
direction for different time instants, 20 mm away from the bluff body tip.

Figure 5 shows the numerical schlieren images obtained for the same DPR to facilitate a better understanding of the flow field development after the expansion waves diffract over the bluff body. Initially, when the diaphragm breaks, the head of the expansion fan moves into the driver section and diffracts over the bluff body, while the generated shock wave moves into the driven section. Therefore, the air in the driver section starts to accelerate towards the driven section. Figure 5(a)–5(d) show the numerical schlieren images of the expansion waves diffraction process during the initial time period. In addition to the flow evolution process, the numerical schlieren are qualitatively similar to the experimental expansion wave diffraction patterns observed (refer to figure 3). At later times (i.e.
 $t = 0.5{-}0.85\,\mathrm{ms}$
), as seen in figure 5(c)–5(e), the vortical structures continue to grow in size due to further acceleration of the induced flow. Even though the flow resembles that of a sudden expansion over a backward-facing step in earlier time instants, it becomes quite distinct at later times. As the expansion wave further moves into the driver section, the induced flow at the sharp corner of the bluff body reaches supersonic velocities, creating a centred Prandtl–Meyer expansion fan, as seen in the numerical schlieren at time
 $t = 1.10\,\mathrm{ms}$
(refer to figure 5
e,f). After time
 $t = 1.10\,\mathrm{ms}$
, the vortices start to break down, and the flow exhibits complicated wave interactions, as shown in figure 5(f)–5(h).
At time
 $t = 1.25\,\mathrm{ms}$
, the non-dimensionalised pressure and the Mach number of the induced flow across the portion of the driver section (i.e.
 $x=1.2{-}1$
) at
 $y=0.085\,\mathrm{m}$
from the bottom of the shock tube are shown in figure 6. The drop in the pressure across the centred expansion fan and the increase in the Mach number are evident in figure 6. The appearance of the centred expansion fan also correlates to the appearance of another wave in the induced flow field near the recirculation vortices, which can be seen in figure 5(f). Figure 6 further corroborates that the wave in the flow field is a shock wave as the pressure increases and the Mach number decreases across it. Henceforth, this shock wave will be termed the induced shock in this paper. The occurrence of the induced shock waves within the induced flow field created by the expansion waves over the body is clearly seen in both experimental observations and computational simulations (refer to figure 3(c–e) and figure 5(f–o)). At time
 $t \geqslant 1.55\,\mathrm{ms}$
, the reflected expansion wave from the driver end of the shock tube starts interacting with the recirculation region, which later leads to the development of a complex and intricate flow field due to the breakdown of the recirculation vortices. Due to these complicated flow interactions and interfaces, the induced shock splits into multiple shock waves and moves into the driver section. The reason for the generation of these shock waves in the induced flow seems to stem from the breakdown of the vortices in the recirculation region. From times
 $t= 1.55{-}3.00\,\mathrm{ms}$
, the strength of the centred expansion fan reduces, which can be seen in the numerical schlieren shown in figure 5(h)–5(i). During this time, i.e.
 $t \geqslant 1.55\,\mathrm{ms}$
(refer to figure 5
j–l), the induced shock waves travel into the driver section as the pressure drops due to the reflected expansion waves (from the driver wall). This process is analogous to what happens in the shutdown process of a supersonic nozzle. The movement of the shock waves into the driver section can be attributed to the drop in pressure created by the expansion wave from the driver end. The movement of the induced shock varies between the top and bottom surfaces of the bluff body (see figure 5(l–o) and figure 8) owing to the asymmetric nature of the vortex breakdown phenomenon.
Numerical schlieren with the pressure plot along the
 $x$
direction at two different
 $y$
locations for time instant
 $t= 4\,\mathrm{ms}$
with DPR 11.30 over the bluff body.

A recirculation region is created due to the expansion wave diffraction as the induced flow passes over the sudden expansion at the top and bottom corners of the bluff body. To understand the nature of the recirculation zone, we have plotted the non-dimensional velocity
 $({{U}/{U_{max}}})$
, extracted at a line 20 mm from the tip of the bluff body, versus the non-dimensional
 $y$
distance
 ${(y/D)}$
in figure 7. Initially, when the expansion wave collides with the bluff body, a velocity difference is created between the flow induced by the unaffected expansion wave moving towards the driver end wall and that by the expansion waves reflected off the bluff body. This change in the velocity, driven by the expansion wave diffraction, creates shear layers with symmetric vortices at the top and bottom corners of the bluff body, subsequently leading to the formation of recirculation bubbles in front of the bluff body. This can be seen in figure 5(f), in which at initial times, the recirculation bubbles are symmetrical at the top and bottom sections of the bluff body. As time progresses, the Kelvin–Helmholz instability vortices in the shear layer formed at the top and bottom corners of the bluff body face grow in time, creating a blunt body effect in the supersonic flow leading to the development of the induced shock. This can be observed clearly in figure 5(f), where the induced shock is created by the shear layer vortices in the supersonic flow induced by the expansion wave travelling at the top and bottom sections of the bluff body. Figure 7 shows this trend clearly, i.e. at initial times (until
 $t = 1.25\,\mathrm{ms}$
), the
 $({{U}/{U_{max}}})$
plot is symmetric, and it becomes asymmetric as time progresses (after
 $t = 1.55\,\mathrm{ms}$
; refer to figure 5
h). Furthermore, these asymmetric vortices break down and generate a complex flow field in the recirculation region. The exact mechanism of this recirculation vortex breakdown is not known at present, and further research is needed to bring out the physics. One hypothesis from our observation is that the reflected expansion waves from the driver end of the shock tube always amplify the instabilities, i.e. the arrival of the reflected expansion wave from the driver end at the bluff body corner coincides with the asymmetric vortex breakdown.
Mach number and pressure time series plot for DPR 11.30 for the bluff body at point P,
 $20\,\mathrm{mm}$
away from the bluff body tip.

The breakdown of the vortices is accompanied by the propagation of induced shock waves into the driver section. The induced shock motion exhibits an asymmetry in the top and bottom surfaces due to the uneven breakdown and shedding of the vortices, as described in § 3.1. Figure 8 shows the plot of non-dimensional pressure along the induced shock waves in the upper and lower surfaces of the shock tube. The data are obtained at specific
 $y$
locations equidistant from the midplane of the shock tube for a particular time instant
 $t= 4\,\mathrm{ms}$
. The asymmetric flow field and the subsequent asymmetric movement of the induced shock waves on the top and bottom surfaces are clearly seen in figure 8.
To summarise the events in the recirculation zone, a time series plot of non-dimensional pressure and Mach number is taken at the particular point P located at horizontal distance
 $20\,\mathrm{mm}$
from the tip of the bluff body and vertical distance
 $85\,\mathrm{mm}$
from the bottom wall of the shock tube, as shown in figure 9. The time series plot shows that the Mach number increases with pressure reduction at P due to the passage of the expansion waves into the driver section during time
 $t= 0.35{-}1.55\,\mathrm{ms}$
. During this reduction in pressure, the induced shock and associated flow patterns develop that affect the pressure and Mach number at P. At later times, the reflected expansion wave interaction with this wave pattern developed over the shear layer reduces the Mach number of the induced flow and pressure at location P during
 $t= 1.55{-}3.5\,\mathrm{ms}$
. Further interaction with the expansion wave and the shear layer makes the induced shock further move into the driver section, which can be seen in figure 9. The time instants (approximately
 $t= 3.5{-}4.0\,\mathrm{ms}$
) at which the induced shock reaches point P can also be correlated with the numerical schlieren images shown in figure 5(m,n).
3.1.1. Effect of different DPRs
Numerical schlieren images for different DPRs for the bluff body at
 $t= 4\,\mathrm{ms}$
.

(a) Mach number–time series plot at a particular point P above the shear layer at distance
 $20\,\mathrm{mm}$
from the bluff body tip for different DPRs. (b) Pressure ratio (
 $P/P_4$
) versus flow time (
 $t$
) plot at a particular point Q near the driver section end.

In a shock tube (as shown in figure 5 a), the head of the generated expansion waves always travels from right to left into the driver section, while the tail of the expansion waves can move either towards or away from the driven section, depending on the DPR. Therefore, for any particular shape of the diffracting body, the nature of the expansion wave diffraction and the extent of its interaction are also determined by the DPR. The flow characteristics are expected to vary significantly with DPR because the diffraction of the expansion wave across various bodies will produce a variety of wave systems. To analyse the impact of different DPRs on the diffraction of expansion waves, simulations were conducted for DPRs ranging from 2.5 to 20. The diaphragm is located at DL 100 mm in all cases.
The present parametric investigation of the expansion diffraction problem for different DPRs is highly relevant to show the dependence of the induced shock evolution in the diffracted flow region. Figure 10 illustrates the numerical schlieren images of the evolved flow fields due to diffraction of expansion waves over a bluff body for various DPRs at
 $t= 4\,\mathrm{ms}$
. The extent of the expansion wave interaction with the body decides the strength of induced shock and its direction of motion. Starting from time
 $t=0\,\mathrm{s}$
, at lower DPR (where the expansion diffraction stops after finite time), it is noted that the induced shock takes less time (henceforth referred to as the shock arrival time) to move towards the driver section compared to the higher DPRs, where the expansion wave diffraction persists for a longer duration.
The non-dimensional pressure at a particular point Q (50 mm from the driver end wall) in the driver section has been plotted as a function of time to illustrate the movement of the induced shock towards the driver section. As shown in figure 11(b), the pressure continuously drops at Q, first due to the incoming expansion waves and diffracted expansion waves, and later due to their reflection from the driver end. It is seen that the non-dimensional pressure drop in the driver section remains identical across all the DPRs.
Despite the fact that the pressure drop caused by the expansion wave is greater for larger DPRs and smaller for lower DPRs, it is counter-intuitive that the induced shock in the driver section formed by the expansion wave interaction travels back into the driver later for larger DPRs and earlier for smaller DPRs, i.e. longer and shorter shock arrival times for larger and smaller DPRs, respectively. At
 $t=4\,\mathrm{ms}$
, as shown in figure 10, the flow features remain identical after DPR 17.5.
Figure 11(a) shows the Mach number variation at point P, located 20 mm from the tip of the bluff body. It illustrates that the Mach number at point P is greater in the scenario where the bluff body is present (solid lines) in the driver section, as opposed to the scenario where it is absent (dashed lines) for all DPRs. The reason for this phenomenon is as follows. For a shock tube without any driver inserts, the number of expansion waves generated varies with respect to the DPR. It should be noted that the head of the expansion wave travels at the same velocity into the driver, irrespective of the DPR, as it depends only on the temperature of the high-pressure air in the driver (300 K in the present case), whereas the direction and speed of the tail depend on the DPR.
Therefore, at lower DPRs, the extent of acceleration of the induced flow occurs only during a specific time period, after which the properties remain constant, as seen in the case of the no-insert curves (dashed lines) in figure 11(a). But for cases with a bluff body as the driver insert, due to expansion wave diffraction, the induced flow continues to accelerate until a particular time (approximately
 $t= 1.55\,\mathrm{ms}$
) when the reflected expansion waves from the driver tube end wall start to decelerate the flow (as marked in figure 11
a). For all the DPRs, the deviation in the Mach number from the no-insert case occurs when the diffracted expansion wave starts to interact with the oncoming expansion wave at the point P (corresponding to time
 $t= 0.35\,\mathrm{ms}$
in the edge detected contours in figure 4(c) and the Mach number plot in figure 11(a)). Apart from the diffracted expansion wave at point P, the developing shear layer (refer to figure 3
c,d) due to the sudden expansion region also contributes to the increase in the Mach number. The shear layer accelerates the induced flow as it grows over time and thus increases the flow Mach number. At lower DPRs, i.e. DPR less than 5, the flow accelerated by the shear layer is subsonic (
 $M\lt1$
), whereas for DPR greater than 5, the flow Mach number increases and achieves supersonic values. This can be observed from the presence of a centred expansion wave at the tip of the bluff body, as shown in the case for DPR 11.30 in figure 5(f)–5(h).
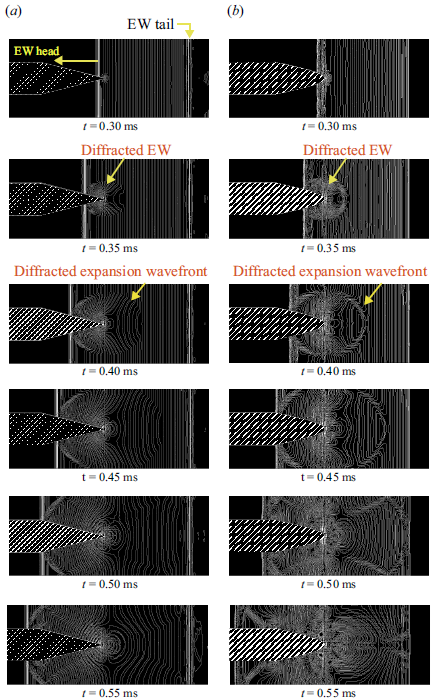
Expansion wave diffraction pattern for (a) wedge and (b) ogive bodies, obtained from numerical schlieren images using the canny edge detection algorithm for DPR 11.30.

Furthermore, it is found that at P, for DPR
 ${\gt 2.5}$
, localised supersonic flow is established, as seen in figure 11(a). It is not accidental that the induced shocks in an expansive flow field with a bluff body driver insert also occur after DPR
 $2.5$
. This demonstrates that for the generation of the induced shock in the expansive flow field, the induced flow must be supersonic. It is noteworthy that even for DPR 20, without a driver insert, the flow acceleration does not lead to supersonic Mach numbers. Therefore, the formation of induced shock and its movement is a salient feature of driver inserts and expansion wave diffraction. Moreover, it is clear that the changes in the DPR affect both the structure and the development of the induced shock in the diffracted flow region. The above discussion highlights that the blockage effect of the insert may play a role in attenuating or amplifying the expansion wave diffraction, similar to the driver insert length. However, in the present study, we have chosen to focus on the effect of the DPRs on the expansion wave diffraction, as this represents the primary driving force. A brief overview of the blockage effect is provided in Appendix B.
3.2. Wedge and ogive bodies
In this subsection, expansion wave diffraction is studied on more aerodynamic bodies, namely the wedge and ogive body configurations, compared to that of the bluff body. The configurations of the wedge and ogive-shaped bodies used for the study are shown in figures 2(c) and 2(d). In both cases, the length of the diffracting bodies remains unchanged, thereby maintaining the diaphragm at a constant location (i.e. DL 100 mm from the tip of the diffracting bodies). Figure 12 gives the edge-detected numerical schlieren images, showing the expansion wave diffraction phenomenon over the wedge and ogive driver inserts. It is observed that the expansion waves diffract from the tips of the bodies as an elliptical wavefront that grows in time. Similar to the bluff body, the diffracted expansion waves reflect back and from the top and bottom walls of the shock tube at
 $t= 0.45\,\mathrm{ms}$
. Note that the diffracted expansion waves from the wedge move faster towards the driven section than those of the ogive body, to catch up and eventually overtake the tail of the expansion waves generated during the diaphragm rupture (refer to
 $t= 0.55\,\mathrm{ms}$
in figure 12).
Expansion wave diffraction over a wedge for DPR 11.30 (numerical schlieren pictures).

To identify and differentiate the flow features of the wedge from that of the bluff body, the numerical schlieren of the entire flow for DPR 11.30 are shown in figure 13. Initially, as the diaphragm ruptures, the expansion wave, contact surface (CS) and shock wave (SW) are generated and shown in figure 13 at
 $t = 50\,\mu$
s. As the expansion waves propagate into the driver section, they undergo diffraction as they encounter the wedge (as shown in figure 12(a) and also highlighted in figure 13(c)). It should be noted that there is no separated flow or shear layer development (refer to figure 13
b–d) as the shape of the body is streamlined. The flow induced by the expansion fan gradually accelerates to supersonic velocities, resulting in the formation of the centred expansion fan at the shoulder of the wedge as shown in figure 13(d,e). The induced flow expands further as it passes through the centred expansion fan, leading to a supersonic patch terminated by a weak shock. This weak shock grows in strength as the flow accelerates further through the centred expansion fan at the wedge shoulder (refer to figure 13
f–h). The weak shock wave is seen to be propagating as a Mach reflection on the top and bottom walls (refer to figure 13
e,f). The centred expansion fan interacts with the weak shock wave and weakens it significantly, resulting in the shock curvature seen in figure 13(f). Also, near the tip of the wedge, the induced flows from the top and bottom meet and turn into each other. This is achieved through compression waves at the vicinity of the tip (refer to figure 13
g,h). When the flow becomes more supersonic, the weak shock wave is pushed away from the shoulder. As the weak shock wave moves closer to the wedge tip, it merges with the compression waves to form the induced shock wave, as shown in figure 13(g)–13(j).
Expansion wave diffraction over an ogive body for DPR 11.30 (numerical schlieren pictures).

Visualising the expansive flows over a wedge and the shock wave developed within the expansive flow was difficult due to experimental limitations (Skews & Paton Reference Skews and Paton2017Skews). The diffraction of the expansion wave over the wedge surface leads to the formation of an induced flow that travels across the wedge corner at supersonic velocities. As the diffraction of the expansion wave persists, the flow accelerates and resembles the unsteady flow around a convex corner investigated by Tugazakov (Reference Tugazakov2007), who numerically observed the presence of weak shock waves in the region downstream of the centred expansion wave in the flow field, and that the disturbances get propagated downstream of the convex corner. That study also included analytical derivation of the criteria for the separationless flows, which depend on the wedge angle. For the case of wedge angle
 $14^\circ$
, the Tugazakov (Reference Tugazakov2007) numerical simulation predicted a separationless flow over the wedge, which correlates well with the induced flow features in the expansive flow over the wedge in our case as well (refer to figure 13).
Numerical schlieren along with the pressure plot at
 $t= 4\,\mathrm{ms}$
along the
 $x$
direction for DPR 11.30 over (a) wedge body and (b) ogive body.

For the ogive body, the simulation predicts flow features analogous to that of a wedge, as shown in figure 14. After the expansion waves diffract over the model, a flow is induced and accelerated to supersonic velocities, and the induced shock is generated. Similar to the wedge, the ogive model also has a sharp shoulder where a centred expansion fan expands the flow further, creating a supersonic patch terminated by a weak shock wave (refer to figure 14 f). In this case as well, as the flow develops, the weak shock becomes stronger and moves downstream, while the compression waves at the tip of the body strengthen to form a recompression shock. A strong induced shock is formed after the weak shock merges with the recompression shock. At later times, the upstream pressure drop causes the induced shock to move further into the driver section.
The left-moving induced shocks at the top and bottom sections of the wedge and ogive bodies appear to be travelling symmetrically, in contrast to the bluff body case. This might be because of the absence of the recirculation vortices in the flow field. It is evident from figure 15 that both the induced shocks (on top and bottom) are of a symmetric nature, unlike the asymmetric ones found in the bluff body simulations (refer to figure 8). The induced shock is seen to start moving back into the driver after
 $t= 2\,\mathrm{ms}$
in the wedge case, whereas in the ogive case, it occurs after
 $t= 1.8\,\mathrm{ms}$
. Although the induced shock in the ogive case starts its leftward motion early, it does not reach the shoulder of the body until
 $t= 3.2\,\mathrm{ms}$
. In comparison, the induced shock of the wedge body reaches the shoulder at
 $t= 2.9\,\mathrm{ms}$
. One of the reasons for this difference can be attributed to the location from where the induced shock starts its leftward motion. In the ogive body, the induced shock almost reaches the tip of the body, unlike the wedge, hence it has to traverse a longer distance over the body to reach the shoulder. Moreover, the coalescence of the weak shock with the recompression shock to form the induced shock wave occurs farther from the shoulder of the ogive body when compared to the wedge body case (refer to figure 13(g–i) and figure 14(g–i)). It should be noted that the shoulders are located at the same distance from the tip of the body in both cases.
The non-dimensional pressure and Mach number time series (extracted at
 $x$
location
 $20\,\mathrm{mm}$
from the shoulder) for the wedge flow are shown in figure 16(a). The plot shows sudden jumps in the pressure and the Mach number as the shock waves move over point R.
Mach number and pressure time series plot for DPR 11.30 extracted at location
 $20\,\mathrm{mm}$
from the body’s shoulder, for (a) wedge body and (b) ogive body.

For the wedge body at point R, the changes in pressure and Mach number across the weak shock are not observed, as the shock forms downstream at point R. However, in the case of the ogive body, it is evident that at point R, the weak shock just barely makes contact, as illustrated in figure 16(b).
Also, the duration of the induced supersonic flow is more in the case of the ogive body configuration as the induced shock wave is moved back towards the driver end within a shorter time period (approximately
 $2.5\,\mathrm{ms}$
) in the wedge case, compared to that of the ogive case (approximately
 $3\,\mathrm{ms}$
). This implies that the combined effect of diffracted and reflected expansion waves in reducing the pressure near the DL in the driver section is more predominant for the wedge.
The induced flow characteristics over the wedge body look analogous to the nozzle-starting process caused by the rapid rupture of a diaphragm, as found in a Ludwieg tube with a downstream diaphragm. Based on the expansion wave diffraction over wedge and ogive bodies, it is noteworthy that expansion wave diffraction over smooth bodies also generates induced shock waves within the flow field. This phenomenon holds particular significance in the design of Ludwieg tubes, where the generation of induced shock waves can impact the flow quality and increase turbulence intensity, as the the expansion wave diffracts over the nozzle in the Ludwieg tube. The present work demonstrates that the effect of these induced shocks and the resulting expansion–diffracted flow field resembles the initial transient stage within the Ludwieg tube. However, some discrepancies do exist due to the shorter driver length in the shock tube employed in the current investigation, resulting in leftward shock movement, while this does not occur in the Ludwieg tube due to its longer driver section. The flow in the Ludwieg tube is caused predominantly by nozzle expansion, whereas the wedge/ogive body undergoes external diffraction effects that result in complicated wave interactions. As the flow progresses to its advanced stages, these distinctions provide diverse flow structures and behaviours. Therefore, we conclude that the initial transient phase can generate these induced shocks in the flow field, although the effects on the final result have not yet been determined through parametric studies of driver length and geometry configurations.
3.2.1. Effect of different DPRs
Numerical schlieren images for different DPRs for (a) wedge body and (b) ogive body at
 $t= 4\,\mathrm{ms}$
.

Mach number time series plot for different DPRs for (a) wedge and (b) ogive bodies at location
 $20\,\mathrm{mm}$
from the body’s shoulder.

The variation of the expansion wave diffraction for different DPR values ranging from 2.5 to 20 is studied for both the wedge and ogive configurations. The DL is held constant at
 $100\,\mathrm{mm}$
, similar to the bluff body. The comparison of the flow fields is carried out at time
 $t= 4\,\mathrm{ms}$
for both the wedge and ogive configurations, as shown in figures 17(a) and 17(b). The particular time instant is chosen based on the discussion on the bluff body in § 3.1.1. When the induced shock starts travelling towards the driver section end (i.e. leftward movement), the induced flow behind the shock will change direction to that of the shock propagation (refer to DPR 15.0 in figure 17
b). Upon reflection from the end wall of the driver, as the shock wave travels rightwards to the body shoulder, it encounters this previously leftward travelling induced flow (see DPR 7.5 in figure 17
b). To simplify the explanation, it can be stated that during the formation of the induced shock wave, the flow is directed to the right both before and after the shock. However, during the transient phase, the flow decelerates and eventually reverses direction due to the combined effects of induced shock movement and expansion wave diffraction.
Similar to the bluff body, the leftward movement of the induced shock starts earlier at a lower DPR for both configurations. At the same time (
 $t= 4\,\mathrm{ms}$
), numerical simulations show two different behaviours of the induced shock wave. In the wedge and ogive configurations, the induced shock wave reflects from the driver end wall, while in the bluff body configuration, it is still moving towards the driver end wall for DPRs above 2.5. An interesting finding from the numerical schlieren images in figure 17(a,b) is that for the wedge and ogive body configurations, once the DPR increases beyond 5, the nature of the flow field remains the same except for the time of arrival of the induced shock wave at R (also evident form the Mach number time series plot shown in figure 18
a,b). It is to be noted that the arrival time of the shock at point R remains constant after DPR 10.4, which can be attributed to the fact that DPR 10.4 corresponds to the special value at which the tail of the expansion wave almost remains at the DL. Increasing the DPR value further will cause the tail of the expansion waves to move right into the driven section, while the expansion waves heading towards the driver section stay the same. This implies that the expansion waves will keep on diffracting until the reflected shock wave from the driven end reaches the diffracting body, unless the length of the driver section changes. Comparing the wedge and ogive configurations, the induced shock moves earlier towards the driver end wall in the case of the wedge. The delay in the case of the ogive body may be due to the formation of small shear layers on the ogive body nose similar to that on the bluff body (refer to figure 17
a,b). It is also worth noting that the induced shock motion towards the driver end wall is delayed the most for the bluff body and occurs earliest for the wedge shape due to the strong shear layer development in the former and the negligible shear layer development in the latter. It is also noted that similar to the bluff body, the induced shock or other wave interactions are absent for DPR 2.5 for both wedge and ogive configurations due to the absence of the localised supersonic flow field.
3.3. Shock observation at low DPRs
It is observed from numerical simulations that even at low DPRs, the induced flow in the driver region is accelerated to supersonic velocities because of the diffracting body’s presence, leading to the formation of induced shocks in this expansive flow field.
To visualise these shock formations, experiments are conducted for the bluff, wedge and ogive bodies separately for DL
 $100\,\mathrm{mm}$
at DPR
 $\lt 10.4$
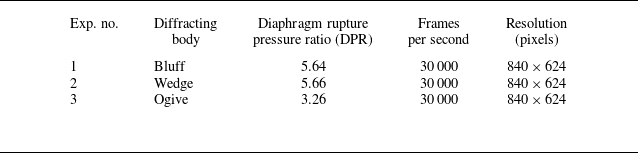
. From the experiments conducted, three DPRs, 5.64, 5.66 and 3.26, are shown for the bluff, wedge and ogive bodies, respectively. The details of the experimental conditions and schlieren imaging are given in table 1. It should be noted that the shock structures observed in both experiments and inviscid numerical simulations are similar (shown in figures 19, 20 and 21), indicating that the viscous effects do not significantly affect the shock dynamics in the driver section.
Experimental details of the different cases.

Combined schlieren images from the experiment (on the top) and the numerical simulation (on the bottom, inverted fashion) for the bluff body at DPR 5.64.

Combined schlieren images from the experiment (on the top) and the numerical simulation (on the bottom, inverted fashion) for the wedge body at DPR 5.66.

Combined schlieren images from the experiment (on the top) and the numerical simulation (on the bottom, inverted fashion) for the ogive body at DPR 3.26.

3.4. Application as driver inserts
Experiments involving high-temperature chemical kinetics, such as measuring ignition delay times, species concentration time histories, and determining reaction rates, are frequently conducted in shock tubes behind the reflected shock wave in the driven section. Ideally, the temperature and pressure in the region behind the reflected shock wave do not vary with time. On the other hand, incident-shock attenuation, diaphragm-bursting process and other non-ideal phenomena involved in shock tube experiments can cause the pressure behind the reflected shock wave near the end wall to vary gradually. These changes in pressure are accompanied by changes in temperature. Regrettably, inaccuracies in the reaction temperature during chemistry measurements in a shock tube might result in significant uncertainty in the rate coefficient or ignition delay time. So it is necessary to minimise uncertainties in the shock tube test pressure variation. Numerous methods have been devised to achieve prolonged, constant-pressure test duration in such experiments. One such approach involves the utilisation of an insert within the driver section of the shock tube. The studies of Petersen & Hanson (Reference Petersen and Hanson2001) and Hong et al. (Reference Hong, Pang, Vasu, Davidson and Hanson2009) found that the usage of driver inserts has an impact on achieving extended reflected shock test times. For the ideal case study without any driver inserts, the pressure remains constant, but in non-ideal cases, due to the related effects, these studies have reported an increase in pressure. The addition of a driver insert (an ogive) in the previous studies reduced this pressure rise, and were able to get a few additional times in test runs. However, the fluid dynamic phenomenon causing this effect was not explained. As the pressure behind the reflected shock is of interest to the above applications, numerical simulations are done in the present study with and without inserts in the driver section of the shock tube, and the pressure is measured at a point S located
 $50\,\mathrm{mm}$
from the driven section end wall, as shown in figure 22. The pressure profiles for various configurations or driver inserts along with the base case (without any driver insert) for different DPRs ranging from 2.5 to 20 are shown in figure 22. It should be noted that all the simulations are carried out for ideal cases only, with air as the operating fluid in both the driver and driven sections. The first pressure peak in the plot corresponds to the pressure jump across the reflected shock wave (moving left) in the driven section, and the second one corresponds to the pressure jump by the reflection of this reflected shock (moving right) from the contact surface. For lower DPRs, the reflections from the contact surface take more time when compared to higher DPRs. At higher DPRs (above 10.4), the expansion tail characteristics also travel towards the driven section.
Comparison of pressure profiles with and without driver inserts for different DPRs at location S.

When compared to the case without an insert in the driver section, the presence of a body in the driver section is observed to reduce the pressure behind the reflected shock wave. Therefore, in order to minimise the non-ideal pressure rise behind the reflected shock wave, a driver insert is an optimum solution. It has also been observed that for the bluff body case, this drop in the pressure behind the reflected shock is greater when compared to the other shapes. From the discussion in the above sections, it is now clear that the reflected and diffracted expansion waves reaching the driven end of the shock tube are the reason behind this pressure drop. In cases without driver inserts (where there is no expansion wave diffraction), the pressure reduction in the driven section depends solely on the tail of the expansion wave, which may or may not reach the end of the driven section in the required time before interacting with the reflected shock wave from the tube’s end, depending on the DPR. Between the wedge and ogive bodies, for smaller DPRs, the pressure reduction with respect to the no-insert case is small for a wedge driver insert. Therefore, a properly designed body configuration, according to the non-ideal pressure rise of the shock tube, can minimise the pressure rise behind the reflected shock to get a longer run time for the studies involving high-temperature chemical kinetics. The trend in figure 22 shows that for the same length of the driver inserts, the more slender the body, the lesser the pressure reduction owing to lesser expansion wave reflection/diffraction.
4. Conclusion
Expansion wave diffraction over bodies of various shapes has been studied both experimentally and numerically in this work. It is shown that with the presence of a body in the driver section, the induced flow can achieve supersonic velocities at lower DPRs. The induced supersonic flow produces interesting flow features and shock structures. Shock generation in expanding flows is visualised experimentally in all the test cases properly for the first time, matching with the numerical simulations very well. The flow features and the formation of induced shocks are highly dependent on the diaphragm rupture pressure ratio (DPR), which determines the extent of expansion wave diffraction on a given body. From the observed results, two critical DPRs are identified.
-
(i) Above DPR 2.5, the induced flow becomes supersonic with the presence of a body in the driver section due to expansion wave diffraction. Induced shocks are possible only in such expansive flows.
-
(ii) Above DPR 10.4, indefinite expansion wave diffraction occurs over the body until terminated by the reflected shock wave from the driven section. The flow features become almost independent of DPR, depending on the type of diffracting body.
Upon comparing the results for different body configurations at DPR 11.30, the flow evolution was seen to be in the following order: (i) the expansion waves diffract over the body, expediting the acceleration of the induced flow to supersonic velocities; (ii) the induced flow generates induced shock waves to match the pressure conditions downstream; (iii) gradual reduction in driver pressure due to the expansion wave propagation makes the induced shock travel towards the driver end wall. Significant differences in flow features emerged in the bluff body owing to the formation, evolution and break up of recirculation vortices in the wake region when compared to the other two shapes. This led to asymmetry about the midplane, and complex flow pattern for the bluff body case compared to the symmetric flow pattern seen in the more aerodynamically shaped wedge and ogive bodies.
The presence of a body in the driver section (driver inserts) creates a pressure drop behind the reflected shock in the driven section. The application of these bodies as driver inserts can solve the major problem of pressure rise behind the reflected shock in non-ideal shock tube experiments, thereby achieving more test time with constant pressure in studies related to chemical kinetics.
Declaration of interests
The authors report no conflict of interest.
Appendix A. Grid independence study and x-t wave diagrams for different DPRs
Numerical schlieren image along with the variation of pressure in the x direction for three different grids at y = 0.85 % of domain height and t = 1.55 ms, with DPR 11.30, for the various body cases.

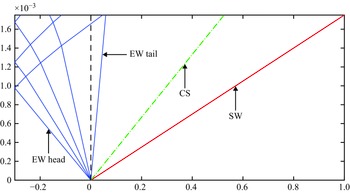
The grid convergence study is carried out using three different grids with uniform grid spacing ranging from 0.5 mm to 2 mm in both x and y directions for the bluff body case. The grid convergence study is carried out for DPR 11.30. The optimum grid is found to be the one that resolves the fluid features without too much computational resource. Figure 23 shows the variation of pressure in the x direction for three different grids at 0.85 % of domain height and t = 1.55 ms. The figure demonstrates comparable variation in the pressure values in the expansion region at the driver section between the grid with spacing 1 mm and 2 mm, and no such variations in the pressure data for the grid with 0.5 mm and 1 mm spacing. Therefore, the grid with 1 mm spacing is chosen as the optimised mesh for the present numerical simulations. The x-t wave diagram for the current shock tube without the diffracting body is drawn for the DPRs taken for the experiment test cases as shown in figures 24, 25 and 26.
The x-t wave diagram for DPR 3.26 (without any diffracting body).

The x-t wave diagram for DPR 5.66 (without any diffracting body).

The x-t wave diagram for DPR 11.30 (without any diffracting body).

Appendix B. Influence of insert blockage area on expansion wave diffraction in the bluff body case
Insert blockage is an important parameter for the expansion wave diffraction phenomena, which comes under the factor of the diffracting body shape. The amount of the incident expansion wave’s reflection and diffraction depends upon the width of the diffracting body. For studying the effect of this blockage, numerical simulations are done for the bluff body with different widths, corresponding to blockage ratios ranging from 10
 $\,\%$
to 80
 $\,\%$
of the driver section for DPR 11.30.
The overall flow phenomena remain qualitatively similar across all tested blockage ratios. The key variations arise in the size of the shear layer and the pressure drop in the driver section, as the blockage ratio influences the amount of the expansion wave reflected from the bluff body. Notably, the induced shock is consistently generated and propagates into the driver section across all cases. Additionally, the blockage ratio also affects the speed and strength of the induced shock wave. Figure 27 presents the numerical schlieren images at
 $t= 4\,\mathrm{ms}$
for DPR 11.30, illustrating the qualitative similarities in the flow field for different blockage ratios. As the width of the body increases, the leftward movement of the induced shock towards the driver end is progressively delayed until blockage ratio 50
 $\,\%$
is reached. Beyond this threshold, further increases in body width result in a more rapid movement of the induced shock. These variations are attributed primarily to changes in the size of the shear layer and the pressure drop within the driver section, as the blockage ratio influences the extent of the expansion wave reflected from the bluff body.
Numerical schlieren images for different widths of the bluff body at
 $t= 4\,\mathrm{ms}$
for DPR 11.30.

A time series plot of pressure is recorded at point P, located 20 mm from the tip of the bluff body at a
 $y$
location taken at the midpoint from cavity top wall and body upper surface, for all blockage ratios, as shown in figure 28(a). The plot illustrates a pressure drop at P due to the passage of expansion waves into the driver section. During this phase, the induced shock and associated flow structures develop, influencing the pressure at P. At later times, interactions between the reflected or diffracted expansion waves and the wave patterns formed over the shear layer further reduce the pressure at P. As the expansion wave continues to interact with the shear layer, the induced shock propagates deeper into the driver section, a process that is also evident in figure 28(a). Figure 28(b) compares the pressure drop over time for various blockage ratios, showing that a larger blockage results in a greater pressure drop behind the reflected shock wave in the driven section at a point S, which can be useful for designing driver inserts for chemical kinetics related studies. While this parametric analysis provides useful insights, the objective of the present paper is not to conduct a detailed parametric investigation of blockage effects. Instead, the primary focus is on understanding the expansion wave diffraction process for a given configuration. A comprehensive study on how blockage influences expansion wave diffraction across different geometries will be addressed in a separate publication.
(a) Pressure time series plot for DPR 11.30 for the bluff body at point P, 20 mm away from the bluff body tip. (b) Comparison of pressure profiles with and without driver inserts for different widths of the bluff body and DPR 11.30 at location S in the driven section.