Food proteins and peptides have a special importance due to their ability to form supramolecular structures naturally by a process of self-assembly. This process can be defined by the spontaneous and reversible aggregation due to polymerisation of molecules by non-covalent intermolecular interactions such as hydrogen bonding, electrostatic, hydrophobic, and Van der Waals interactions (Rajagapol & Schneider, Reference Rajagapol and Schneider2004). Enzymatic hydrolysis leads to breakdown of the proteins through smaller protein/peptide fragments depending on degree of hydrolysis. Naturally occurring self-assembly may give rise to fabrication of highly ordered novel nanoscale structures from these fragments. α-Lactalbumin (α-la) is a globular and compact protein with a molecular weight of 14·2 kDa with an ability to form fibrillar nanostructures called ‘nanotubes’. Ipsen et al. (Reference Ipsen, Otte and Qvist2001) reported the first partially hydrolysed α-la with Bacillus licheniformis protease, BLP, which formed strong gels consisting non-branching, hollow, and novel microtubules with a uniform diameter distribution of about 20 nm and lengths exceeding 2 μm. Graveland-Bikker et al. (Reference Graveland-Bikker, Ipsen, Otte and de Kruif2004) investigated the effect of calcium on nanotube growth and gel formation due to self-assembly after limited hydrolysis of α-la. They reported transparent gels with fine strands (nanotubes) having outer and inner diameters around 20 and 7 nm, respectively. Protein hydrolysis, hydrolysis products (building blocks of nanotubes), and nanotube growth kinetics were investigated in detail (Graveland-Bikker et al. Reference Graveland-Bikker, Schaap, Schmidt and de Kruif2006, Reference Graveland-Bikker, Koning, Koerten, Geels, Heeren and de Kruif2009). Nanotube triggered gel formation affected by the certain parameters were also examined (Ipsen & Otte, Reference Ipsen and Otte2003; Ipsen et al. Reference Ipsen, Otte, Qvist, Dickinson and van Vliet2003). Although there are convincing microscopic and kinetic studies, there is a lack of detailed investigation on the structural characterisation of nanotube elongation. Ipsen & Otte (Reference Ipsen and Otte2007) proposed a three stage mechanism for the formation of α-la nanotubes (α-LaNTs): destabilising of the native protein structure, nucleus formation by dimeric building blocks, and elongation of the nuclei into nanotubes. Graveland-Bikker et al. (Reference Graveland-Bikker, Koning, Koerten, Geels, Heeren and de Kruif2009) investigated building blocks of the nanotube structure and proposed a model for the self-assembly of α-la into nanotubes. However, the structural changes in the protein during hydrolysis and nanotube growth have not yet been revealed clearly in literature. The main goal of this research was to investigate such conformational changes occurring in the protein structure during nanotube formation.
Raman spectroscopy is an effective tool to investigate the conformational transitions in proteins by detecting changes in the secondary structure. It provides information related to the vibrational motions of the molecules to be used in prediction or identification of their chemical structures (Nonaka et al. Reference Nonaka, Li-Chan and Naki1993). Backbone vibrations in polypeptides and proteins are usually associated with three main regions in the Raman spectrum (Tu, Reference Tu, Clark and Haster1986; Miura & Thomas, Reference Miura, Thomas, Biswas and Roy1995; Blanch et al. Reference Blanch, Morozova-Roche, Hecht, Noppe and Barron2000). These are the backbone skeletal stretch region of ∼870–1150 cm−1, arising from Cα-C, Cα-Cβ, and Cα-N stretches; the amide III region of ∼1230–1340 cm−1, resulting mainly from in-phase combination of the N–H in-plane deformation vibrations with the Cα-N stretch; and amide I region of ∼1630–1700 cm−1, originating mainly from the C=O stretch.
BLP cuts α-la at aspartic (Asp) and glutamic (Glu) acid sites (Breddam & Meldal, Reference Breddam and Meldal1992) during hydrolysis prior to nanotube development. Carboxylic acid (COO−) groups exposed at these ends become available for cation chelation. Ca++ ions act as intermolecular salt bridges between carboxylates of different peptide units and they are involved in the nanotube elongation (Ipsen & Otte, Reference Ipsen and Otte2007). Fourier-transform infrared (FTIR) spectroscopy is used to determine the interactions of Ca++ binding to α-la through the coordination of COO− groups (Nara et al. Reference Nara, Tasumi, Tanokurab, Hiraoki, Yazawa and Tsutsumi1994; Mizuguchi et al. Reference Mizuguchi, Nara, Kawano and Nitta1997). Absorption in amino acid side chains provides valuable information about molecular reaction mechanisms and structural changes in proteins. Amide modes are used to analyse polypeptide backbone vibrations in proteins (Krimm & Bandekar, Reference Krimm and Bandekar1986; Barth, Reference Barth2007). Amide I band around 1650 cm−1, arises from C=O stretching vibrations; amide II band around 1550 cm−1 arises from the combination of N-H bending and C–N stretching vibrations; and amide III mode in the region of 1400–1200 cm−1 arises from the combination of N–H bending and C–N stretching vibrations. The amide I vibration region is mostly used to analyse the secondary structure in proteins. This vibration is hardly affected by the nature of the side chain depending on the secondary structure of the backbone. Amide II and III bands also provide valuable structural information in proteins.
Due to a number of characteristics, α-LaNTs have been suggested for various potential food (viscosifying, gelation and encapsulation) and non-food (scaffolding) applications (Graveland-Bikker & de Kruif, Reference Graveland-Bikker, Schaap, Schmidt and de Kruif2006). For such applications, both mechanical and structural properties of nanotubes should be known clearly. Especially, the knowledge of the secondary structure of the nanotubes and nanotube formation process is very important for a better understanding of the characteristics of the nanotubes.
The objectives of this study were to investigate structural conformations in the α-la during the hydrolysis and nanotube formation, and the Ca++ binding sites involved in nanotube elongation using FTIR and Raman Spectroscopy.
Materials and methods
Materials
All chemicals and standards used in this work were purchased from Sigma (Germany). Bacillus licheniformis protease (BLP), 2·4 AU-A/g, was kindly provided by Novozymes A/S (Bagsvaerd, Denmark). Low protein binding filters (0·1 μm) were purchased from Millipore (Merck KGaA, Darmstadt, Germany). Copper grids were supplied by Electron Microscopy Sciences (USA).
Enzymatic Hydrolysis of α-la (sample preparation)
The formation of α-LaNTs was achieved according to Graveland-Bikker et al. (Reference Graveland-Bikker, Ipsen, Otte and de Kruif2004). Three per cent (w/v) of α-la (Sigma L6010) was dissolved in 75 mm Tris–HCl, pH 7·5, and CaCl2 with the ratio of 2:1 (mol Ca++: mol α-la), and 4 % BLP (w/w) were added. After mixing, the solution was filtered immediately through 0·1 μm low protein binding filter to remove impurities. Then, the solution was incubated at 50 °C for 1·5 h for enzymatic hydrolysis and nanotube development by self-assembly. At the end of the incubation, samples were stored at +4 °C for further analysis. For Raman and FTIR analyses, native α-la was prepared by dissolving in tris buffer, and α-la hydrolysates were prepared by limited proteolysis of α-la with BLP.
Microscopy
To confirm nanotube growth before optical investigations, constructed α-LaNTs were examined by Transmission Electron Microscopy (TEM) and Atomic Force Microscopy (AFM). Samples for TEM were taken from the reaction mixture at the end of the incubation and diluted as 1000 fold. Ten μl of sample was placed onto carbon coated copper grids and dried at RT. The structures were then examined by TEM at 80 kV (FEI Technai Spirit, The Netherlands). Samples were also examined by Scanning Electron Microscopy (sem) with an STEM detector operating at 12 kV (FEI Quanta 250FEG, The Netherlands).
For AFM, 10 μl of a sample (1000 fold-diluted) was placed onto mica and/or glass surfaces. After drying for overnight at RT, the structures were examined by AFM, MMSPM Nanoscope IV (Veeco, USA). A silicon cantilever, f 0: 330–359 kHz and k: 12–103 N/m, (Veeco, USA) was used.
Raman spectroscopy
A confocal Raman system (S&I Germany, based on Princeton Instruments, USA) was used to obtain the Raman data of α-la samples. Ten μl samples were dropped onto glass slides to be placed under the objective of an Olympus microscope which directs the selected laser beam (488 nm argon ion laser, 120 mW power) onto the sample and collects the Raman signal. The signal is then sent to a monochromator (700 mm focal length, Princeton Instrument) to obtain the spectrum data which is recorded by a CCD camera. The data is then sent to the computer which controls the Raman system as well. Typical resolutions based on the chosen gratings in the monochromator (150, 600, or 1800 groves/mm) change from 1 to 10 cm−1 and the entrance slit width (mostly 100 μm is used). Typical Raman data is obtained as the average of 50 scans with one second accumulation each. Raman shifts were recorded in the Stokes side usually from 100 to 4000 cm−1 away from the Rayleigh line.
FTIR spectroscopy
FTIR measurements were carried out at RT using a Perkin-Elmer Spectrum 100 FTIR Spectrometer (Perkin Elmer Inc., Wellesley, MA) equipped with a horizontal ATR sampling surface (ZnSe crystal) and a deuterated tri-glycine sulphate (DTGS) detector. One hundred μl samples were placed onto a crystal surface and the measurements were taken in the range of 4000–600 cm−1. The resolution was 4 cm−1 and 64 scan were recorded per each spectrum with a scan speed of 1 cm/s. A background was recorded before each measurement. Deconvolution of the data was performed with the parameters, γ: 0·75 and L: 15 cm.
Results and discussion
Microscopic analysis of α-LaNTs
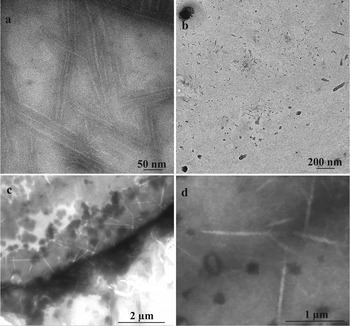
Partial hydrolysis of α-la by BLP in the presence of calcium resulted in the formation of nanotubular structures through self-assembly. Figure 1a–d shows TEM and STEM images of α-LaNTs, respectively. The observed structures were longer than 100 nm and about 20 nm in diameter. The dimensions and morphologies of the structures showed consistency with the literature (Ipsen et al. Reference Ipsen, Otte and Qvist2001; Graveland-Bikker et al. Reference Graveland-Bikker, Ipsen, Otte and de Kruif2004). Ca++ ions added to medium act as bridges between peptides produced during the hydrolysis and trigger nanotube formation (Ipsen & Otte Reference Ipsen and Otte2007). In order to test this, only α-la and BLP were mixed and incubated. Figure 1b indicated that, no nanotubular structures were obtained without addition of calcium. This finding supports the crucial importance of calcium when producing α-la nanotubes by self-assembly process.
Transmission electron micrographs of (a) α-LaNTs and (b) α-La hydrolysed by BLP. (c) and (d) Scanning transmission electron micrographs of α-LaNTs.

α-LaNTs were reported as hollow tubes in the literature (Graveland-Bikker & de Kruif, Reference Graveland-Bikker and de Kruif2006). In Fig. 1c and d STEM images show such hollow tubules with brighter inner parts. Also, interferences occurred at the points where the tubules crossover (Fig. 1c). Some nanotubes seemed as wider or thicker which is supposed to be due to the attachment and/or overlapping of the strands. Typically, nanotubes were unbranched but, occasionally, three-way junctions were also observed (Fig. 1d). Cryo-electron microscope image of such a junction has already been (Graveland-Bikker et al. Reference Graveland-Bikker, Koning, Koerten, Geels, Heeren and de Kruif2009).
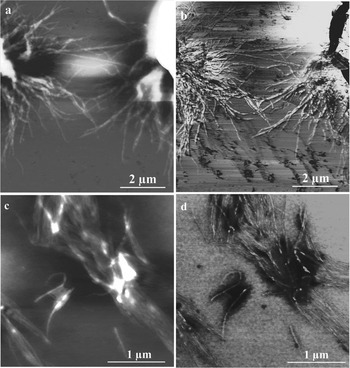
AFM images of α-LaNTs were also obtained. Figure 2a and b show typical images of α-LaNTs prepared by molar Ca++: α-la ratio of 2 (R=2) attached to a glass slide. Figure 2c and d show α-LaNTs with R=5 on a mica surface. Nanotubes seemed to be attached to each other or joined end to end. The length of the linear tubules was as long as 1 μm or even longer. Their apparent diameters were in the range of 50–80 nm (mostly about 70 nm). In literature, the apparent width of α-LaNTs visualised by SFM (Scanning Force Microscopy) was reported as about 60 nm (Graveland-Bikker et al. Reference Graveland-Bikker, Schaap, Schmidt and de Kruif2006). The difference in the nanotube dimensions, especially in the widths, between AFM and TEM/STEM results arises from a lateral dilation caused by the force microscope tip in AFM with a nominal tip radius in between 48–52 nm.
AFM images of α-LaNTs. (a) and (b) shows height and phase images with R=2, while (c) and (d) shows those with R=5. R: mol Ca++/mol α-La.

Raman analyses of α-la, hydrolysates and α-LaNTs
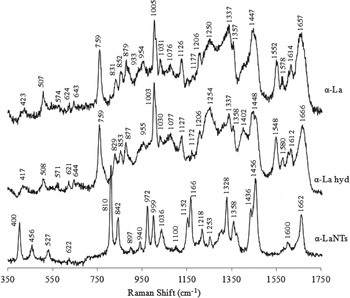
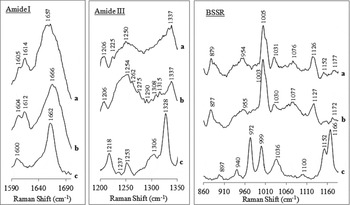
Raman spectroscopy analyses were carried out to investigate the structural changes of α-la during hydrolysis and nanotube formation. Figure 3 shows typical Raman spectra of α-la protein, its hydrolysates and α-la nanotubes. Backbone skeletal region, amide III and amide I regions were presented more closely in Fig. 4. Major peaks detected in each spectra were evaluated based on current literature (Lord & Yu, Reference Lord and Yu1970; Rava & Spiro, Reference Rava and Spiro1984; Miura et al. Reference Miura, Takeuchi and Harada1989; Nonaka et al. Reference Nonaka, Li-Chan and Naki1993; Miura & Thomas, Reference Miura, Thomas, Biswas and Roy1995; Ikeda & Li-Chan, Reference Ikeda and Li-Chan2004; Ashton & Blanch, Reference Ashton and Blanch2010). They are listed in Supplementary Table 1 accessible in on-line version of the paper (http://www.journals.cambridge.org/dar).
Raman spectra (250–1750 cm−1) of α-La, α-La hydrolysates and α-LaNTs.

Smoothed Raman spectra of amide III and BSSR (backbone skeletal stretch region) regions (a) α-La, (b) α-La hydrolysates and (c) α-LaNTs (smoothing achieved by taking average of three neighbouring data).

Although many features observed in α-la proteins also observed in their hydrolysates and nanotube Raman spectra, there exist clear and important differences between the nanotube and the other Raman spectra. For native α-la, amide I region indicated a large loop containing α-helix, β-sheet and disordered structures with the assignments between 1645–1680 cm−1. This broad band is centred at 1657 cm−1 corresponding to a mainly helical structure (Fig. 3). In the hydrolysates, β-sheets became dominant as evident by the band at 1666 cm−1 (Miura & Thomas, Reference Miura, Thomas, Biswas and Roy1995; Ashton & Blanch, Reference Ashton and Blanch2010). The band observed at 1402 cm−1, indicating a symmetric carboxylate stretch, in the hydrolysate spectrum is probably due to the exposure of free COO− groups at the digested Asp and Glu sites during the hydrolysis. No peaks at this region were seen in the nanotube spectrum. This is because the peptides are linked by Ca2+ ions at these COO− sites through nanotube elongation. Raman spectrum of the nanotubes exhibited stark differences from that of α-la and hydrolysates. Most probably, this is due to a novel conformational arrangement of peptides to form nanotubes. In that case, some bands become Raman active, while some others become Raman inactive. Besides, various shifts and intensity changes are also possible. Conformation-sensitive amide I region was seen near 1662 cm−1 with a narrower peak and reduced intensity in the nanotube spectrum. However, the bands at ∼1578 and 1552 cm−1, representing the trptophan side chain in the amide II region had disappeared. Tryptophan band at ∼1357 cm−1 gained intensity and sharpness in the nanotube spectrum. The other conformational-sensitive region, amide III, was detected in the region between ∼1218 and 1337 cm−1. Tryptophan band seen at 1337 cm−1 in native α-la lost intensity in hydrolysate spectrum. However, in the case of nanotubes two possibilities could be considered. This band might shift to 1328 cm−1 (about 11 cm−1) and become sharper, or the peak at 1337 cm−1 become inactive and a new peak at 1328 cm−1 arises from the stretching of new bonds formed during nanotube formation. This band is assigned to 310 helix or to residues having local order like that of 310 helix at the ends of α- helices or in loops (Wilson et al. Reference Wilson, Ford, Cooper, Hecht, Wen and Barron1995; Blanch et al. Reference Blanch, Morozova-Roche, Hecht, Noppe and Barron2000). The α-LaNTs occurs via β-sheet stacking, leading to 10-start right handed-helix (Graveland-Bikker et al. Reference Graveland-Bikker, Koning, Koerten, Geels, Heeren and de Kruif2009). The presence of a band around 1310 cm−1 in hydrolysate (1308, 1315 cm−1) and nanotube (1306 cm−1) spectrum is attributed to α-helix structure (Spiro & Gaber, Reference Spiro and Gaber1977). A broad band, assigned as polyproline II-helix, centred at 1250 cm−1 in α-la spectrum shifted to 1254 cm−1 in hydrolysate gels with an increased intensity and to 1253 cm−1 in nanotubes with a decreased intensity. Also intensity gains at 1262, 1275, 1290, 1308, and 1315 cm−1 are attributed to the increase in the number of α-helix and disordered structures in hydrolysates due to hydrolysis and gel formation (Ikeda & Li-Chan, Reference Ikeda and Li-Chan2004). Additionally, the band at 1225 cm−1 detected in protein disappeared in hydrolysates and nanotubes while, a new sharp band appearing at 1218 cm−1 and a weak band at ∼1237 cm−1 were detected in nanotubes. The bands at ∼1230–1245 cm−1 are assigned as β-sheet structures (Miura & Thomas, Reference Miura, Thomas, Biswas and Roy1995). Also, one at 1218 cm−1 could appear to be a distinct variant of β-strand or sheet (Barron et al. Reference Barron, Blanch and Hecht2002). Tyrosine and phenylalanine peaks at ∼1206 cm−1 had also disappeared in nanotubes. The weak tyrosine and phenylalanine bands at ∼1177 cm−1 gained a little intensity in hydrolysates, but in nanotubes, they shifted to 1166 cm−1 with significantly increased intensity or this band disappeared and a new sharp band was born due to stretching of new bonds. Another conformation-sensitive region with backbone skeletal stretchings showed considerable changes especially in the nanotube spectrum. The weak peak at 1152 cm−1, originating mainly from C–N stretchings (Nonaka et al. Reference Nonaka, Li-Chan and Naki1993) appeared with an intensity loss in the hydrolysate gels, but with a significant intensity gain in the nanotubes. Tryptophan band at ∼1126 cm−1 was also detected in hydrolysates with a small intensity change, but it was not present in the nanotubes. The band attributed to the backbone skeletal stretch at ∼1076 cm−1 had gained a little intensity in the hydrolysates and became inactive in the nanotubes also. Phenylalanine peaks at ∼1031 and 1005 cm−1 were expected to shift to 1036 and 999 cm−1 with considerable changes in their intensities. A new peak was detected at 972 cm−1 in the nanotube spectrum. The bands at ∼954 cm−1 (assigned as disordered structures), ∼879 cm−1 (tryptophan), ∼831/852 cm−1 (tyrosine Fermi doublet) were also detected in the hydrolysate spectrum with small shifts and intensity changes. However, they had disappeared in the nanotube spectrum which exhibited new bands at 940, 897, 842 and 810 cm−1. A distinct Trp band at 759 cm−1 became Raman inactive in the nanotube spectrum. The band around 507 cm−1 is assigned as disulphide bonds in gauche-gauche-gauche conformation, minor bands at around 525 and 540 cm−1 are assigned as those in gauche-gauche-trans and trans-gauche-trans conformations, respectively (Nakanishi et al. Reference Nakanishi, Takesada and Tsuboi1974; Kitagawa et al. Reference Kitagawa, Azuma and Hamaguchi1979). S–S peak in native α-la at 507 cm−1 was also observed in hydrolysates with a decreased intensity and as a broader band, however the minor band at ∼542 cm−1 disappeared. Nonaka and co-workers studied the structure of α-la gels with Raman spectroscopy and reported that conformation of S–S bonds was altered in the native α-la after heating at 90 °C (Nonaka et al. Reference Nonaka, Li-Chan and Naki1993). Similarly taken data may show the loss of native forms of disulphide bonds by the alteration of conformation due to hydrolysis and gelation. The band representing disulphide bonds was detected at 527 cm−1, instead at ∼507 cm−1 in nanotube spectrum, suggesting dominant gauche-gauche-trans conformation, which most probably, arose from a rearrangement of peptides in the nanotubes.
It is reported in the literature (from the CD-spectra analysis) that the secondary structure of the α-la is largely retained during nanotube formation (Graveland-Bikker et al. Reference Graveland-Bikker, Koning, Koerten, Geels, Heeren and de Kruif2009). Our findings also support this idea.
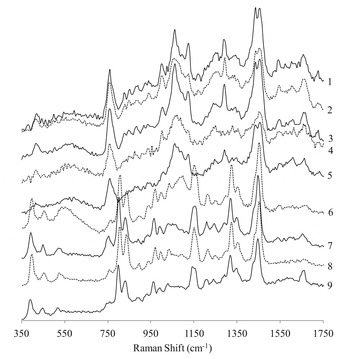
In order to follow the structural changes during the nanotube growth as a function of time, ten-minute samples were taken during incubation and examined with Raman spectroscopy. Figure 5 shows Raman spectra of samples whose incubation times change from 10 to 90 min with 10 min intervals. It is clear that nanotube spectrum appeared roughly after 60th min of incubation. Although small shifts and some secondary changes were observed for samples with longer growth durations than 60 min, the assignments were internally consistent. Using the DLS (dynamic light scattering) technique, Graveland-Bikker et al. (Reference Graveland-Bikker, Ipsen, Otte and de Kruif2004) found that the nanotube elongation starts at ∼ 50th min of incubation. Our findings confirm the literature but using a new approach, that is, Raman spectroscopy. In the Raman spectra of samples up to 50 min incubation, protein and peptide dimmer features were dominant. For samples with longer incubations than this, nanotube spectra were clearly observed. Based on these spectra we can only make qualitative assessments of the observed changes during the nanotube growth as a function of time. We cannot exactly say that the particular nanotube bands increases linearly with time. However, there is a sharp increase in the nanotube band intensities indicating a quick saturation effect in the nanotube concentration. However, Raman results should be evaluated statistically since firstly, each Raman spectrum depends strongly on the particular sample point from which the data is taken, and secondly, many samples with same growth durations should be produced for Raman investigations. These tasks require detailed research of its own right. Carrying out such a research for more quantitative results are also planned for our future studies.
Raman spectra of the samples taken during nanotube growth with 10 min intervals. Numbers (1–9) indicate sample numbers collected from 10th to 90th min along incubation.

FTIR analyses of α-la, hydrolysates and α-LaNTs
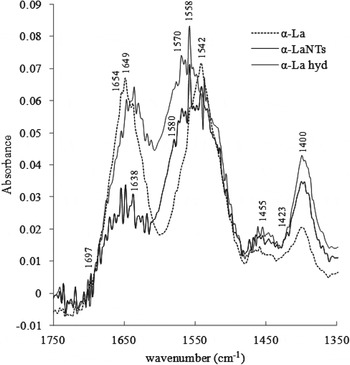
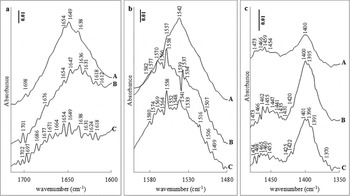
We have also carried out FTIR analyses for a better evaluation of structural changes of α-la during nanotube formation process and investigation of Ca++ binding sites involved in nanotube elongation. Figure 6 represents Fourier-self deconvolved infrared spectra of α-la protein, α-la hydrolysates and α-LaNTs, where the Tris buffer spectrum was subtracted from each. Enlarged amide regions are also given in Fig. 7. Major bands detected in each spectra were analysed by considering current literature (Ambrose & Elliot, Reference Ambrose and Elliot1951; Anderle & Mendelsohn, Reference Anderle and Mendelsohn1987; Jackson & Mantsch, Reference Jackson and Mantsch1995; Xie & Liu, Reference Xie and Liu2003; Kong & Yu, Reference Kong and Yu2007). Supplementary Table 2 listing assignments of major peaks and Supplementary Table 3 listing infrared bands of Asp and Glu side chains are accessible in on-line supplement (http://www.journals.cambridge.org/dar).
Fourier-self deconvolved spectra of α-La, α-La hydrolysates, and α-LaNTs.

Fourier-self deconvolved spectra enlarged in the regions of (a) 1715–1600 cm−1; (b) 1600–1480 cm−1; (c) 1480–1350 cm−1. (A) α-La, (B) α-La hydrolysates and (C) α-LaNTs.

In each spectrum, four broad regions are observed. They are assigned as: amide I band at ∼1649 cm−1, the COO− antisymmetric stretching bands at about 1580/1558 cm−1 overlapping with amide II band at ∼1550 cm−1, CH2 bending vibration band at ∼1460 cm−1, and the COO− symmetric stretching band at around 1400 cm−1 (Fig. 6). Native α-la consists of α-helix, β-sheet and random structures evident by the bands at 1698/1638 cm−1 and 1654/1649 cm−1. When hydrolysed, the amide I peak intensity decreased slightly, and β-sheets and turns become dominant which is evident from the new peaks detected between 1612 and 1636 cm−1, and 1676/1701 cm−1 (Fig. 7a). In case of the nanotubes, band intensities decreased significantly and numerous new peaks attributed to all secondary structure elements appeared. They are at around 1618–1638 cm−1 (β-sheets/aggregated strands), 1664–1686 cm−1 (β-turns), 1697–1702 cm−1 (β-sheets). Two possibilities may be considered for this striking intensity loss in the case of the nanotubes: the decrease in the number of bonds giving the corresponding bands displayed in the native protein, and/or the decrease in the activities of these infra-red-active bands of the native protein. After the tertiary structure of α-la was disturbed due to the hydrolysis, a new arrangement of peptides for nanotube formation may have caused an increase in the amount of exposed β-sheets, turns and helix structures.
During hydrolysis of α-la, BLP digests the protein at aspartic (Asp) and glutamic (Glu) acid sites. Carboxy moiety released at Asp and Glu sites available for cation chelation give infrared bands at 1574–1579 and 1404 cm−1 (for Asp), and 1556–1560 and 1402 cm−1 (for Glu) (Barth, Reference Barth2007). Mizuguchi et al. (Reference Mizuguchi, Nara, Kawano and Nitta1997) examined the relationship between the type of coordination and the stretching of COO− groups in the Ca++ binding site of bovine α-la. They reported that both Ca++-free and Ca++-binded α-la showed two major bands at 1588 and 1578 cm−1 in COO− antisymmetric stretching region with lower intensity in the free form. Also, Ca++ binding resulted in the shift at the peak around 1400 cm−1 with splitting two components, 1403 and 1425 cm−1 by gaining intensity, through binding of Ca++ to the COO− groups in the high affinity binding site. Similarly, in our study, the single band at 1400 cm−1 in the native α-la appeared as three bands at 1420, 1400 and 1395 cm−1 in hydrolysates by gaining significant intensities (Fig. 7c). In nanotube spectrum, these were detected with a very small shift (∼1–2 cm−1) and intensity greater than α-la and lower than hydrolysates. Also a shoulder type bands at 1425 and 1391 cm−1 appeared. During hydrolysis, this high affinity calcium binding site should also be exposed, thus giving rise to the intensity increase; however, by the nanotube elongation Ca++ ions link the peptides, thus fewer free sites are left which is seen as a decrease in the intensity. Smaller intensity changes were detected in the amide II region, for the three protein samples, compared with amide I region. In the hydrolysates, the band at 1542 cm−1 were lost and two new peaks appeared at 1537 and 1534 cm−1, whereas in the nanotubes the band at 1541 cm−1 retained with lower intensity, and a new band detected at 1533 cm−1 (Fig. 7b). The other Ca++ binding site (belonging to of Glu) at 1558 cm−1 gained much intensity in both hydrolysates and nanotubes. Two more signals appeared at 1577 and 1582 cm−1, and 1574 and 1580 cm−1 in the hydrolysate and nanotube spectra, respectively, due to another calcium binding site of aspartic acid. The broad weak band centred at ∼1460 cm−1 in protein gained intensity in both hydrolysates and nanotubes. In addition, numerous features were observed between 1431 and 1474 cm−1 arising from C-H bending vibrations (Barth, Reference Barth2007).
In summary, FTIR and Raman Spectroscopy indicated structural conformations in α-la during the hydrolysis and nanotube growth. The native tertiary structure of α-la was destabilised, and some conformational changes were observed in the secondary structure of the protein. The β-sheets (esp. antiparallel), β-turns and random structures became dominant due to dimerisation and re-arranged supramolecular structure during nanotube formation. Also, in the helix domain, 310 helix structures seemed to gain importance besides α-helix. Enzymatic hydrolysis resulted in the exposure of COO− groups at Asp and Glu side chains in the peptides. Then, Ca++ ions were predicted to bind peptides at these groups which led mainly to the nanotube elongation. FTIR spectroscopic analysis showed some shifts, gain and lose of intensities at the related bands due to Ca++ binding to COO− groups of these specific sites.
Supplementary material
The supplementary material for this article can be found at http://www.journals.cambridge.org/dar
We would like to thank Associate Professor Banu Özen for her help in the FTIR analyses. We also thank to Central Lab in METU for TEM analyses and Center for Material Research in IZTEC for STEM and AFM analyses. This work was supported financially by the The Scientific and Technological Research Council of Turkey (109O866, 2010–2011) and İzmir Institute of Technology, Scientific Research Projects fund (İYTE03, 2009–2011).